Thompson and Schwalbach (1995) found that unlimited radius point ..... observer variability (Cyr 1981, Ramsey and Scott 1981) that are more pronounced.
Variation in Bird Detection Probabilities and Abundances Among Different Point Count Durations and Plot Sizes Greg M. Forcey,1 West Virginia University, Division of Forestry, P.O. Box 6125, Morgantown, WV 26506 James T. Anderson, West Virginia University, Division of Forestry, P.O. Box 6125, Morgantown, WV26506 Abstract: Avian points counts are commonly used to inventory bird species composition and abundance. When designing a study to inventory birds using point counts, point plot size and count duration are 2 variables that must be considered based on project goals. We conducted double-observer point counts on the Camp Dawson Collective Training Area, Preston County, West Virginia, during 2000 and 2001 to ascertain how detection probabilities and abundance estimates are affected by different plot sizes and durations. We conducted point counts from dawn to 1000 hours, and sub-tallied birds into different distance (0-100 m) andtime(0-5-10 minute) intervals. We used program DOBSERV to generate species-specific detection rates and abundances for the different distance and time intervals. Detection probabilities were greatest for 50-m radius point counts and least for unlimited-radius counts (P < 0.05). Three minute counts produced the greatest detection rates whereas probabilities were least for 10-minute counts (P < 0.05). Abundance estimates were least for 50-m radius point counts and greatest for unlimited-radius counts (P < 0.05). Three-minute counts produced the lowest abundances and 10-minute counts produced the greatest abundance estimates (P < 0.05). Lower detection probabilities for 10minute counts likely occurred because a majority of birds had already been recorded at the beginning of the count. Low detection probabilities with unlimited-radius point counts can be attributed to the increasing difficulty of detecting birds at longer distances. Abundance estimates were greater for 10-minute and unlimited-radius point counts because more time and area is available in which to detect birds. Project objectives will ultimately dictate the count duration and plot size to use when conducting avian point counts. Proc. Annu. Conf. Southeast. Assoc. Fish and Wildl. Agencies: 56:331-342
Traditional single-observer point counts are a standard method used to inventory bird species composition and abundance (Ralph et al. 1993, Hamel et al. 1996) but do not permit investigators to calculate detection probabilities for each bird species. Because detection probabilities are often unknown, point count data could be unreli1. Present address: Department of Biological Sciences, Stevens Hall, North Dakota State University, Fargo, ND 58105.
2002 Proc. Annu. Conf. SEAFWA
332 Forcey and Anderson able because birds that are present but not detected are not considered (Thompson 2002). Two new point count approaches have been developed to address this issue and allow investigators to calculate bird detection probabilities: the double observer approach (Nichols et al. 2000) and a removal model (Farnsworth et al. 2002). The double-observer approach is modified from a technique designed by Cook and Jacobson (1979) to estimate detection probabilities from aerial surveys. Detection probabilities and corresponding abundance estimates derived from double observer point count data are likely to be more robust than numbers estimatedfromsingle-observer point counts (Nichols et al. 2000). The removal model computes detection probabilities from point count data collected among different time intervals (Farnsworth et al. 2002). One advantage of this approach may have over the doubleobserver technique is that the model assumes avian singing frequency influences bird detection probabilities, which it likely does (Mayfield 1981). Another advantage of the removal model is it can be applied to existing point count data provided that investigators tallied birds into different time categories (Farnsworth et al. 2002). Avian point counts are subject to a plethora of variables that may affect data quality and quantity collected. Some of these variables include point count duration (Buskirk and McDonald 1995, Dawson et al. 1995, Petit et al. 1995, Detoners et al. 1999, Thompson et al. 2002), plot size (Bart and Schoultz 1984, Bart 1985, Petit et al. 1995, Thompson and Schwalbach 1995, Thompson et al. 2002), sample size (Thompson and Schwalbach 1995), and sampling effort (Smith et al. 1995). Other uncontrollable factors such as weather (Robbins 1981a) and dailyfluctuationsin bird activity (Skirvin 1981, Robbins 1981è) also can affect point count data. However, these variables have not been investigated when using the double-observer method for counting birds. Point count duration influences accuracy of bird abundance and species composition estimates. Buskirk and McDonald (1995) found that a 3-minute point count detects only about 33% of the total species and 25% of the individuals at a point. A 10minute count increases the total number of species detected to 47% and 37% for individuals. Although the percentage of species recorded is less than 100%, point counts longer than 10 minutes did not significantly increase the number of individuals recorded (Petit et al. 1995). In addition, point counts longer than 10 minutes significantly reduce sample size (because fewer points can be surveyed per unit time) and increase sampling error (Smith et al. 1998). This increase in standard error will reduce statistical power of data and reduce the ability to detect noticeable changes in bird abundances. Plot size also influences bird detection probabilities and abundance estimates. Plot size refers to how far birds are recorded from the point center (i.e., 50 m, 100 m, unlimited radius). In general, larger plot sizes will result in a greater number of bird detections. Thompson and Schwalbach (1995) found that unlimited radius point counts resulted in the greatest number of bird detections per plot, followed by 70-m and 50-m radius plots. Similarly, Savard and Hooper (1995) discovered that unlimited radius point counts resulted in the highest number of bird detections for grassland birds compared tofixedradius counts. 2002 Proc. Annu. Conf. SEAFWA
Avian Detection Probabilities 333 It is intuitive that detection probabilities and abundance estimates vary among different point plot sizes and point count durations. However, because previous studies comparing bird abundance among different plot sizes and durations used singleobserver point counts, they were unable to examine how detection probabilities and corresponding abundance estimates vary among these treatments. Our study evaluates how avian detection probabilities and abundances derived from the double-observer technique vary among different point plot sizes (50 m, 100 m, and unlimited radius) and point count duration (3 minutes, 5 minutes, and 10 minutes). We thank F.K. Ammer and L. Toothman for serving as field assistants during this study. P.B. Wood and L.B Williams provided comments on earlier drafts of this manuscript. Statistical assistance provided by G.E. Seidel also is greatly appreciated. We appreciate manuscript comments from MJ Chamberlain and 2 anonymous reviewers. We also thank the West Virginia Army National Guard, the West Virginia University Research Corporation, and the West Virginia University Davis College of Agriculture, Forestry, and Consumer Sciences (Mclntire-Stennis) for funding this research. This is manuscript number 2820 of the West Virginia University Agricultural and Forestry Experiment Station. Methods Study Area
The Camp Dawson Collective Training Area (Camp Dawson) is comprised of 1,655 ha distributed among 3 tracts (W. Va. Army Natl. Guard, unpubl. rep., Kingwood, W Va., 2001). Elevation rangesfromabout 450 m to 840 m. Camp Dawson is primarily used for military training during summer months; however, land use varies among the 3 tracts (Forcey 2002). Areas of high elevation contain a mixture of chestnut oak (Quercus prinus), scarlet oak (Q. coccínea), and black oak (Q. velutina). Lower elevations contain a mixture of yellow-poplar (Liriodendron tulipifera), white oak (Q. alba) and red oak (Q. rubra; J. Vanderhorst, unpubl. rep., W. Va. Div. Nat. Resour., Elkins, W. Va., 2001). Point Count Sampling
We randomly established 100 point locations on Camp Dawson in 2000; in 2001, we placed 37 additional points in areas that were not covered during 2000 (Forcey 2002). We placed points along transects across the entire study area. To randomize point locations, we used a random numbers table (SAS Inst. 1988) containing values from 1-50. The random number drawn for each point corresponds to the number of additional meters to walk beyond the minimum 250-m point spacing distance (Hamel et al. 1996). Point locations were marked with redflaggingtape and recorded with a Trimble Global Positioning System (Trimble Navigation, Sunnyvale, Calif.). We stratified points among habitats based on the proportion of each habitat that occurred on each tract (Forcey 2002). Edge and interior effects also were considered in habitat classifications. Edge was defined as the location where 2 distinct vegetative 2002 Proc. Annu. Conf. SEAFWA
334 Forcey and Anderson types or land uses met (Yahner 1995). Points located within interior habitats were at least 100 m from an edge. Habitat types included: 1) forest edge—wooded areas adjacent to grasslands, lawns, roads, or developed areas (N = 43 points); 2) forest interior—forested tracts >100 m from a clearing or edge (N = 39 points); 3) riparian edge—locations within 25 m of standing or moving water adjoining grasslands, lawns, roads, or developed areas (N = 22 points); 4) riparian interior—areas within 25 m of standing or moving water within forest interior habitats (І = 12 points); 5) reclaimed mine areas—formerly mined areas in early successional stages containing mixtures of grassland and shrub vegetation (N= 18 points); and 6) developed areas— locations containing 1 or more buildings created by humans (N=3 points). We conducted point counts along with a second observer during the summers of 2000 and 2001 using the double�observer approach (Nichols et al. 2000). The double�observer technique uses 2 observers: a primary observer and a secondary observer. The primary observer identified and verbally communicated all birds he/she detected to the secondary observer. The secondary observer recorded this information and also any birds that were not detected by the primary observer. These data allow a detection probability and estimated abundance to be calculated for each bird species using the program DOBSERV (Nichols et al. 2000) which uses the SURVIV code (White 1983). We surveyed point locations once between 2 June and 7 July in 2000 and again between 22 May and 16 July in 2001 using the double�observer approach. We conducted point counts from dawn to 1000 hours for 10 minutes at each location (Hamel et al. 1996, Forcey 2002). We conducted point count surveys with different second observers in 2000 and 2001. We trained observers in bird identification (both visual and aural) and distance estimation before point count surveys. All observers had previous experience with visual and aural bird identification, so training mostly served as a review and for learning unfamiliar bird species. We recorded distance from the center point (0�100 m), time interval observed (0�5�10 minutes), gender, whether the bird was visually identified, and if only the secondary observer detected the bird for each bird detected during the point count (Hamel et al. 1996, Nichols et al. 2000). Data Analysis We generated a detection probability and abundance estimate for each bird species recorded a 10 times within each habitat for each point plot size or count duration. Flyovers were not used in plot size analyses but were included in count duration analyses. A detection probability was defined as the probability of 1 or both observers detecting an individual of a particular species. We combined point count data over both years to increase sample size and because detection probabilities and abundance estimates were similar between years (P > 0.05; Forcey 2002). We generated detection rates and abundances using the most appropriate model for each data set according to Akaike's information criterion (Burnham and Anderson 1998, Nichols et al. 2000). We used rank transformations (Conover and Iman 1981) on detection
2002 Proc. Annu. Conf. SEAFWA
Avian Detection Probabilities 335 probabilities and abundances and compared these among habitat and plot size or plot size and point count duration using 2-way analysis of variance (ANOVA; Cody and Smith 1997). If interactions between habitat and either plot size or count duration occurred, these variables were examined within each habitat. We conducted post hoc comparisons using Tukey's honestly significant difference test (SAS Inst. 1988) and used a significance level of a = 0.05 for all statistical tests. Results We detected 103 species of birds on Camp Dawson over the 2-year study period; 93 species were observed in 2000, 92 species were observed in 2001. Of these, we used 95 species in the point count duration analyses and 85 species in the plot size analyses (Forcey 2002). Forcey (2002) reported detection probabilities and abundance estimates specific to each species within each distance or time category. Detection probabilities from double-observer point counts decreased as plot size increased. No interaction was found between habitat and plot size (F = 0.14, df = 10, 727, P = 0.99) for detection probabilities. Mean species-specific detection probabilities across all species varied among all plot sizes (50 m: x = 0.994, SE = 0.0005; 100 m: x = 0.991, SE = 0.0002; unlimited-radius: x = 0.979, SE = 0.0024) for point counts (F= 34.97; df = 2,727, P < 0.001). Downy woodpeckers (Picoidespubescens), acadianflycatchers(Empidonax virescens), white-breasted nuthatches (Sitta caroliniensis), and rose-breasted grosbeaks (Pheucticus ludovicianus) had detection probabilities approaching 1.0 and were consistent across different point plot sizes (Forcey 2002). American robins (Turdus migratorius) had slightly lower detection probabilities than most other species (e.g., 0.76 during unlimited-radius counts). Bird abundance estimates across all species increased as plot size increased. No interaction was present between habitat and plot size for abundance analyses (F=0.06, df = 10, 727, P = 1.00). Mean species-specific abundance estimates varied (F = 15.47, df=2,727, P < 0.001) across all plot sizes (50 m: x = 6.44; SE = 0.59; 100 m: x = 9.33, SE = 0.87; unlimited-radius: x = 13.60, SE = 1.25) for point counts. Species-specific detection probabilities and abundance estimates varied among different point count durations (Table 1). An interaction was present between habitat and count duration for detection probability analyses (F = 2.05, df = 10, 803, P = 0.03), therefore detection probability comparisons were performed separately for each habitat type (Table 1). Mean species-specific detection probabilities decreased with increasing count duration within forest interior,riparianedge, riparian interior, and reclaimed mine habitats (Table 1). Bird species with high detection probabilities (1.0) in 3- and 5-minute point counts included yellow-breasted chat (Icteria virens), red-winged blackbird (Agelaius phoeniceus), and house sparrow (Passer domesticus). Species with lower detection probabilities during short point count durations included hairy woodpecker (Picoides villosus) (0.95) and American robin (0.90). Mean species-specific abundance estimates had a positive relationship with increasing point count duration. Mean abundances were 8.95 (SE = 0.87) for 3-minute point counts, 11.09 (SE = 0.99) for 5-minute point counts, and 13.77 (SE =1.19) for 2002 Proc. Annu. Conf. SEAFWA
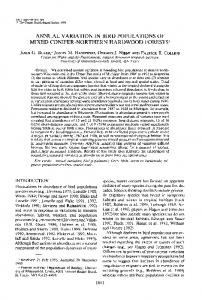
336 Forcey and Anderson Table 1. Mean species-specific detection probabilities of birds for 3-minute, 5-minute, and 10-minute double-observer point counts conducted at Camp Dawson Collective Training Area, Kingwood, West Virginia, during 2000 and 2001. Detection probabilities and abundances were averaged across all species within a particular point count duration11. Habitat Developed Forest edge Forest interior Riparian edge Riparian interior Reclaimed mine
3-minute x SE 1.000A 0.988A 1.000A 0.995A 0.999A 0.994A
0.000 0.008 0.000 0.000 0.000 0.002
5-minute x SE 0.992A 0.988A 0.991B 0.992AB 0.998B 0.993AB
0.001 0.005 0.001 0.004 0.000 0.000
10-minute x SE 0.978A 0.962A 0.972B 0.988B 0.996C 0.970B
F
0.008 1.70 0.015 0.89 0.003 15.10 0.004 5.00 0.000 9.99 0.003 5.64
df
P-value
2,82 2,200 2,114 2,186 2,69 2,152
0.189 0.413 0.0001 0.008 0.0001 0.004
a. Means with différent letters are significant (P > 0.05) using Tukey's Studentized range test. An interaction occurred between habitat type and count duration therefore mean detection probabilities are presented for each habitat type.
10-minute point counts. Abundances were greater for 10-minute point counts than for either 3- or 5-minute counts, which were the same (F = 11.61, df = 2, 803, P = 0.001).
Discussion Other studies have examined how bird detection rates vary among different point plot sizes (Thompson and Schwalbach 1995) and durations (Buskirk and McDonald 1995, Dawson et al. 1995) based on single-observer point counts. However, detection rates in these studies do not convey the same information as those derived from the double-observer method. Detection probabilities discussed in previous studies represent the number of birds detected at a point (Thompson and Schwalbach 1995), number of points where the species is detected divided by number of points surveyed (Buskirk and McDonald 1995), or the probability of detecting a species given that the species is present at a point (Dawson et al. 1995). Use of the doubleobserver approach (Nichols et al. 2000) allows investigators to compare species-specific detection probabilities of individual birds among different point plot sizes and durations. Point plot size and bird detection probabilities likely have an inverse relationship because birds become more difficult to detect as the observer to bird distance increases. Influences such as weather, vegetative structure, saturation effects, and differences in observer hearing acuity become more pronounced when point plot size increases (Petit et al. 1995). Birds become increasingly difficult to detect when vegetation obstructs observers' views and causes increased sound attenuation and reverberation (Richards 1981). Saturation effects are more pronounced because larger plot sizes inherently have more individual birds, and therefore are more easily overlooked by observers (Petit et al. 1995). Differences in observer abilities also are exacerbated when investigators are required to detect birds at long ranges (Petit et al. 1995).
2002 Proc. Annu. Conf. SEAFWA
Avian Detection Probabilities 337 Although large plot sizes may decrease the probability of detecting individual birds, our results also show that number of bird detections increases, which is likely because more area is being surveyed. Other studies (Savard and Hooper 1995, Thompson and Schwalbach 1995, Thompson et al. 2002) also have shown that number of bird detections is positively correlated with increasing point plot size. This is not surprising as many bird species can be recorded at distances of 150 m or more (Wolf et al. 1995). Unlimited radius point counts using a single observer produces greater numbers of bird detections compared tofixedradius counts (Lynch 1995) and have greater statistical power than point counts done on smaller plot sizes (Thompson and Schwalbach 1995). In addition, using larger plot sizes increases the probability of detecting larger vocal birds that are rarely observed close to the point center (Lynch 1995). Larger plot sizes also reduce number of visits to each point necessary to record the majority of species present because more area is being surveyed for birds (Petit et al. 1995). However, because detection probabilities decline with increasing distance, density estimates derived from unlimited radius point count data likely underestimate true bird density (Savard and Hooper 1995) and are not practical to use when this is of main interest to investigators. Biases introduced when using large plot sizes limit their applicability to certain types of studies. Based on our results, unlimited radius counts are most practical when investigators are interested in bird species richness because a greater number of detections occur with this approach. Smaller,fixedradius counts (i.e., 50 m, 100 m) may be more suited for relating bird abundance to point habitat characteristics because data is collected within close proximity to the point center (Thompson and Schwalbach 1995). Fixed radius counts also are more appropriate for estimating bird density because detections are likely to be more uniform within each plot (Savard and Hooper 1995) and because chances of double counting individuals between points is minimized (Ralph et al. 1993). Point-count duration also affects bird detection probabilities and abundance estimates. Detection probabilities are likely inversely related to point count length because most observations occur within thefirst3 minutes of a point count. As count duration increases there are fewer additional birds to record beyond what was recorded at the beginning of the count. Lynch (1995) found the rate of detections was 3 times higher in thefirst5 minutes than in the last 5 minutes during 15-minute point counts. Observers may also be looking and listening for birds more intently during this time which also would explain why shorter point count durations result in greater detection probabilities. Differences in detection probabilities among different point count durations were not found in developed and forest edge habitats. These habitats require observers to survey more are because they are less vegetated and more open relative to other cover types. More time may be needed to count all individuals present, and therefore observer activity does not decline after thefirstfew minutes of the point count. In addition, there were only 3 point locations within developed habitat which is not likely to be enough to detect any differences that may have been present. Other studies that have examined the relationship between probabilities and point count duration found that longer point counts increase the probability of de2002 Proc. Annu. Conf. SEAFWA
338 Forcey and Anderson tecting a species (Buskirk and McDonald 1995, Dawson et al. 1995). While these results seem to contradict what we have presented, our results are not completely comparable. Buskirk and McDonald (1995) and Dawson et al. (1995) define a detection probability as the probability of detecting a species at a point given that the species is present. A species-specific detection probability derivedfromthe combined doubleobserver technique is defined as the probability of an individual bird of a particular species being detected by at least 1 of 2 observers (Nichols et al. 2000). The focus of 1 definition on species and the other on individuals likely explains the different results among studies. The positive relationship between point count duration and increasing abundance estimates is because more birds can be detected in a longer point count relative to shorter counts (Savard and Hooper 1995, Thompson et al. 2002). Longer point counts allow observers more time to detect birds which is especially important if species richness and abundance is high. Observers also have more opportunity to record species that vocalize infrequently (Buskirk and McDonald 1995) as well as rare species. Longer counts reduce observer bias because investigators have more time to record individual birds and ensures data are accurate. Although longer point counts have advantages, counts exceeding 10 minutes are generally not recommended because of decreased observer counting efficiency (Smith et al. 1998), an increased chance of double counting individuals (Barker et al. 1993), and because the number of species detected is not significantly greater after 10 minutes (Buskirk and McDonald 1995). Long point counts (>10 minutes) also reduce numbers of points that can be surveyed in a day and therefore reduces sample size. This reduction in sample size is accompanied by an increase in standard error and diminished statistical power of point-count data (Smith et al. 1998). Detection probabilities for most bird species ranged between 0.97 and 0.99 among different plot sizes and durations; however, a few species have detection rates that are noticeably outside this range (Forcey 2002). Species such as the downy woodpecker, acadianflycatcher,white-breasted nuthatch, and rose-breasted grosbeak have a detection probability of 1.0 across all plot sizes. The yellow-breasted chat, red-winged blackbird, and house sparrow have a detection probability of 1.0 across all point count durations, while the American robin has a lower mean detection probability (between 0.76 and 0.90) across all plot sizes and point-count durations. Most species with extremely high detection probabilities across different point plot sizes and durations are vocal and conspicuous. The prominence of these species likely reduces effects of increased sound attenuation (Waide and Narins 1988) and observer variability (Cyr 1981, Ramsey and Scott 1981) that are more pronounced with larger plot sizes (Thompson and Schwalbach 1995). Additionally, vocal species are more likely to be detected than inconspicuous species when conducting short point counts because there is a greater chance of the species vocalizing during the point count (Buskirk and McDonald 1995). Although American robins are usually conspicuous and vocal, their low detection probability among plot sizes and point count durations suggests they were overlooked by observers. This is likely due to the
2002 Proc. Annu. Conf. SEAFWA
Avian Detection Probabilities 339 saturation effect where observers have difficulty distinguishing and recording all individuals because of their high numbers (Verner 1985, Petit et al. 1995). Although significant differences were found among different plot sizes and count durations, actual numerical differences were quite small. For example, in some cases detection probability differences of 0.01 were found to be statistically significant. These small differences being statistically significant raises the concern of the biological meaning of the results. Small differences in detection probability likely do not affect results with any biological significance. However, statistically different abundance differences among plot sizes and count durations are of a much higher magnitude (differences of 5 to 7 birds were noted). Differences of this magnitude are likely biologically significant. Differences of 5 to 7 birds could affect survey data especially when project objectives involve density estimates or species counts. Based on our results, several recommendations can be made regarding point plot size and count duration as it relates to bird detection probabilities and abundance estimates. Because many bird species can be detected well beyond the typical 100-m cutoff forfixedradius counts, we suggest using unlimited radius counts when project goals are to inventory bird species composition and abundance. Unlimited radius counts produce the greatest number of detections and are useful for recording rare species, which is often of interest to investigators. Some species of birds including the alderflycatcher(Empidonax virescens) and yellow-throated warbler (Dendroica dominica) would not have been recorded during this study if investigators had used fixed radius point counts. Although unlimited radius counts are not suitable for density estimation and are more susceptible to observer variability, distance estimation differences between observers is likely to be equally problematic when doing fixed radius counts (Thompson and Schwalbach 1995). Unlimited radius point counts are also subject to double-counting the same individual at multiple points because many bird species can be heard at distances of 200-300 m (Wolf et al. 1995). If bird species richness is the primary concern, then unlimited radius counts will likely be most effective for detecting the maximum number of individuals and species. Fixed radius counts are more appropriate for bird density estimation and when relating vegetation characteristics to the avifauna that are present. Point count durations of 10 minutes appear to detect more species and individuals. Although detection probabilities declined, total number of individuals recorded was greater because more time was spent conducting the count (Buskirk and McDonald 1995). Shorter count durations will increase sample size, but this advantage is offset by the shorter amount of time observers spend conducting counts and the greater amount of time spent traveling between points. Shorter point counts also increase the chance of overlooking the uncommon species (Buskirk and McDonald 1995) which is undesirable when attempting to determine speciesrichnessor when rare species are of interest. Bird species such as the wood duck (Aix sponsa) and mourning warbler (Oporornis Philadelphia) would not have been detected during this study if investigators had used point count durations ^5 minutes. The appropriate count duration to use depends on the goal of the study. Shorter counts are more
2002 Proc. Annu. Conf. SEAFWA
340 Forcey and Anderson practical when the study area is large and greater area needs to be covered. Longer point counts permit more species and individuals to be detected, and are more practical to use when evaluating bird species composition and abundance. The use of the double-observer approach for point counts will likely increase overall detectability of all species compared to single-observer counts. Although; 87% of our observations were recorded by the first observer; 13% of our observations can be attributed to having a second observer. Consequently the double-observer approach may be particularly important if raw abundances and densities are of interest because abundances derived from double-observer point counts are likely to be more accurate than those obtained from single-observer data (Nichols et al. 2000). Additional birds detected by the second observer suggest that it may also be a more effective survey technique than the removal model proposed by Farnsworth et al. (2002). However despite advantages to the double-observer approach, it may be more practical to have 2 observers conducting point counts as single-observers when surveying large study areas to increase coverage and consequently obtain higher species richness and abundance data (Smith et al. 1995). Plot size, count duration, and observer effort all influence the quantity and quality of field data that can be collected for a study. Even if a land manager or researcher decides not to use the double-observer approach, it could be used in a pilot study to indicate the effectiveness of a single observer so biases and error rates can be determined. However, project objectives will ultimately dictate how point count studies are designed with respect to plot size, count duration, and observer sampling.
Literature and Cited Barker, R.J., J.R. Sauer, and WA. Link. 1993. Optimal allocation of point count sampling effort. Auk 110:752-758. Bart, J. 1985. Causes of recording errors in singing bird surveys. Wilson Bull. 97:156-181. and J.D. Schoultz. 1984. Reliability of singing bird surveys: changes in observer efficiency with avian density. Auk 101:307-318. Burnham, K.P. and D.R. Anderson. 1998. Model selection and inference: A practical information theoretic approach. Acad. Press, New York, N. Y. 496pp. Buskirk, WH. and J.L. McDonald. 1995. Comparison of point count sampling regimes for monitoring forest birds. Pages 25-34 in C.J. Ralph, J.R. Sauer, and S. Droege, eds. Monitoring bird populations by point counts. U.S. Dep. Agrie. For. Serv. Gen. Tech. Rep. PSW-GTR-149. Cody, R.P. and J.K. Smith. 1997. Applied statistics and the SAS programming language, fourth ed. Prentice Hall, Upper Saddle River, N.J. 445pp. Conover, W.J. and R.L. Iman. 1981. Rank transformations as a bridge between parametric and nonparametirc statistics. Am. Stat. 35:124-133. Cook, R.D. and J.O. Jacobson. 1979. A design for estimating visibility bias in aerial surveys. Biometrics 35:735-742. Cyr, A. 1981. Limitation and variability in hearing acuity in censusing birds. Pages 327-333 in C.J. Ralph and J.M. Scott, eds. Estimating number of terrestrial birds. Stud. Avian Biol. 6. Allen Press, Inc., Lawrence, Kan. Dawson, D.K., D.R. Smith, and CS. Robbins. 1995. Point count length and detection of forest 2002 Prac. Annu. Conf. SEAFWA
Avian Detection Probabilities
341
neotropical migrant birds. Pages 35�39 in C.J. Ralph, J.R. Sauer, and S. Droege, eds. Monitoring bird populations by point counts. U.S. Dep. Agrie. For. Serv. Gen. Tech. Rep. PSW�GTR�149. Dettmers, R., D.A. Buehler, J.G. Bartlett, and N.A. Klaus. 1999. Influence of point count length and repeated visits on habitat model performance. J. Wildl. Manage. 63:815�823. Farnsworth, G.L., K.H. Pollock, J.D. Nichols, T.R. Simmons, J.E. Hines, and J.R. Sauer. 2002. A removal model for estimating detection probabilities from point count surveys. Auk 119:414�425. Forcey, G.M. 2002. An evaluation of double�observer point count techniques and avian habitat use on the Camp Dawson Collective Training Area, Preston County, West Virginia. M.S. Thesis, W. Va. Univ., Morgantown. 157pp. Hamel, P.B., WP. Smith, D.J. Twedt, J.R. Woehr, E. Morris, R.B. Hamilton, and R.J. Cooper. 1996. A land manger's guide to point counts of birds in the Southeast. U.S. Dep. Agrie. For. Serv. Gen. Tech. Rep. SO�120.19pp. Lynch, J.F. 1995. Effects of point count duration,time�of�day,and aural stimuli on detectabil� ity of migratory and resident bird species in Quintana Roo, Mexico. Pages 1�6 in C.J. Ralph, J.R. Sauer, and S. Droege, eds. Monitoring bird populations by point counts. U.S. Dep. Agrie. For. Serv. Gen. Tech. Rep. PSW�GTR�149. Mayfield, H.F. 1981. Problems in estimating population size through counts of singing males. Pages 220�224 in C.J. Ralph and J.M. Scott, eds. Estimating number of terrestrial birds. Stud. Avian Biol. 6. Allen Press, Inc., Lawrence, Kan. Nichols, J.D., J.E. Hines, J.R. Sauer, F.W. Fallon, RE. Fallon, and P.J. Heglund. 2000. A double�observer approach for estimating detection probability and abundance from point counts. Auk 117:393^408. Petit, D.R., L.J. Petit, V.A. Saab, and Т.Е. Martin. 1995. Fixed�radius point counts in forests: factors influencing effectiveness and efficiency. Pages 49�56 in C.J. Ralph, J.R. Sauer, and S. Droege, eds. Monitoring bird populations by point counts. U.S. Dep. Agrie. For. Serv. Gen. Tech. Rep. PSW�GTR�149. Ralph, C.J., G.R. Geupel, P. Pyle, Т.Е. Martin, and D.F. Desante. 1993. Handbook of field methods for monitoring landbirds. U.S. Dep. Agrie. For. Serv. Gen. Tech. Rep. PSW� GTR�144.181pp. Ramsey, F.L. and J.M. Scott. 1981. Tests of hearing ability. Pages 341�345 in C.J. Ralph and J.M. Scott, eds. Estimating number of terrestrial birds. Stud. Avian Biol. 6. Allen press, Inc., Lawrence, Kan. Richards, D.G. 1981. Environmental acoustics and censuses of singing birds. Pages 297�300 in C.J. Ralph and J.M. Scott, eds. Estimating number of terrestrial birds. Stud. Avian Biol. 6. Allen Press, Inc., Lawrence, Kan. Robbins, CS. 1981a. Bird activity levels related to weather. Pages 301�310 in C.J. Ralph and J.M. Scott, eds. Estimating numbers of terrestrial birds. Stud. Avian Biol. 6. Allen Press, Inc., Lawrence, Kan. . 1981e. Effect of time of day on bird activity. Pages 275�286 in C.J. Ralph and J.M. Scott, editors. Estimating number of terrestrial birds. Stud. Avian Biol. 6. Allen Press, Inc., Lawrence, Kan. SAS Institute, Inc. 1988. SAS/STAT user's guide. Ed. 6.03. SAS Inst., Inc. Cary, N.C. 1028pp. Savard, J.L. and T.D. Hooper. 1995. Influence of survey length and radius size on grassland bird surveys by point counts at Williams Lake, British Columbia. Pages 57�62 in C.J. Ralph, J.R. Sauer, and S. Droege, eds. Monitoring bird populations by point counts. U.S. Dep. Agrie. For. Serv. Gen. Tech. Rep. PSW�GTR�149.
2002 Proc. Annu. Conf. SEAFWA
342 Forcey and Anderson Skirvin, A.A. 1981. Effect of time of day and time of season on the number of observations and density estimates of breeding birds. Pages 271�274 in C.J. Ralph and J.M. Scott, eds. Estimating number of terrestrial birds. Stud. Avian Biol. 6. Allen Press, Inc., Lawrence, Kan. Smith, WP., D J . Twedt, R.J. Cooper, D.A. Wiedenfeld, P.B. Hamel, and R.P. Ford. 1995. Sample size and allocation of effort in point count sampling of birds in bottomland hardwood forests. Pages 7�17 in C.J. Ralph, J.R. Sauer, and S. Droege, eds. Monitoring bird populations by point counts. U.S. Dep. Agrie. For. Serv. Gen. Tech. Rep. PSW�GTR�149. —, , RB. Hamel, R R Ford, D.A. Wiedenfeld, and R.J. Cooper. 1998. Increasing point count duration increases standard error. J. Field Ornithol. 69:450�456. Thompson, F.R., ІП and M.J. Schwalbach. 1995. Analysis of sample size, counting time, and plot size from an avian point count survey on Hoosier National Forest, Indiana. Pages 45�48 in C.J. Ralph, J.R. Sauer, and S. Droege, eds. Monitoring bird populations by point counts. U.S. Dep. Agrie. For. Serv. Gen. Tech. Rep. PSW�GTR�149. , D.E. Burhans, and B. Root. 2002. Effects of point count protocol on bird abundance and variability estimates and power to detect population trends. J. Field Ornithol. 73:141�150. Thompson, WL. 2002. Towards reliable bird surveys: accounting for individuals present but not detected. Auk 119:18�25. Verner, J. 1985. Assessment of count methods. Current Ornithol. 2:247�302. Waide, R.B. and P.M. Narins. 1988. Tropical bird counts and the effect of sound attenuation. Auk 105:296�302. White, G.C. 1983. Numerical estimation of survival rates from band�recovery and bioteleme� try data. J. Wildl. Manage. 47:716�728. Wolf, A.T., R.W. Howe, and G.J. Davis. 1995. Detectability of forest birds from stationary points in northern Wisconsin. Pages 19�23 in C.J. Ralph, J.R. Sauer, and S. Droege, eds. Monitoring bird populations by point counts. U.S. Dep. Agrie. For. Serv. Gen. Tech. Rep. PSW�GTR�149. Yahner, R.H. 1995. Eastern deciduous forest: ecology and wildlife conservation. Univ. Minn. Press, Minneapolis, Minn. 192pp.
2002 Proc. Annu. Conf. SEAFWA