Journal of Strength and Conditioning Research, 2004, 18(3), 641–645 q 2004 National Strength & Conditioning Association
VARIATION IN HEART RATE DURING SUBMAXIMAL EXERCISE: IMPLICATIONS FOR MONITORING TRAINING ROBERT P. LAMBERTS,1,2 KOEN A.P.M. LEMMINK,2 JUSTIN J. DURANDT,3 MICHAEL I. LAMBERT1
AND
MRC/UCT Research Unit for Exercise Science and Sports Medicine, Department of Human Biology, Faculty of Health Sciences, University of Cape Town, Sport Science Institute of South Africa, Newlands, South Africa; 2 Institute for Human Movement Science, University of Groningen, Groningen, The Netherlands; 3Discovery Health High Performance Centre, Sport Science Institute of South Africa, Newlands, South Africa. 1
ABSTRACT. Lamberts, R.P., K.A.P.M. Lemmink, J.J. Durandt, and M.I. Lambert. Variation in heart rate during submaximal exercise: implications for monitoring training. J. Strength Cond. Res. 18(3):641–645. 2004.—A change in heart rate at a controlled submaximal exercise intensity is used as a marker of training status. However, the standard error of measurement has not been studied systematically, and therefore a change in heart rate, which can be considered relevant, has not been determined. Forty-four subjects (26.5 6 5.4 years; mean 6 standard deviation) participated in a submaximal running test at the same time of day for 5 consecutive days. Heart rates were determined during each of the 4 exercise intensities (2 minutes each) of increasing intensity and during the 1-minute recovery period after each stage. The repeatability of the heart rate on a day-to-day basis during the stages and recovery periods were high (intraclass correlation coefficient: 95% confidence interval R 5 0.94– 0.99). The lowest variation in heart rate occurred in the fourth stage (ø90% maximum heart rate) with heart rate varying 5 6 2 b·min21 (95% confidence interval for coefficient of variation 5 1.1–1.4%). In conclusion, the standard error of measurement of submaximal heart rate is 1.1–1.4%. This magnitude of measurement error needs to be considered when heart rate is used as a marker of training status.
heart rate–exercise intensity relationship (11). Given that all these factors are adequately controlled, it can be assumed that heart rate at a controlled exercise intensity remains fairly constant from test to test. The exact variation in submaximal heart rate based on different research studies (2, 4, 11) appears to be between 3 and 6 b·min21. However, these data were generated from studies that did not have the determination of the day-to-day variation of submaximal heart rate as the primary goal. All the factors that could have influenced heart rate in these studies were not adequately controlled. Therefore, the precision of these data is questionable. The aim of this study therefore was to determine the day-to-day variation of heart rate in a group of subjects who ran in a controlled submaximal shuttle test of increasing exercise intensity when their state of training remained constant. The overall goal was to quantify the variation of heart rate on a day-to-day basis so that changes in heart rate at a fixed submaximal exercise intensity, under controlled conditions, can be interpreted correctly.
KEY WORDS. heart rate variation, field test, heart rate monitors, monitoring performance, training status
METHODS Experimental Approach to the Problem
INTRODUCTION uring bouts of short-duration, steady-state exercise, there is a linear relationship between heart rate, exercise intensity, and oxygen consumption (2). Based on this relationship, the measurement of heart rate provides a reasonable estimation of exercise intensity (8). From a practical perspective, heart rate monitors have evolved to measure and store heart rate data for subsequent analysis (12), allowing for the practical measurement of heart rate under free-living conditions and the estimation of exercise intensity (16, 18). Assuming that heart rate at a fixed submaximal exercise intensity decreases as aerobic fitness improves (21), an elevated heart rate at a fixed submaximal exercise intensity could indicate a state of overtraining or a lack of conditioning (7, 9, 10). In practical terms this means that monitoring changes in the heart rate–exercise intensity relationship can provide information about the state of training of an athlete (5, 11). However, the relationship between heart rate and exercise intensity can be influenced by various factors. For example, factors such as the mode of exercise, training status, exercise duration, environmental conditions, competition, and time of day can all have an effect on the
D
Fifty-seven subjects were recruited to participate in this study. All the recruited participants had to be physically active on a regular basis (minimum of 2 days per week), nonsmokers, and free of all cardiovascular risk factors (1). Before the testing period, all participants completed a medical screening questionnaire and signed a form of informed consent. The study was approved by the Ethics and Research Committee of the Faculty of Health Sciences of the University of Cape Town. All subjects were familiar with exercising in the facility in which the testing was conducted, and therefore any increase in heart rate as a result of psychological arousal was considered negligible. The subjects underwent a submaximal shuttle test of increasing intensity on 5 consecutive days. An attempt was made to conduct the testing at the same time each day to avoid any circadian changes in heart rate (17). Heart rate was measured throughout the test and for 2 minutes after the cessation of the test. All participants were asked to maintain their own training habits and keep these constant in the week before the study and during the week of testing. They were also asked to keep regular sleeping habits, avoid caffeine 2 hours prior to testing, and wear the same shoes in the test each day. 641
642
LAMBERTS, LEMMINK, DURANDT
ET AL.
On the first day the subjects’ body mass, stature, body composition (6), sum of 7 skinfolds (triceps, biceps, subscapular, suprailiac, abdominal, thigh, and calf, as described by Ross and Marfell-Jones [19]) were measured. During the 5 days of testing, the body mass of the subjects and the ambient temperature and humidity were measured before each test. Submaximal Test
After a standardized stretching warm-up, all participants were fitted with a chest heart rate transmitter and wrist monitor recorder (Polar Accurex, Polar Electro, Kempele, Finland) before the start of the test. The heart rate monitor measured the heart rate every 5 seconds during the test. The test was a submaximal shuttle test of increasing intensity interspersed with recovery periods. The subjects were asked to run between 2 lines, drawn 20 m apart on a rubberized indoor floor. The pace of running within each of the 4 stages (8.4, 9.6, 10.8, and 12.0 km·h21, respectively) was set by a prerecorded auditory signal recorded onto a compact disc player. Each stage lasted 2 minutes followed by 1 minute of resting. The subjects rested for 2 minutes after the fourth stage. Therefore, the total duration of the test was 13 minutes. This test was designed to be submaximal and nonaversive for the subjects so that from a practical perspective the test could be administered frequently during different phases of training. In an attempt to control factors that influence heart rate, the participants stood passively in an upright position during the resting period, and stretching and talking were not allowed during this period. At the end of each test, all participants completed a questionnaire. In this questionnaire the subjects were asked about their general perception of fatigue during normal daily activities and whether they perceived any muscle soreness in their lower extremities. If they answered ‘‘yes’’ for either of the questions, they were then asked to rate their perception on a continuous scale ranging from 0 to 10, where 0 5 ‘‘nothing at all’’ and 10 5 ‘‘maximal pain.’’ Heart rate was recorded throughout the test at 5-second intervals and transferred to a computer using an interface (Polar Electro). The heart rate for each exercise intensity was recorded for the final 15 seconds of each stage. This was done to allow the heart to reach a representative heart rate for each stage. The heart rate for each recovery period was determined in the same way. During the recovery period after the fourth stage, the heart rate was recorded at 1 and 2 minutes, respectively. These heart rates were expressed as a percentage of the heart rate measured during the fourth stage and defined as recovery percentage (%) first minute and recovery percentage (%) second minute, respectively. Statistical Analyses
¯ All data are expressed as means 6 standard deviation (X ¯ 3 6 s). The coefficient of variation was calculated as s/X 100. A 95% confidence interval (CI) was determined for the heart rate of each subject for each exercise intensity and recovery period. A 2-way analysis of variance for repeated measures (subject 3 heart rate) was used to determine the differences in heart rate during the test over the 5 days. Sphericity of the data was tested using the Mauchley test (22). When the sphericity condition was violated, a Greenhouse-Geisser adjustment was made to
Table 1. General descriptive characteristics of the subjects (n 5 44). ¯ 6s Variable X Age (y) Body Mass (kg) Stature (m) Fat (%) ? Fat (%) / Sum of 7 Skinfolds (mm) ? Sum of 7 Skinfolds (mm) / Self-Reported Physical Activity (min·wk21)
26.5 70.3 1.74 14 24 64.8 85.8 234
6 6 6 6 6 6 6 6
5.4 10.2 0.08 3 3 19.7 19.2 113
the degrees of freedom to counter the increased risk of a type I error. Differences between the first and the second minute after the test were determined using a paired ttest. Intraclass correlation coefficients (ICCs) for the heart rate for each exercise intensity and recovery period over the 5 testing days were determined. The percentages of heart rate recovery and the perception of general fatigue and the muscle soreness were also analyzed with an ICC. The 95% confidence intervals were determined for each ICC (14). Relationships between parametric variables (changes in body mass and heart rate) were determined by calculating the Pearson product moment correlation coefficient, and relationships between nonparametric variables (general fatigue and muscle fatigue scores vs. heart rate) were determined by calculating the Spearman correlation coefficient. Statistical significance was accepted when p # 0.05.
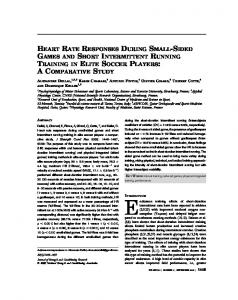
RESULTS Fifty-seven subjects were recruited for the study. Seven subjects withdrew from the study because of minor illnesses, as this may have affected their heart rate during exercise. In addition, 2 subjects were not able to complete 5 consecutive testing days; 2 subjects withdrew because the intensity of the test was too high, and 2 subjects, who were not accustomed to running, were asked to stop the trial because of symptoms of the recurrence of old knee injuries. The data of these 13 subjects who were not able to complete this study are not included in the analysis. The general characteristics of the remaining 44 participants (men n 5 26 and women n 5 18) are shown in Table 1. All subjects were tested on 5 consecutive days, except for 11 subjects who were tested over 6 days. All the tests were done at a similar time during the day (a range of 7– 60 minutes apart and mean time of 38 6 18 minutes apart). The mean temperature during the whole testing period was 23 6 18C with a relative humidity of 55 6 1%. All subjects did not drink coffee 2 hours prior to the test except for 1 subject who drank coffee 1 hour before testing on 1 occasion. The data for this trial were analyzed separately and were indistinguishable from the other 4 trials. Therefore, these data were included in the main analysis. There were no differences in the heart rate responses between the men and women, so the data were analyzed as 1 group. The change in body mass of all subjects during the 5 tests stayed within a range of 0.3–2.4 kg (0.9 6 0.4 kg). The mean heart rate for each of stage of the testing on the 5 days is shown in Figure 1a. The mean heart rate during recovery after each stage is shown in Figure 1b. The representative heart rate during each of the four
DAY-TO-DAY VARIATION IN HEART RATE 643 Table 3. Average 95% confidence interval and the minimum and maximum range of the heart rate (b·min21) for all subjects (n 5 44).
Stage 1 Recovery 1 Stage 2 Recovery 2 Stage 3 Recovery 3 Stage 4 Recovery 4 (first minute) Recovery 4 (second minute)
Figure 1. (a) Mean heart rate of the subjects (n 5 44) over each of the 4 stages during each of the 5 testing days and (b) ¯ 6 s). The first during the recovery periods after each stage (X bar in each stage represents the first testing day, the second bar the second testing day, the third bar the third testing day, and so on. Recov 5 recovery. Table 2. Mean heart rate (b·min21) and intraindividual coefficient of variation (%) and the 95% confidence intervals for the heart rates and coefficient of variation for each stage during the test (n 5 44). 95% Confidence Interval Heart Rate for Heart Rates (b·min21) Stage 1 Recovery 1 Stage 2 Recovery 2 Stage 3 Recovery 3 Stage 4 Recovery 4 (first minute) Recovery 4 (second minute)
6 6 6 6 6 6 6
Coefficient of Variation (%)
95% Confidence Interval for Coefficient of Variation
3 7 3 7 3 6 2
132–141 78–88 146–155 92–105 159–168 106–119 171–179
2.3 8.1 2.1 7.1 1.7 5.9 1.3
2.0–2.6 7.2–9.0 1.9–2.3 5.9–7.6 1.5–1.9 4.9–6.8 1.1–1.4
127 6 3
121–133
2.4
2.1–2.7
103 6 6
97–108
6.1
6.7–8.4
137 83 151 98 164 113 176
stages increased during the test (137 6 3, 151 6 3, 164 6 3, and 176 6 2 b·min21) (Figure 1a and Table 2; p , 0.01). Heart rate in the minute of recovery after each stage also increased 83 6 7, 98 6 7, 113 6 6, and 127 6 3 b·min21 (p , 0.01). During the second minute after the
Average Range for Heart Rate (b·min21)
Minimum and Maximum Range for Heart Rate (b·min21)
95% Confidence Interval (b·min21)
863 16 6 6 763 16 6 7 763 15 6 6 562
2–12 4–31 3–12 5–33 2–12 4–27 1–9
7–8 14–18 7–8 14–19 6–7 13–17 5–6
863
3–15
7–8
15 6 7
6–26
13–17
fourth stage, the heart rate decreased to 103 6 6 b·min21 (Figure 1b and Table 2). Data are also summarized in Table 2 with the coefficient of variation and 95% confidence intervals for the coefficient of variation and heart rate for each stage. The lowest 95% confidence interval for the coefficient of variation occurred during the fourth stage (1.1–1.4%). The highest coefficient of variation for heart rate occurred during the first recovery period (7.2– 9.0%). The coefficient of variation in the first minute after the fourth period was significantly lower than the coefficient of variation in the second minute (p , 0.05). The average range in heart rate for all the subjects over the 5 tests are shown in Table 3. The lowest 95% confidence interval for heart rate was from 5 to 6 b·min 21 for the fourth stage. The highest 95% confidence interval was from 14 to 19 b·min21 for the recovery period after the second stage. The lowest variation in heart rate (1 b·min21) occurred in the fourth stage, where in 1 subject the range of heart rate over the study was 186–187 b·min21. The highest variation (33 b·min21) occurred in a subject after the second recovery period. In this subject, heart rate varied from 68 to 101 b·min21 during the 5 days of testing. After examining the questionnaire and the subject’s personal daily training logbook, it became clear that the subject had done a high-intensity cycle training session on the day before the highest variation in the heart rate. The highest variation in body mass of all subjects (2.4 kg) over the 5 testing days was also found the day after this training session in the same subject. However, after consultation it was decided that this subject should not be excluded from the study for violating the request for relatively constant training because he did not indicate any form of general fatigue (score of 0) or muscle soreness (score of 0). His heart rate data were constant on the other 4 days of testing. The calculated percentage of heart rate recovery after the fourth stage was 28 6 1% for the first minute and 42 6 3% for the second minute. The coefficient of variation was significantly higher for the second minute of recovery (7.2 6 3.0%) compared to the first minute of recovery (5.2 6 2.0%) (p , 0.0003). The average range in the percentage of recovery was 3 6 1% for the first minute and 7 6 4% for the second minute. The ICCs for the heart rate measured during each stage and recovery period and the 95% confidence intervals for these correlation coefficients are shown in Table
644
LAMBERTS, LEMMINK, DURANDT
ET AL.
Table 4. Intraclass correlation of heart rate and the calculated percentages of recovery in the different stages in the test (n 5 4 and 5 testing days).
Stage 1 Recovery 1 Stage 2 Recovery 2 Stage 3 Recovery 3 Stage 4 Recovery 4 (first minute) Recovery 4 (second minute) % Recovery (first minute) % Recovery (second minute)
Intraclass Correlation (R)
95% Confidence Interval
0.99 0.97 0.99 0.97 0.99 0.98 0.99 0.99 0.97 0.99 0.96
0.98–0.99 0.95–0.98 0.98–0.99 0.95–0.98 0.98–0.99 0.97–0.98 0.98–0.99 0.98–0.99 0.95–0.98 0.98–0.99 0.94–0.98
Figure 2. Group data (n5 44) for the perceived state of general fatigue and muscle soreness in the lower extremity ¯ 6 s). measured over 5 testing days (X
4. The average ratings for the perceived state of general fatigue and muscle soreness did not change over the 5 days of testing (Figure 2). The highest score on this perceived rating scale (0–10) was only moderate to severe (6). Seventy-seven percent of the subjects who rated a score of 6 (n 5 10) rated it on the first day of testing. Three subjects rated ‘‘moderate to severe’’ on the second day. Two of these subjects rated a score of 6 on the general fatigue scale after they did not sleep well, and 1 subject rated a score of 6 on muscle soreness scale after a hard session of squash the night before the test. The ICC for the perceived rate of general fatigue and muscle soreness were R 5 0.71 and R 5 0.80, respectively. There were no significant relationships between variation in the general fatigue/muscle soreness scores and changes in heart rate at any of the exercise intensities. There was a weak relationship between changes in body mass and changes in heart rate during the first, second, third, and 2 minutes of recovery after the fourth stage (r 5 0.32, 0.30, 0.33, and 0.34, respectively) (p 5 0.05 for each stage).
DISCUSSION This is the first study to have focused specifically on the reliability of submaximal heart rate during a test where the exercise intensity was monitored carefully and the
factors that affected the heart rate–exercise intensity relationship were controlled. The study was designed in an attempt to quantify the variation of heart rate under controlled conditions so that training-induced changes in submaximal heart rate can be interpreted more precisely. The main finding of the study was that heart rate measured during the increasing exercise intensities were reliable (R 5 0.99) (20) and that at the highest exercise intensity in the test (approximately 90% of maximum heart rate), heart rate varied the least (5 6 2 b·min21). The 95% confidence interval for heart rate range at this intensity was 5–6 b·min21. The heart rate varied more during the lower exercise intensities and during the recovery periods (Table 3). The practical application of these data is that the intermittent, submaximal test has sufficient precision to detect significant changes when the heart rate differs by approximately 7 b·min21 during the fourth stage. Working on the assumption that heart rate decreases at a submaximal exercise intensity with increasing aerobic fitness (21), monitoring the submaximal heart rate at regular intervals can be a useful marker of the changes in training status. Furthermore, increases in heart rate at submaximal exercise intensities can be indicative of overtraining (7, 9, 10), dehydration (13), and decreased training status (15). Although it is assumed that the heart rate–exercise intensity relationship reflects training status, further research needs to establish whether changes in heart rate of approximately 7 b·min21 are sufficiently sensitive to track changes in training status. The heart rate recovery after the fourth stage (expressed as a percentage of the heart rate of the fourth stage) was calculated and found to be repeatable (R 5 0.96–0.99 for second and first minute, respectively). Based on the assumption that the heart rate recovers faster when aerobic fitness improves (5), the percentage of heart rate recovery would be higher with increasing fitness. The repeatability of the recovery heart rate implies that athletes can use their percentage of heart rate recovery as an indicator of their aerobic fitness (5). The time of day was regulated to minimize any circadian effect on heart rate (17). During the study all tests were conducted within 38 6 18 minutes, which would have excluded any circadian effect on the variation in heart rate. Furthermore, the subjects in the study were controlled in the context of a field study situation. The reason for this was to make the results applicable to conditions where the athletes are tested regularly in freeliving conditions. It is acknowledged that the subjects exercised on their own during the study, but the subjective scores of general fatigue and muscle fatigue were monitored on a daily basis. On the whole, these scores remained constant throughout the study, confirming that the test conducted on consecutive days did not have any cumulative affect on fatigue (Figure 2). Based on the data from this study, body mass is a factor that needs to be controlled or taken into account when the heart rate data are analyzed. One subject had a body mass change of 2.4 kg during the study. During the test when his body mass was reduced, his heart rate increased by 33 b·min21 during the recovery period. It is important to note that these changes occurred in the absence of any general fatigue or muscle pain. It is reasonable to assume that these changes in heart rate were caused by a reduced plasma volume as a result of dehy-
DAY-TO-DAY VARIATION IN HEART RATE 645
dration resulting from the training the previous day. Indeed, it has been shown that the loss of body mass as a result of exercise is directly proportional to increases in heart rate during exercise (r 5 0.99) (13). In conclusion, the day-to-day variation in the heart rate, when the relative state of training based on perceived muscle soreness and general fatigue does not change, is on average 5–8 b·min21 for all the stages and 7–19 b·min21 for all the recovery periods during the test. When interpreting the data, it should be considered that the main factors that influence the heart rate–exercise intensity relationship were well controlled in the study. Although the subjects exercised on their own between the testing sessions, the perception of general fatigue and muscle soreness remained constant during the study. Future research should examine whether changes in the heart rate–exercise intensity relationship track changes in training status.
PRACTICAL APPLICATIONS Based on the assumption that heart rate decreases at a submaximal exercise intensity with increasing aerobic fitness and increases with overtraining, dehydration, and decreased training status, regular monitoring of changes in the heart rate–exercise intensity relationship can provide information about the state of training of an athlete. This study shows that under controlled conditions during which the training status does not change, submaximal heart rate varied by about 7 b·min21 when the exercise intensity was approximately 90% of maximum heart rate. This variation needs to be considered when changes in submaximal heart rate in an athlete are used as a marker of training status.
REFERENCES 1.
2.
3.
4.
5.
6.
7.
AMERICAN COLLEGE OF SPORTS MEDICINE. Exercise for patients with coronary artery disease. Med. Sci. Sports Exerc. 26:1–5. 1994. ARTS, F.J.P., AND H. KUIPERS. The relation between power output, oxygen uptake and heart rate in male athletes. J. Sports Sci. 9:183–189. 1994. ˚ STRAND, P.O., AND B. SALTIN. Oxygen uptake during the first A minutes of heavy muscular exercise. J. Appl. Physiol. 16:971– 976. 1961. BRISSWALTER, J., AND P. LEGROS. Daily stability in energy cost of running, respiratory parameters and stride rate among well trained middle distance runners. Int. J. Sports Med. 15:238– 241. 1994. DENNIS, S.C., AND T.D. NOAKES. Physiological and metabolic responses to increasing work rate: Relevance for exercise prescription. J. Sports Sci. 16:S77–S84. 1998. DURNIN, J.V.G.A., AND J. WOMERSLEY. Body fat assessed from the total density and its estimation from skinfold thickness: Measurements on 481 men and women aged from 16 to 71 years. Br. J. Nutr. 32:77–97. 1974. HEDELIN, R., G. KENTTA, U. WIKLUND, P. BJERLE, AND K. HEN-
8. 9.
10. 11.
12. 13.
14. 15.
16.
17.
18.
19.
20. 21.
22.
RIKSSON-LARSEN. Short-term overtraining: effects on performance, circulatory responses, and heart rate variability. Med. Sci. Sports Exerc. 32:1480–1482. 2000. HILLS, A.P., N.M. BYRNE, AND A.J. RAMAGE. Submaximal markers of exercise intensity. J. Sports Sci. 16:S71–S76. 1998. JEUKENDRUP, A., AND A. VAN DIEMEN. Heart rate monitoring during training and competition in cyclists. J. Sports Sci. 16: S91–S99. 1998. KUIPERS, H., AND H.A. KEIZER. Overtraining in elite athletes, review and directions for the future. Sports Med. 6:79–92. 1988. LAMBERT M.I., Z.H. MBAMBO, AND A. ST CLAIR GIBSON. Heart rate during training and competition for long distance running. J. Sports Sci. 16:S85–S90. 1998. LAUKKANEN, R.M.T., AND P.K. VIRTANEN. Heart rate monitors: State of art. J. Sports Sci. 16:S3–S7. 1998. MONTAIN, J.S., AND E.F. COYLE. Influence of graded dehydration on hyperthermia and cardiovascular drift during exercise. J. Appl. Physiol. 73:1340–1350. 1992. MORROW, J.R., AND A.W. JACKSON. How ‘‘significant’’ is your reliability? Res. Q. Exerc. Sport. 64:352–355. 1993. MUJIKA, I., AND S. PADILLA. Cardiorespiratory and metabolic characteristics of detraining in humans. Med. Sci. Sports Exerc. 33:413–421. 2001. NOAKES, T.D., M.I. LAMBERT, AND M. GLEESON. Heart rate monitoring and exercise: Challenges for the future. J. Sports Sci. 16:S105–S106. 1998. REILLY, T., G. ROBINSON, AND O.S. MINORS. Some circulatory responses to exercise at different times of day. Med. Sci. 16: 477–482. 1984. RIBEYRE, J., N. FELLMANN, J. VERNET, M. DELAıˆTRE, A. CHAMOUX, J. COUDERT, AND M. VERMOREL. Components and variations in daily energy expenditure of athletic and non-athletic adolescents in free-living conditions. Br. J. Nutr. 84:531–539. 2000. ROSS, W.D., AND M.J. MARFELL-JONES. Kinanthropometry. In: Physiological Testing of the High Performance Athlete. J.D. MacDougall, H.A. Wenger, and H.S. Green, eds. Champaign, IL: Human Kinetics, 1991. pp. 223–308. VINCENT, W.J. Statistics in Kinesiology. Champaign. IL: Human Kinetics, 1995. WILMORE, J.H., P.R. STANFORTH, J. GAGNON, A.S. LAON, D.C. RAO, J.S. SKINNER, AND C. BOUCHARD. Endurance exercise training has a minimal effect on resting heart rate: The HERITAGE Study. Med. Sci. Sports Exerc. 28:829–835. 1996. WINTER, E.M, R.G. ESTON, AND K.L. LAMB. Statistical analyses in the physiology of exercise and kinanthropometry. J. Sports Sci. 19:761–775. 2001.
Acknowledgments This study was funded by the Medical Research Council of South Africa, the Marco Polo research fund of the University of Groningen, and the Groningen University Fund, Groningen, The Netherlands. Polar Electro, Kempele, Finland, donated the heart rate monitors that were used in this study. Further, Dr. Regan Arendse is thanked for his assistance in the assessment of the subjects, and Dr. Chris Visscher is thanked for his advice during the study.
Address correspondence to Dr. Michael Lambert,
[email protected]