STADDON, J. E. R. Inhibition and the operant. Journal of the Experimental. Analysis of Behavior, 1969, 12,481-487. WINER, B. J. Statistical principles in.
dissipated, a comparatively high rate of leverpressing can be expected in the test interval. The results of this experiment can be regarded as showing a disinhibition effect in an operant conditioning situation with a DRL schedule. As such, these results are similar to those previously reported with FI schedules (Ferster & Skinner, 1957; Hinrichs, 1968; Singh & Wickens, 1968), and those obtained by Pavlov (1927) using delayed classical conditioning procedures. REFERENCES BRADY, J. V., & CONRAD, D. G. Some effects of brain stimulation on timing behavior. Journal of tbe Experimental Analysis of Behavior, 1960,3,93-106. BROWN, P. L" & JENKINS, H. M. Conditioned inhibition and excitation in operant discrimination learning. Journal of Experimental Psychology, 1967, 75, 255-266. FERSTER, C. B., & SKINNER, B. F. Schedules o( rein(orcement. New York: Appleton-Gentury-Crofts, 1957. FLANAGAN, B., & WEBB, W. B. Disinhibition and external inhibition in fi x ed interval operant conditioning.
Psychonomic Science, 1964, 1. 123-124. HARTLINE. H. R. Inhibition of activity of visual receptors by illuminating nearby retinal elements in the Limulus eye. Federation Proceedings. 1949.8,69. HINRICHS, J. V. Disinhibition of delay in fixed-interval instrumental conditioning. Psychonomic Science, 1968, 12,313-314, LATIES. V. G., WEISS, B., CLARK, R. L., & REYNOLDS, M. D. Overt "mediating" behavior during temporally spaced responding. Journal of the Experimental Analysis of Behavior, 1965, 8, 107-116. LATIES, V. G., WEISS, B" & WEISS, A. B. Further observations of overt "m e diating" behavior and the discrimination of time. Journal of the Experimental Analysis of Behavior, 1969, 12,43-57. PA VLOV, I. P. Conditioned reflexes (translated by G. V. Anrep). London: Oxford University Press, 1927. SINGH, D., & WICKENS, D. D. Disinhibition in instrumental conditioning. Journal of Comparative & Physiologjcal Psychology, 1968, 66, 557-559. STADDON, J. E. R. Inhibition and the operant. Journal of the Experimental Analysis of Behavior, 1969, 12,481-487. WINER, B. J. Statistical principles in experimental design, New York: McGraw-Hill,1962.
Variation in visual input and the occipitalEEG: 11* ANTHONY GALE, MICHAEL COLES, and ELIZABETH BOYD University of Exeter, Exeter, Devon, England The resting EEG of 29 Ss is examined during exposure to five different conditions of visual stimulation: (1) eyes shut, (2) eyes open in the dark, (3) viewing a blank screen, (4) viewing a simple pattern, and (5) viewing a more complex pattern. Each condition is presented twice according to a randorn schedule (2 min per trial), For alpha and beta frequencies, EEG amplitude varies inversely' with ascending visual complexity. For theta frequencies, this relation holds except for areversal for Conditions 4 and 5. Gale et al (1969) demonstrated that resting EEG varies with eyes closed, eyes open with matt black display, and patterned stimulation. The present study replicates this finding and *This worlt was partially supported by a grant trom the Medical Research Council (Ref. G. 969/185/C).
Psychon. ScL, 1971, Vol. 23 (IB)
extends the number of viewing conditions, Apart from sleep research, where extensive EEG sam pies are taken, psychological studies of the EEG invariably employ discrete EEG measures in conjunction with brief exposure to stimulation. The technique we employ involves relatively long-term time sampling
under conditions of continuous viewing. These findings support the hypothesis that occipital EEG varies inversely with the "arousal" value of visual input. SUBJECTS The Ss were 30 undergraduate first-year students (19 men and 11 women) at the University of Exeter, with an average age of 18 years and 9 months. APPARATUS AND PROCEDURE The S sat in an adjustable hairdresser's chair and looked through a window cut into a black barrier screen, such that his visual field was limited to the view of a test slide projected onto a screen 12 ft awayon the other side of the barrier screen. The S's height was adjusted until his angle of regard was at 90 deg to a center point on the test slide. The area of the projected slide was 30 x 30 in. Apart from the illumination of the projector screen (when this was in use), the S sat in the dark. The E was able to monitor the projected slides through a masked spyhole from the adjoining experimental room. Five conditions of visual stimulation were employed (1) eyes shut, (2) eyes open in the dark, (3) eyes open viewing a blank screen, (4) eyes open viewing a black cirele (10-in. radius) on a white background, and (5) eyes open viewing the circle with eight spokes radiating at 45-deg intervals. There were 10 2-min trials presented in two blocks of the five conditions, random within blocks, with the constraint that no two identical conditions were adjacent. Total experimental time was, therefore, 20 min. Whenever the S was required to open or shut his eyes, the E called the instruction to hirn through the spyhole. On other occasions, either the main supply to the projector was switched on or off or the slide was changed automatically, without comment. Silver-silver/chloride loose pad eledrodes were placed transoccipitally for bipolar recording (Cooper et al, 1969) with the neutral electrode on the left wrist. Interelectrode resistance was always below 6 k ohms. The primary EEG was recorded on a San 'ei polygraph, calibrated to give 24-mm writeout (peak to trough) for 100 microV, time constant 0.3 sec. Continuous writeout of nine separate pure bandpass filters, each integrated for a 5-sec epoch, was ·provided by a San'ei low-frequency analyzer, giving a resolution of 40 x 1 mm intervals. The filters were set at the following frequencies: 2.0-4.5 cps, 4.5-6.5 cps, 6.5-7.5 cps, 7.5-8.5 cps, 8.5-9.5 cps, 9.5-10.5 cps, 10.5-11.5 cps, 11.5-14.5 cps, and 14.5-20.0 cps. These filters were flat-topped and 99
Table 1 Results of Wilcoxon Tests of Comparison Between the Dtiferent Viewing Conditions (1-5) for Each Collapsed Frequency Band, Showing Level of Si&nificance Obtained 1 1 2 3 4 5 1 2 3 4 5 1 2
3
2
3
4
(a) 2.0-6.5 cps .001 .001 .001 .005 .005 n.s.
(b) 6.5-8.5 cps .001 .001 .001 .001 .001 .01
(c) 8.5-11.5 cps .001 .001 .001 .03 .002 .02
4 5
1 2 3 4 5 1 2 3 4 5
(d) 11.5-14.5 cps .001 .001 .001 .001 n.s. .01
(e) 14.5-20.0 cps .001 .001 .001 .005 n.s. .005
5 .001 .02 n.s. .02
.001 .001 .01 n.s.
.001 .001 .01 n.s.
.001 .001 .01 .05
.001 .005 .005 n.s.
level. These analyses were then followed by Wilcoxon matched-pairs signed'ranks tests for comparison of conditions within bandwidths. The results of these analyses are shown in Table 1. DISCUSSION This study replicates our earlier finding (Gale et al, 1969) and shows that the effect holds for a broader range of viewing conditions. EEG amplitude varies with the "arousal" value of the stimulus input. The failure to obtain a consistent significant difference for plain as opposed to complex patterns appears to be disappointing, particularly since in one case the direction is significantly reversed (2.0-6.5 Hz). However, in a more recent study (Gale et al, 1971), we have confirmed this finding. Stimuli were 2, 4, 8, 16, or 32 randornly located white squares on a black background. Midalpha activity (8.5-10.5 Hz) decreased linearly with logl n, where n equals the number of squares in the array. However, 5.5-7.5 Hz increased linearly with aseending eomplexity, There appears therefore to be an inverse relationship between theta and alpha frequencies for patterned stimulation .
If this finding proves to be robust, then future studies of visual stimulation of EEG must include sampies for the full traditional EEG range rather than limit themselves to the alpha frequency alone. In the present case, beta activity ( 14.5-20.0 cps) follows the trend shown in alpha activity, whereas a textbook view of the relation between alpha and beta would have them inversely related. Our findings in this respect are not dissimilar to those of Gengerelli & Parker (1968).
REFERENCES COOPER, R., OSSELTON, J. W., & SHAW, J. C. EEG techn%g)'. London: Butterworths, 1969. GALE, A .. DUNKIN, N., & eOLES, M. Variation in visual input and the occipital EEG. Psychonomic Science. 1969. 14, 262-263. GALE, A., CHRISTIE, B .• & PENFOLD, V. Stimulus complexity and the occipital EEG. British Journal of Psychology. 1971,62,2. GENGERELLI, J. A., & PARKER, e. E. Spectographic analysis of electroencephalograms under conditions of alertness and relaxation. Journal of Psychology, 1966, 63, 67-72 .
10
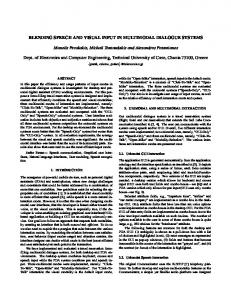
• steep-skirted, linear in output, and tested be fore experimental runs with oscillators set at the midpoint for their frequency. Both primary EEG and analyzer output were recorded on continuous millimeter graph paper run at 5 mm/sec. Each trial contained 24 x 5 sec epochs. Of these, the first and final pairs were ignored to eliminate the effects of overlap between conditions and use of instructions at the beginning of some conditions. This left 20 sampies per trial of which 10 alternate sampies were taken. The two trial values were combined for each condition, and the filter values then collapsed (as shown in Fig. 1) into bands, for statistical analysis. It was not possible to re cord an artifact-free EEG for one male S, in spite of two attempts at recording. He was, therefore, excluded from the analysis. RESULTS Group means for the five viewing conditions are shown in Fig. 1. Statistical tests were performed separatelyon the five bandwidths shown. Firstly, Friedman two-way analyses of variance were performed for each bandwidth, including and excluding the eyes-shut condition. In all cases (10 analyses), Xr 2 reached a level of signifieanee beyond the 0.001 100
• 7
•
-
...... r-
J
.... 1-
-
r-
-
-
r-"'"
.....
4
a :I
•. , _ •. s
'·5-11'5
11·' -1.·5
14· 5- 20·0
Fig.1. Mean integrated output (in millimeters) for the five viewing oonditions across five EEG frequeney bands (cycles per second), In each ease visual oomplexity decreases from left to right. Psyehon. Sei., 1971, Vol. 23 (lB)