Variations in CPU Power Consumption Jóakim v. Kistowski
Hansfried Block
John Beckett
University of Würzburg
Fujitsu Technology Solutions GmbH
Cloyce Spradling
hansfried.block@ ts.fujitsu.com Klaus-Dieter Lange
[email protected]
Oracle
Hewlett Packard Enterprise
University of Würzburg
[email protected]
samuel.kounev@ uni-wuerzburg.de
joakim.kistowski@ uni-wuerzburg.de
cloyce.spradling@ oracle.com
Dell Inc.
Samuel Kounev
ABSTRACT
Keywords
Experimental analysis of computer systems’ power consumption has become an integral part of system performance evaluation, efficiency management, and model-based analysis. As with all measurements, repeatability and reproducibility of power measurements are a major challenge. Nominally identical systems can have different power consumption running the same workload under otherwise identical conditions. This behavior can also be observed for individual system components. Specifically, CPU power consumption can vary amongst different samples of nominally identical CPUs. This in turn has a significant impact on the overall system power, considering that a system’s processor is the largest and most dynamic power consumer of the overall system. The concrete impact of CPU sample power variations is unknown, as comprehensive studies about differences in power consumption for nominally identical systems are currently missing. We address this lack of studies by conducting measurements on four different processor types from two different architectures. For each of these types, we compare up to 30 physical processor samples with a total sum of 90 samples over all processor types. We analyze the variations in power consumption for the different samples using six different workloads over five load levels. Additionally, we analyze how these variations change for different processor core counts and architectures. The results of this paper show that selection of a processor sample can have a statistically significant impact on power consumption. With no correlation to performance, power consumption for nominally identical processors can differ as much as 29.6% in idle and 19.5% at full load. We also show that these variations change over different architectures and processor types.
Variation, SPEC, SERT, Workloads, Energy Efficiency, Metrics, Load level, Utilization
Permission to make digital or hard copies of all or part of this work for personal or classroom use is granted without fee provided that copies are not made or distributed for profit or commercial advantage and that copies bear this notice and the full citation on the first page. Copyrights for components of this work owned by others than the author(s) must be honored. Abstracting with credit is permitted. To copy otherwise, or republish, to post on servers or to redistribute to lists, requires prior specific permission and/or a fee. Request permissions from
[email protected]. ICPE’16, March 12 - 18, 2016, Delft, Netherlands c 2016 Copyright held by the owner/author(s). Publication rights licensed to ACM.
ISBN 978-1-4503-4080-9/16/03. . . $15.00 DOI: http://dx.doi.org/10.1145/2851553.2851567
1.
INTRODUCTION
Energy efficiency of computing systems has become a significant issue over the past decades. Server systems play a significant part in the overall power consumption. In 2010, the U.S. Environmental Protection Agency (U.S. EPA) estimated that 3% of the entire energy consumption in the U.S. is caused by data center power draw [20]. According to a New York Times study from 2012, data centers worldwide consume about 30 billion watts per hour. This is equivalent to the approximate output of 30 nuclear power plants [3]. Governments, manufacturers, and academic researchers are addressing this problem with various approaches. Systems benchmarking is central to these, as it helps to collect comparable information, enabling better development and purchasing decisions [19]. To ensure comparability, benchmark results must meet a number of criteria including repeatability [16], reproducibility, and verifiability [25]. As a result industry standard benchmarks, such as SPECpower ssj2008 [18], require full disclosure of all system hardware components and software, as they can significantly affect power consumption and energy efficiency [27]. However, even nominally identical systems running the same hardware and software may produce different benchmark results. Reasons for this behavior can be found both in random measurement errors, as well as systematic errors due to minor differences in the nominally identical hardware components. For servers, the CPU is not only the largest consumer of power, but is also responsible for most of the dynamic changes to system power consumption [10]. Consequently, it stands to reason that CPUs are also the major factor in power variation for otherwise identical systems. Many studies analyzing differences in server power consumption with focus on CPU and CPU workloads exist [5, 6]. These studies show that CPU power may vary depending on many factors, such as CPU load, workload type, used execution units, and so on. Yet none of these studies analyze the error that results from different samples of the same CPU. In our experience, power consumption for identical CPUs can vary significantly. Yet comprehensive public studies on the size and impact of these variations are missing. Such an
analysis is necessary for many fields of research even beyond benchmarking. For example, power management mechanisms and predictive power models [4] rely on low variations in power consumption for nominally identical systems and components. The actual variation in power consumption sets an upper bound for the accuracy of those approaches. In this paper, we evaluate the power consumption and energy efficiency of four different processor types from two generations with 20 – 30 separate nominally identical physical processors (processor samples) for each of those types. In addition, as many publicly available results are not based on the publicly available final production samples of processors, we test eight separate qualification processors corresponding to two of the production batches under test. We measure energy efficiency, as well as system and CPU power consumption, for multiple workloads and load levels under two different system power management configuration. We examine the power measurements for each of the physical processor samples and compare the different distributions for the nominally identical processors. We correlate the power deviations with further measured data, such as CPU temperature and frequency. The goal of this paper is to gain insight into the variations in power consumption for nominally identical processors and into the major impact factors contributing to these variations. The major contributions of this paper are: 1. We explore the differences in power consumption of nominally identical CPUs for multiple workloads showing that these different CPU samples exhibit statistically significant differences in power consumption. 2. We investigate correlations between the power consumption variations and additional metrics, such as throughput, CPU temperature and frequency. 3. We explore the impact of different target load levels and CPU power management configurations on variations in power consumption and energy efficiency. Our measurements show that nominally identical processor samples can cause significant differences in CPU power consumption of up to 29.6%. This in turn propagates to a difference in system power of up tp 12.1%. These differences exhibit no significant correlation to CPU temperature and system performance. However, the actual observed variations in power consumption for nominally identical processors differ significantly depending on processor architecture. The remainder of this paper is structured as follows: We discuss related work in Section 2. Section 3 details the experimental setup. Section 4 explores power variations during a single measurement, whereas Section 5 evaluates power variations between samples of the same processor type, and Section 6 compares measurement results and CPU sample differences over multiple processor types, deriving overall take-away lessons. We conclude the paper in Section 7.
2.
RELATED WORK
A number of studies analyzing the power consumption of servers and processors exist. These studies analyze variations in power consumption for individual processors with focus on the major impact factors that can cause a difference in power consumption: [15] and [11] analyze CPU power consumption at the circuit level. They examine individual transistors and their
integration with the goal of power characterization and simulation. When analyzing power consumption of most commercially available processors, this circuit level power consumption is usually considered as a black-box, as information on processor internals is commonly not available. This black-box behavior may lead to issues with repeatability of power measurements and variations in power consumption. [6] and [23] analyze power consumption depending on workload with a focus on the executed CPU instructions. They characterize CPU power based on performance counter data. Similarly, [8] build a power model using performance counters. As in our case, they use industry standard benchmarks, such as SPEC CPU2006 [13] for a thorough and representative analysis. Processor power management exists at many system levels. All of these may cause variations in power consumption. [12] and [14] examine the impact of the physical location where a task is executed inside the CPU on power consumption and heat generation. Other management techniques, such as dynamic voltage and frequency scaling (DVFS) [24, 5], also have significant impact on CPU power consumption and heat. Such temperature-sensitive management techniques can add randomness to power measurements as they are influenced by environmental factors that may not be under the full control of the system’s administrator. The black-box-like behavior of some system components and the apparent randomness of environmental factors have contributed to research attempting to characterize power consumption on higher abstraction levels. Such characterizations rely on workload classifications and system level metrics, such as utilization [27, 7]. Results of these analyses are usually correlated to create full-system power models on a higher abstraction level [22, 21]. This paper addresses the power differences and variations that are caused by black-box behavior and environmental influences. We first evaluate how much the power consumption of a system can vary without any changes in the hardware, software, or system settings. We then go a step further by evaluating variations in systems that are identical in terms of technical specifications. We focus on CPUs and exchange system CPUs with nominally identical ones to analyze the impact the black-box behavior of the new sample can have on power consumption.
3.
MEASUREMENT METHODOLOGY
We test four processor types on three different systems using two test suites. All systems are tested with at least 20 samples of one production processor type. Additionally, two of the systems are measured using four corresponding qualification samples with one further measurement using a mix of six qualification and six production samples. Power consumption is measured for both the entire system under test (SUT) and the processor only. Measurements are carried out following the guidelines described in the SPEC power methodology [2].
3.1
Workloads
We run two test suites on the SUT: SERT [20] and LINPACK [9]. SERT is a rating tool for analysis and evaluation of the energy efficiency of server systems, developed by the SPEC OSG Power Subcommittee. It is not intended as a benchmark for a single system energy-efficiency score, but instead runs a number of different micro workloads, called
Worklets that exercise different parts of the SUT. It features seven separate CPU Worklets that are primarily CPU bound, but may also exercise some additional parts of the SUT (such as memory). Due to the CPU focus in this paper, we chose those worklets that have been found to be the most CPU bound [27]: 1. LU: Implements a transaction that computes the LU factorization of a dense matrix using partial pivoting. It exercises linear algebra kernels (BLAS) and dense matrix operations. LU is almost exclusively CPU bound and scales mostly with CPU frequency. 2. Compress: Implements a transaction that compresses and decompresses data using a modified Lempel-ZivWelch (LZW) method following an algorithm introduced in [28]. It finds common substrings and replaces them with a variable size code. This is deterministic and it is done on-the-fly. Thus, the decompression procedure needs no input table, but tracks the way the initial table was built. 3. SOR (Jacobi Successive Over-Relaxation): Implements a transaction that exercises typical access patterns in finite difference applications, for example, solving Laplace’s equation in 2D with Drichlet boundary conditions. The algorithm exercises basic ”grid averaging” memory patterns. Like LU, this worklet is also mostly CPU bound. As such, we use it as our second worklet for CPU-heavy heterogeneous workloads. 4. SHA256: Utilizes standard Java functions to perform SHA-256 hashing and encryption/decryption transformations on a byte array. This byte array is perturbed by one byte for each transaction. 5. Idle: Keeps the CPU in an active idle state where it is ready to receive work. SERT can run worklets (except Idle) at different target load levels. These are defined as the percentage of maximum throughput achievable on the SUT. To achieve a stable steady state, work units are dispatched with random exponentially distributed inter-arrival times. The mean of those inter-arrival times is selected as the inverse of the target throughput. All worklets except Idle are executed at the 25%, 50%, 75%, and 100% load levels. LINPACK is a benchmark measuring a computer’s ability to solve a system of linear equations. We run the Shared Memory Version (SHM) of the standalone LINPACK on each SUT. The server consumes a significant amount of power during its execution phase, eclipsing all of the SERT worklets in respect to power consumption. In contrast to SERT and its workloads, it does not explicitly take care to preserve a steady system state for stable energy measurements.
3.2
Systems under Test
We run our workloads on three different systems. For each of those systems, we pick a processor type and exchange samples after each run. Each system only has one socket populated to minimize multiple processor samples influencing one another. The system under test also remains identical for all samples of the same processor type. The SUTs are: • Fujitsu RX2540 M1 system with 4 x 16 GB RAM. We test 30 different samples of Intel’s Xeon E5-2680 v3
processor on this system. It features 12 cores and a base frequency of 2.5 GHz (up to 3.3 GHz with turbo, 120 W TDP). Each sample is tested twice: Once with turbo turned on and once with turbo turned off. We also test 12 samples of the Xeon E5-2699 v3 processor on this system (six production and six qualification samples). It is an 18 core processor with a base frequency of 2.3 GHz (3.6 GHz with turbo, 145 W TDP). • Dell PowerEdge R730 system with 4 x 16 GB RAM. We use this system to test 20 different samples of Intel’s Xeon E5-2660 v3 processor with 10 processor cores at a base frequency of 2.6 GHz (up to 3.3 GHz with turbo, 105 W TDP). We also test each sample with and without turbo on this system. • Sun Server X3-2 system with 4 x 4 GB RAM. This historical system is used to test 20 samples of the older Intel Xeon E5-2609 processor (80 W TDP). This processor from Intel’s Sandy Bridge generation is the smallest CPU to be tested. It has four cores running at a frequency of 2.4 GHz. This system does not feature a turbo mode. Instead, we perform a series of tests with all BIOS power management disabled. All systems run Red Hat Enterprise Linux (RHEL) 6.6 and use the Oracle Java HotSpot VM for executing SERT’s Java-based worklets.
3.3
Measurement Data
For the SERT measurements, throughput data is collected on a per second resolution by SERT’s Chauffeur harness [1]. Wall power is measured using the SPEC PTDaemon, which can autmatically cooperate with SERT, but can also collect data separately of any SERT execution. In addition, we measure CPU package power, temperature, and frequency using the RAPL hardware counters provided by Intel’s processors. We use Intel’s publicly available Performance Counter Monitor [17] to read these counters for every second during workload execution. For system power measurements (wall power) we use Yokogawa’s WT210 analyzer and the ZES Zimmer LMG95 power meter. Both report the power measurement uncertainty with a specified maximum measurement error of less than 1%. For our measurement the WT210 never exceeds 0.7% uncertainty and the LMG95 does not exceed 0.2% uncertainty. SERT worklets are executed in intervals with measurement phases lasting 120 seconds. All power, performance, and additional data is logged at each second during the run, providing 120 data points for each worklet at each target load level. In addition to the measurement phases, SERT also runs a number of calibration, warmup, pre-measurement, and post-measurement phases, all designed to ensure a steady measurement state. These phases are explained in more detail in [26]. LINPACK also features distinct phases with the main execution phase featuring a relatively stable interval of maximum power consumption. We detect this phase and then collect all relevant data with the corresponding time stamps. As with SERT, we collect wall power using the SPEC PTDaemon and CPU package power, temperature, and frequency using the Performance Counter Monitor for each second during LINPACK execution.
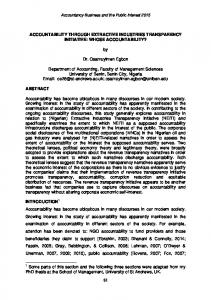
Before analyzing the variations between different samples of the same processor, we study how power variance changes depending on workload, load level, and BIOS setting. The results of this section also help to indicate how stable power consumption can be during an interval of usage at a given stable load level. Stability in power consumption is a result of both stable CPU power management and stable workloads as part of our test suites. Both are prerequisites for the comparisons of different CPU samples in subsequent sections. For this analysis, we choose the median sample of the Xeon E5-2680 v3 processor in the Fujitsu system, which was measured using our most accurate power analyzer. Additionally, we evaluate the impact of separate measurement runs on the same sample using the Xeon E5-2609 on the Oracle system. power_graph_22
200 180
Mean Power (W)
160 140 120 100 80 60 40 20 0 0
10
20
30
40
50
60
70
80
90
100
Load Level (%) Compress
Idle
LINPACK_on
LU
SHA256
SOR
Figure 1: System power consumption of the Fujitsu server with median Xeon E5-2680 v3 processor. System power consumption for all workloads on the Fujitsu system is shown in Figure 1. The figure displays the power consumption (in Watt) for each of the workloads over the full range of load levels. In contrast to the other workloads, Idle and LINPACK feature only one load level each. Idle power is the smallest consumer, whereas LINPACK is the largest consumer followed by LU at full load. The workloads scale almost linearly over load levels, increasing in power consumption with each additional level. The rest of this section will focus on the variances of the power measurement for each separate load level / workload combination. A thorough analysis of power scaling for the worklets over the different load levels can be found in [27]. We analyze the coefficient of variation (CV) for the power measurements. It is a normalized value defined as the ration of the standard deviation divided by the sample’s mean. In contrast to a comparison of the raw standard deviation, the CV allows comparing workloads and load levels with different mean power consumption, such as Idle with a mean power consumption of 51.934 W and LINPACK with its mean power of 205.789 W on the Fujitsu system with the median CPU sample. Table 1 shows the CV for CPU power consumption as measured by the Intel RAPL counter. It shows that variation during a 120 second measurement interval is relatively low and stable at a CV between 0.3% and 1.44%. This varia-
tion is independent of the processor’s current load level and turbo setting. It is also similar for many workloads. The compression workload varies more in its power consumption. We attribute this behavior to the greater intensity of its memory access which introduces more seemingly random behavior in performance and power consumption.
Turbo on
VARIATIONS DURING A SINGLE MEASUREMENT RUN
Turbo off
4.
Load 0% 25% 50% 75% 100% 0% 25% 50% 75% 100%
Idle 33.17
Com.
LU
SHA
SOR
LIN.
5.63 0.65 0.61 0.30
0.53 0.66 0.66 0.03
1.20 1.44 1.23 0.63
3.63 0.55 0.42 0.52
0.04
2.51 0.57 0.62 0.38
0.56 0.60 0.41 0.40
1.11 1.23 1.27 0.61
2.46 0.39 0.38 0.05
0.04
0.84
Table 1: Coefficients of variaton (CV) in % for CPU power consumption on median Xeon E5-2680 v3 sample. The LINPACK workload behaves differently to the SERT workloads and varies even less in its power consumption. This difference is not surprising since LINPACK work units are not dispatched using an exponentially distributed random inter-arrival process, as SERT work units are. This random arrival process for SERT transactions allows the targeting of specified load levels, but adds some variation to the power consumption. The major outlier in Table 1 is the Idle workload. On a single idle processor sample, power consumption can vary for 35.17% with turbo on, but only 0.84% without turbo. This observation underlines our previous assertion that operating system and CPU power management may lead to variations in power consumption, as idle power minimization is a major goal of those power saving mechanisms. This variation can already be observed during the time frame of a single measurement run. We back this assertion with the correlation of CPU power consumption and frequency. For most workloads, CPU power consumption and frequency correlate little. To illustrate, LU’s CPU power / frequency correlation coefficient ranges between 8.6% (25% load) and 33.3% (100% load). Other workloads are similar, as frequency remains relatively stable during the workloads’ execution. The Idle workload, however, shows significant correlation. The Idle interval with the turbo setting on, in particular, exhibits a CPU power / frequency correlation coefficient of 94.2%. Table 2 shows the variations in full system power for each measurement interval. Most CVs are smaller than their CPU power counterparts in Table 1. This indicates that a majority of the variation is caused by CPU power variations, rather than power variations due to other system components. This is especially true for the variations during system idle time. Specifically, the Idle worklet with turbo enabled features a CPU power standard deviation of 4.02 W at a mean CPU power consumption of 12.11 W, whereas the entire system features a similar standard deviation of 5.73 W at a mean power consumption of 54.07 W. The correlation coefficient of 99.93% between CPU and system power for the Idle measurement underlines this observation that CPU power directly influences system power. LINPACK behaves differently, however. Its system power CV is significantly larger than its CPU power CV. The same
Com.
LU
SHA
SOR
2.59 0.36 0.50 0.36
0.30 0.46 0.45 0.19
0.71 0.90 0.89 0.29
1.73 0.30 0.31 0.33
LIN. Perf.
Idle 10.47
4.14
0.34 1.00 0.34 0.39 0.28
0.31 0.35 0.30 0.30
0.63 0.70 0.82 0.17
1.25 0.21 0.25 0.15
3.69
Balanced
Turbo on Turbo off
Load 0% 25% 50% 75% 100% 0% 25% 50% 75% 100%
Load 0% 25% 50% 75% 100% 0% 25% 50% 75% 100%
Idle 12.93
Com.
LU
SHA
SOR
LIN.
2.48 10.02 9.20 11.00
9.56 9.80 8.87 12.12
6.52 7.28 9.83 11.21
9.32 9.29 8.72 9.19
9.03
10.80 11.18 10.23 12.43
12.17 8.40 11.89 11.98
8.38 8.18 8.96 11.72
10.36 19.40 11.35 12.91
6.21
13.62
is true for the standard deviation of its power consumption. We attribute this effect the property of LINPACK to use additional system resources, especially cooling, that are not visible in the CPU power consumption. To identify potential further stability issues with worklets that might lead to erroneous conclusions later on, we repeat our entire measurement suite 50 times on a single sample of the E5-2609 processor on the Oracle system. Specifically, we evaluate whether the variations for the median system are representative by calculating the 2nd order CVs (the CVs of the CVs) over all 50 measurement repeats. Being an older system, this system does not support turbo mode. Instead we test two different BIOS settings. We test a balanced setting (comparable to the turbo off setting for the other systems) and a performance setting with all BIOs power management disabled. The results are displayed in Tables 3 and 4. They show CPU power and system power second order CVs respectively. These 2nd order CVs show if variations between the different samples differ. Consistently high or low CVs result in a low 2nd order CV, whereas differing CVs show as high 2nd order CVs. Consequently, low values should indicate a high representativeness of our previous observations based on a single sample.
as system power is greater than CPU power. With the rest of the system remaining relatively stable over the different measurement runs, the differences in CPU power variations are somewhat mitigated. Idle is affected even more by this effect, as CPU power consumption during Idle is minimal and smallest in relation to the rest of the system. Disabling BIOS power management does not significantly reduce second order variations. CPU power variations still range between 3.91% (SHA at 74% load) and 134.06% (Idle). Most notably, idle second order variation does not decrease even though a potential source of volatility inducing power management has been eliminated. While the variations of variations are significant over multiple runs, the means of the respective measurements differ little. With balanced power management, Idle CPU power shows the smallest mean difference of 0.1 W (0.67%), ranging between 14.83 W and 14.93 W. The largest mean difference for the SERT workloads is found for LU at 50% load. However, it is only a total difference of 1.32 W (4.02%), with the minimum being 32.82 W and maximum CPU power of 34.14 W.
Idle 134.1
Com.
LU
SHA
SOR
19.15 9.26 7.10 6.41
22.35 10.07 20.36 22.54
10.87 5.57 3.91 25.91
19.87 10.73 13.93 20.52
13.36 10.06 8.07 13.27
23.51 13.79 22.63 24.11
7.84 5.02 7.22 33.67
15.76 46.66 10.11 20.52
LIN.
37.67
99.43
20.64
Table 3: Second order CVs in % for CPU power consumption for measurement repeats on Xeon E52609 sample. Both tables show that differences between the variations for the separate measurement runs are significant, but bounded. For the balanced setting, worklet second order CPU power variations range between 8.07% for Compression at 75% load and 46.66% for SOR at 50% load. Idle is the major exception with a second order variance of 99.43%, reinforcing the previous observation that Idle can be highly volatile. System power shows smaller second order variations than CPU power. Idle features the greatest variation of variations, yet it is only 13.62%. These variations are smaller,
Balanced
Balanced
Load 0% 25% 50% 75% 100% 0% 25% 50% 75% 100%
Perf.
Table 4: Second order CVs in % for system power consumption of Oracle system for measurement repeats on Xeon E5-2609 sample.
Perf.
Table 2: Coefficients of variaton (CV) in % for system power consumption on Fujitsu system, running the median Xeon E5-2680 v3 sample.
Load 0% 25% 50% 75% 100% 0% 25% 50% 75% 100%
Idle 0.17
Com.
LU
SHA
SOR
LIN.
0.06 0.09 0.11 0.12
0.31 0.35 0.59 0.10
0.23 0.36 0.41 0.32
0.25 0.20 0.15 0.07
0.12
0.15 0.13 0.11 0.15
0.26 0.81 0.60 0.15
0.24 0.31 0.31 0.21
0.13 0.28 0.21 0.18
1.19
0.13
Table 5: CVs in % for mean CPU power consumption for measurement repeats on Xeon E5-2609 sample. Subsequently the coefficients of variation for the measurement means in Table 5 are also very small. The greatest CV is the CV for LINPACK (which also features the greatest min / max difference) with 1.19%, the next greatest being 0.81% for LU at 50% load. These numbers do not change significantly with BIOS power management disabled. Idle min / max difference is still 0.1 W and the greatest min / max difference is LU at 75% load with an absolute difference of 0.8 W and a CV of 0.6%. In contrast to the low CPU temperature correlation during a single measurement, repeated power measurements exhibit a correlation. All workload / load level combinations
Turbo off
Turbo on
Load 0% 25% 50% 75% 100% 0% 25% 50% 75% 100%
Idle 2.83 W (29.15%)
Compress
LU
SHA256
SOR
LINPACK
4.92 W (13.20%) 6.15 W (9.63%) 9.65 W (11.22%) 10.12 W (9.22%)
4.87 W (15.58%) 4.26 W (6.02%) 7.22 W (7.02%) 0.01 W (0.01%)
5.53 W (13.01%) 8.12 W (13.78%) 11.01 W (14.43%) 15.30 W (16.36%)
4.28 W (11.24%) 7.39 W (12.54%) 10.62 W (14.09%) 14.36 W (15.86%)
0.05 W (0.05%)
3.42 W (11.68%) 5.87 W (10.55%) 7.78 W (10.76%) 10.78 W (12.12%)
4.78 W (15.69%) 5.71 W (8.78%) 8.25 W (9.17%) 7.44 W (6.61%)
4.76 5.65 6.89 7.75
3.69 5.55 6.64 7.47
0.04 W (0.03%)
2.32 W (23.87%) W W W W
(12.50%) (11.12%) (10.78%) (10.14%)
W W W W
(14.20%) (10.95%) (10.43%) (10.01%)
Turbo off
Turbo on
Table 6: Min / max CPU power consumption differences over all Xeon E5-2680 v3 samples. Load 0% 25% 50% 75% 100% 0% 25% 50% 75% 100%
Idle 3.34 W (6.47%)
Compress
LU W W W W
SHA256
SOR W W W W
LINPACK
5.83 W (6.22%) 8.01 W (6.28%) 12.53 W (7.96%) 13.73 W (7.23%)
5.91 5.46 8.52 1.01
(6.97%) (4.10%) (4.89%) (0.52%)
6.96 W (7.16%) 10.26 W (8.74%) 14.40 W (10.31%) 19.64 W (12.16%)
5.17 9.44 14.01 18.66
(5.58%) (8.04%) (10.11%) (11.82%)
1.56 W (0.76%)
4.54 W (5.43%) 7.93 W (6.84%) 9.72 W (6.96%) 13.58 W (8.38%)
5.90 W (7.04%) 7.74 W (6.17%) 11.02 W (7.02%) 10.79 W (5.82%)
6.03 W (6.61%) 7.45 W (6.98%) 8.59 W (6.96%) 10.35 W (7.44%)
4.87 W (6.22%) 7.38 W (6.91%) 8.37 W (6.81%) 10.12 W (7.40%)
1.85 W (0.90%)
3.66 W (7.18%)
Table 7: Min / max system power differences for Fujitsu system over all Xeon E5-2680 v3 samples. show a positive correlation coefficient. This coefficient is the largest at full load, with all coefficients greater than 84% with the exception of SHA256 at 55% correlation. Concluding, we learn that power measurements are very stable both within one measurement run and in their means for multiple runs. Variations can be inconsistent over multiple runs and differ significantly, yet the mean remains very similar. The Idle workload is the odd man out. It can pose challenges as unforeseen power management may cause significant variation during single measurement intervals. However, mean idle power remains the most consistent over multiple measurements. Because of this consistency over multiple measurements and due to the importance of a processor’s idle behavior, for many practical considerations, we still analyze differences in idle consumption for the upcoming sections.
5.
VARIATIONS BETWEEN SAMPLES OF THE SAME CPU
Having analyzed the differences between power consumption and power variations, we analyze the power consumption differences for multiple nominally identical processor samples. We answer the question of how much power consumption can differ over multiple samples and if these differences are statistically significant beyond the power differences occurring within a single sample. We also examine variances in processor performance and how these correlate with power consumption. Finally, we take a look at additional impact factors and correlations, including temperature and frequency. For this analysis, we must consider that the nature of outliers is different when comparing measurements on different samples, rather than comparing multiple measurement iterations from the same sample. Section 4 shows that, for single samples, variations are due to environmental conditions, such as temperature and unforeseen behavior of power management. When comparing multiple samples, differences can
also be caused by systematic differences in the integrated circuits of the samples. With this in mind, outliers gain importance as they may not be “random” flukes, but rather rare samples with a systematic difference. Table 6 shows the differences for the mean CPU power consumption of the different Xeon E5-2680 v3 samples. These differences in power consumption of different samples are significantly larger, both absolutely and relatively, than the intra-sample differences for repeat measurements of the same sample (see Section 4). The greatest relative difference if for CPU power consumption at 29.15% with turbo and 23.87% without turbo. The greatest absolute difference is found for SHA256 at 100% load with a difference of 15.3 W with turbo. Incidentally, this is also the second highest relative variation. With turbo enabled, the smallest relative difference is 0.01% for LU at full load. Turbo disabled features the smallest relative difference of 0.03% for LINPACK. LINPACK and LU are the two biggest power consumers in our test suite. With both of these featuring the smallest differences, it stands to reason that CPU power differences between samples diminish at the highest utilization. However, this only seems to be the case for workloads that truly maximize their power consumption on the processor and is helped by BIOS settings that increase a workload’s ability to maximize consumption (such as turbo). Other workloads do not manage to reach this limit, as they do not consume as much power at their highest load levels. Table 7 shows the respective differences between minimum and maximum system power consumption for the 30 processor samples. Due to the greater base power, relative differences in power consumption decrease, even as absolute differences increase. Workloads with lower absolute CPU consumption are affected more by this. However, the increase in absolute differences indicates that an increase in CPU power consumption can lead to an increase in power consumption of secondary subsystems, such as cooling. System power and CPU power correlate strongly. For all
Idle 6.95
Com.
LU
SHA
SOR
LIN.
3.34 2.34 2.93 2.93
4.06 1.69 1.44 0.00
2.74 3.21 3.73 4.27
2.72 2.96 3.63 4.32
0.01
2.97 2.36 2.37 2.73
4.07 1.98 2.13 1.96
2.42 2.44 2.40 2.37
3.68 2.38 2.35 2.33
Table 8: CVs in % for mean CPU power consumption over all Xeon E5-2680 v3 samples. The observations from comparing min / max differences are validated by the coefficients of variation over the mean CPU power consumption of all 30 samples (see Table 8). Again, Idle has the greatest variation, whereas LINPACK and LU feature the least variation. The variation of means also helps to expose the observation that only the greatest power consumers decrease in variation at full load. With turbo enabled, SOR and SHA256 have the second and third greatest variations in power consumption at full load. These two workloads are not near the CPU power limit, with SHA256 consuming a total average of 99.34 W and SOR a total average of 96.28 W. LINPACK and LU, on the other hand, consume 119.86 W and 119.88 W respectively. We show the means and variations for SHA256 CPU power consumption in Figure 2. The box-plot shows the distributions of the power consumption for the separate physical CPU samples. Each colored box shows the range between first and third quartile and the horizontal line inside the boxes displays the median. The mean is shown using a filled circle. The figure shows that all CPUs vary a little with only small groups of similar samples. Means are scattered over the entire range of power differences, with some outliers at the top. The figure also shows that samples vary significantly in their internal variance. Some samples show significant variances, wheras others have all of their measured values clustered closely around their mean.
Power (W)
mean_cpu_power_SHA256_100
105
100
95
0
Sample Figure 2: CPU power consumption of Xeon E5SHA256@100%[1] SHA256@100%[2] SHA256@100%[3] SHA256@100%[4] 2680 v3 processor samples running SHA256SHA256@100%[5] at 100% SHA256@100%[6] SHA256@100%[7] SHA256@100%[8] SHA256@100%[9] SHA256@100%[10] load. SHA256@100%[11] SHA256@100%[12] SHA256@100%[13] SHA256@100%[14] SHA256@100%[15]
SHA256@100%[16]
SHA256@100%[17]
SHA256@100%[18]
These differences in variances also show in the samples’ SHA256@100%[20] SHA256@100%[21] SHA256@100%[22] second order SHA256@100%[24] coefficients SHA256@100%[25] of variance in Tables 9 and 10. SHA256@100%[23] SHA256@100%[26] SHA256@100%[27] SHA256@100%[28] SHA256@100%[29] SHA256@100%[30] These variances of variances are significantly greater than the intra-sample variances of Tables 3 and 4. This shows that power measurement stability is additionally affected by SHA256@100%[19]
Turbo off
0.01
Turbo on
5.93
Load 0% 25% 50% 75% 100% 0% 25% 50% 75% 100%
Idle 183.3
Com.
LU
SHA
SOR
LIN.
9.49 10.44 9.95 53.83
27.65 9.47 14.64 35.94
11.70 8.98 7.99 43.43
17.80 15.91 11.87 49.69
156.5
17.80 6.59 11.22 28.29
48.77 10.82 7.57 58.15
9.65 7.47 5.97 61.09
45.35 8.77 10.72 79.98
122.2
179.1
Table 9: Second order CVs in % for CPU power consumption over all Xeon E5-2680 v3 samples.
Turbo on
Load 0% 25% 50% 75% 100% 0% 25% 50% 75% 100%
CPU sample properties, beyond the random errors and variances that can occur on a single sample. Idle features the greatest variance again, regardless of turbo setting. Taking its differences in mean power consumption into account, it is safe to deduce that Idle is the by far the most volatile of all workloads. It is apparently also the state where differences between samples are the most visible, as Idle means are relatively stable for single samples, despite its volatility. Similarly, LINPACK, a workload with very small relative differences in mean power consumption, shows significant second order variances.
Turbo off
Turbo off
Turbo on
workloads, the correlation coefficient for the means of those power exceeds 98%. The only exceptions are LU at high load and LINPACK. These two workloads show so little variance in CPU power consumption that the remaining system power variation is seemingly random.
Load 0% 25% 50% 75% 100% 0% 25% 50% 75% 100%
Idle 172.8
Com.
LU
SHA
SOR
LIN.
8.74 212.1 6.99 244.7
24.23 6.32 16.55 45.40
13.46 11.10 119.71 293.57
17.24 26.36 11.43 28.17
15.56
105.8 238.3 8.64 318.8
39.01 9.65 7.60 38.53
10.14 7.00 6.84 21.83
34.64 10.57 8.13 372.1
13.41
169.4
Table 10: Second order CVs in % for system power consumption over all Xeon E5-2680 v3 samples. Apart from Idle, workloads seem to show their greatest second order variance at their highest load levels and smaller second order variances at the 50% and 75% load levels. The major exception to this rule is Compression which has a second order variation of coefficients of 212.05% at the 50% load level. In Section 4 we found that power consumption differences for repeated measurements on a single sample are strongly correlated with CPU temperature. This correlation is not nearly as strong when comparing different samples. CPU power and temperature correlate for some workloads, but not all. SHA256 and SOR feature an 80% / 82% correlation between CPU power consumption per sample and CPU temperature. However, at the 25% and 50% load levels no workload exceeds a correlation of 53%. Most importantly, the workload with the highest relative CPU power difference between samples (Idle) features only a correlation of 19.8%. This leads us to conclude that differences in power consumption of multiple samples are also significantly influenced by effects other than CPU temperature. Finally, we evaluate the variances in performance and how those relate to the power variances for the respective samples. We compare the throughput (in s−1 ) for the SERT
T. on T. off
Load 25% 50% 75% 100% 25% 50% 75% 100%
Compress 207.64 s−1 (3.42%) 411.63 s−1 (3.40%) 620.06 s−1 (3.41%) 982.51 s−1 (4.07%) 94.20 s−1 (1.73%) 164.30 s−1 (1.50%) 223.87 s−1 (1.36%) 286.50 s−1 (1.31%)
LU 683.24 s−1 (4.38%) 1338.75 s−1 (4.29%) 2008.15 s−1 (4.29%) 2575.86 s−1 (4.18%) 200.66 s−1 (1.32%) 362.76 s−1 (1.19%) 581.34 s−1 (1.27%) 1852.97 s−1 (3.11%)
SHA256 16.66 s−1 (1.70%) 25.75 s−1 (1.31%) 37.19 s−1 (1.26%) 37.05 s−1 (0.94%) 13.22 s−1 (1.57%) 24.06 s−1 (1.42%) 25.96 s−1 (1.02%) 31.21 s−1 (0.92%)
33.42 59.92 74.70 59.39 30.82 49.47 44.51 55.80
SOR s−1 (0.35%) s−1 (0.31%) s−1 (0.26%) s−1 (0.15%) s−1 (0.37%) s−1 (0.30%) s−1 (0.18%) s−1 (0.17%)
Table 11: Min / max throughput differences for Fujitsu system over all Xeon E5-2680 v3 samples.
6.
VARIATION DIFFERENCES BETWEEN PROCESSOR TYPES
We compare the power variances of the Xeon E5-2680 v3 processors from Section 5 with results of 20 samples of the Xeon E5-2660 v3 processor running on a Dell server. The processors are nearly identical, save for a 100 MHz difference in frequency and two less cores for the E5-2660 v3. Using these processors we investigate if a reduced number of cores has an impact on the CPU power variations. Next, we compare those results to results from 20 samples of the Intel Xeon E5-2609 processor. These results will help indicate if differences between processor generations exist. Finally,
we analyze processor qualification samples, which are often used for system design and analysis at early stages of a processor’s product line life cycle.
6.1
Core Count
Turbo on
The Intel Xeon E5-2660 v3 processor running on our Dell PowerEdge R730 system is a 10-core CPU with a base frequency of 2.6 GHz. It has fewer cores than the 12-core E52680 v3 from our previous measurements and a 100 MHz higher base frequency. The turbo frequency of the two processors is identical at 3.3 GHz. As a result, both processors move in a similar frequency range as long as turbo is enabled. We use the Dell system to determine if a lower core count affects the variation of processor power consumption across multiple samples. We show the min / max CPU power differences over the 20 samples in Table 12. As this processor is smaller than the E5-2680 v3 it consumes less total power. Consequently absolute min /max differences are also smaller. However, the same is true for the relative differences. With a few exceptions, all worklets have a lower relative min / max difference on the E5-2660 v3. Idle with turbo is one of the exceptions, displaying an almost identical relative min / max difference of 29.63%. Yet overall, the mean min / max power consumption difference of the E5-2680 v3 samples (11.8%) is 25.7% greater than the difference amongst the E5-2660 v3 samples (9.4%). With turbo disabled, the overall relative difference using an E5-2680 v3 (11.1%) is 25.1% greater than using an E5-2660 v3 (8.9%). With turbo disabled, some worklets go against the trend, as Compress, SHA256, and SOR at 100% load have a greater relative min / max difference with the E5-2660 v3 than with the E5-2680 v3.
Turbo off
worklets at their respective load levels. We do not analyze Idle and LINPACK, as Idle does not have a throughput and LINPACK does not log any. The min / max differences between the worklet throughputs is shown in Table 11. Note that the absolute values can not be compared across the different worklets, as work unit sizes differ. The relative throughput differences are significantly smaller than the relative power differences. The greatest difference is the 4.38% min / max difference for LU at 25% load, which is only slightly greater than the relative differences for LU at all other load levels. The turbo setting also affects throughput in a different way than it does power consumption. System power differences (see Table 7) were affected only minimally by the turbo. It did affect only two worklets at high loads. Turbo’s effect on throughput variations, however, is both significant and consistent. All worklets, with the exception of SOR at high loads, show significantly less performance variation with turbo disabled. Not only do performance and power behave differently across the samples and power settings, they also do not correlate. Only LU at 25% load shows a correlation greater than 50% (51.4% with turbo). All other workloads show smaller correlation coefficients in the interval between -50% and 50% correlation. In conclusion, we find that different samples of a nominally identical processor can exhibit a significantly different power consumption. These differences are most visible during the Idle state and at high load before hitting the processor’s power limit. Once this limit is reached, samples behave very similarly and differences in power consumption disappear. CPUs also show great differences in the variances of power consumption a single sample can produce during the course of a measurement run. Again, Idle is the most extreme case displaying these differences. Finally, we find that the power differences correlate little with differences in sample temperatures during measurements and not at all with the sample’s performance.
Load 0% 25% 50% 75% 100% 0% 25% 50% 75% 100%
Idle 6.59
Com.
LU
SHA
SOR
LIN.
2.71 1.92 1.84 1.60
3.37 1.78 1.30 0.05
2.13 2.18 2.92 2.54
3.07 2.24 2.31 2.76
0.00
2.82 2.24 2.12 2.21
3.18 1.90 2.30 0.10
2.12 2.21 2.41 2.32
3.08 2.36 2.07 2.42
0.01
5.50
Table 13: CVs in % for mean CPU power consumption over all Xeon E5-2660 v3 samples. The coefficients of variation for the 10-core Xeon E5-2660 v3 samples’ power consumption in Table 13 show that the cases in which relative min / max differences exceed those of the 12 core E5-2680 v3 are outliers. The CVs over all samples are always smaller for the processor with fewer cores. With
Turbo on Turbo off
Load 0% 25% 50% 75% 100% 0% 25% 50% 75% 100%
Idle 2.73 W (29.63%)
Compress 2.88 3.45 4.95 5.67
W W W W
LU
SHA256 W W W W
SOR
LINPACK
(9.83%) (6.89%) (7.37%) (5.68%)
3.40 W (11.96%) 3.82 W (7.05%) 4.37 W (5.76%) 0.18 W (0.17%)
2.48 3.77 10.09 10.15
(7.59%) (8.18%) (14.31%) (11.97%)
2.84 W (10.97%) 3.69 W (8.19%) 5.57 W (9.85%) 10.92 W (13.57%)
0.02 W (0.02%)
2.75 W (9.95%) 3.80 W (8.06%) 5.70 W (9.05%) 8.79 W (10.00%)
3.31 W (11.69%) 3.81 W (7.15%) 7.25 W (9.92%) 0.47 W (0.45%)
2.34 W (7.52%) 3.68 W (8.51%) 6.82 W (11.01%) 8.19 W (11.07%)
2.77 W (11.24%) 3.44 W (8.13%) 4.52 W (8.50%) 7.62 W (10.91%)
0.02 W (0.01%)
1.49 W (16.19%)
Table 12: Min / max system power differences for Dell system over all Xeon E5-2660 v3 samples.
Idle 236.1
Com.
LU
SHA
SOR
LIN.
9.10 8.34 11.40 98.10
17.43 19.67 25.30 8.99
7.59 8.68 8.31 89.02
9.89 9.88 7.67 61.38
15.81
9.06 9.32 6.31 47.78
17.96 12.91 21.96 40.52
6.78 4.77 50.22 80.58
15.88 9.10 8.99 82.33
20.07
20.03
Table 14: Second order CVs in % for system power consumption over all Xeon E5-2660 v3 samples. The differences in variations over the respective samples do not differ as much between the two processor types, as long as turbo is enabled. With a mean second order CV of all E5-2680 v3 samples of 37.7% only differs slightly from the mean second order CV of the E5-2660 v3 samples (36.3%). Disabling turbo increases the differences in variations significantly, as mean CVs decrease for the E5-2660 v3 samples, but not for the larger E5-2680 v3. Most of this can be attributed to the great second order variations of LINPACK and Idle measurements on the 10 core processor. We conclude that decreasing the number of processor cores reduces the relative variation in CPU power. The turbo settings affects this decrease, as it is more significant with turbo enabled than with a disabled turbo. Our analysis of the second order variations of CPU power consumption returns conflicting results and remains inconclusive.
6.2
Processor Architecture
The 20 Intel Xeon E5-2609 CPU samples running on Oracle’s Sun Server X3-2 are older quad-core CPUs of Intel’s Sandy Bridge generation. It is the CPU with the least cores in our analysis and the only CPU of a non-Haswell architecture. Measurements using these CPUs are not only intended to confirm the observations on variation differences due to core counts, but may also indicate differences due to changes to the CPU architecture and semi conductor size. Due to its age, this SUT does not feature a turbo setting. As a result, we compare the results with the “turbo off” runs of the other processor types.
Balanced
Load 0% 25% 50% 75% 100% 0% 25% 50% 75% 100%
Table 15 shows the min / max mean CPU power consumption differences for the 20 E5-2609 samples. LINPACK behaves differently on this processor, as it varies stronger than for the Haswell CPUs in the previous Sections. The min / max difference over the Xeon E5-2609 samples is 8.91 W (19.45%), a significant increase compared to the 0.04 W of the other CPUs. The variations also scale differently with increasing load. Measurements using the Haswell processors showed no clear link between load level and difference in sample power consumption. However, the Sandy Bridge samples do. CPU power consumption differences between samples increase with rising load for all workloads. These results indicate a significant impact of processor architecture on inter sample power variation. This assumption is further compounded by the observation that even without the LINPACK result the 9.5% mean min / max difference over the quad-core E5-2609 samples is very similar to the 9.4% min / max difference of the 10 core E5-2660 v3, although the latter is a significantly larger processor. Load 0% 25% 50% 75% 100%
Idle 1.39
Com.
LU
SHA
SOR
LIN.
1.32 1.98 2.33 2.58
1.35 2.30 2.61 2.63
1.61 1.94 2.35 2.52
1.34 2.04 2.45 2.60
4.92
Table 16: CVs in % for mean CPU power consumption over all Xeon E5-2609 samples. Table 16 shows that the observations based on the min / max differences are systematic and not due to outliers. The coefficients of variation over all 20 CPU power means lead to the same conclusions. In contrast to the Haswell-based measurements, LINPACK’s power consumption varies the most. It does not show signs of hitting a power limit and throttling to a similar power consumption over all samples. Similarly, the CVs also support the observation that power variations increase with load levels. This includes a relatively low variation for the Idle workload, which is in stark contrast to Idle’s volatility on the newer processors.
Balanced
Turbo off
Turbo on
turbo, the CV of means shows a relative difference of 29.0% between the processor types. Without turbo, this relative difference is reduced to 13.3%. The latter relative difference is smaller than the difference with turbo enabled, supporting the assertion that disabling turbo reduces the differences between the processor types’ variations.
Load 0% 25% 50% 75% 100%
Idle 243.3
Com.
LU
SHA
SOR
LIN.
11.66 8.10 5.71 24.91
26.71 11.84 21.54 26.95
5.76 7.17 6.50 25.22
16.49 12.28 8.44 25.53
99.98
Table 17: Second order CVs in % for CPU power consumption over all Xeon E5-2609 samples.
Balanced
Load 0% 25% 50% 75% 100%
Idle 0.97 W (6.75%)
Compress
LU
SHA256
SOR
LINPACK
1.27 W (6.36%) 2.38 W (8.70%) 3.49 W (10.51%) 4.48 W (12.00%)
1.13 W (5.67%) 2.97 W (9.79%) 4.57 W (12.45%) 5.09 W (12.19%)
1.54 W (7.45%) 2.25 W (8.72%) 3.23 W (10.78%) 3.79 W (11.18%)
1.12 W (5.89%) 2.43 W (9.39%) 3.44 W (11.22%) 3.99 W (11.71%)
8.91 W (19.45%)
Table 15: Min / max system power differences for Oracle (Sun) system over all Xeon E5-2609 samples. mean_cpu_power_Idle_0 11.4
6.3
Qualification Samples
Finally, we test qualification samples for our Haswell-based processors. Qualification samples are often used in product testing and development before final production samples are available. We test if power measurement results obtained from qualification samples can be transferred to the final production samples. This would be the case if qualification sample power consumption resulted from the same distribution as production sample power. We run all workloads on four qualification samples, corresponding to the Xeon E5-2680 v3 production processors and LINPACK on four qualification samples corresponding to the Xeon E5-2660 v3 processors. In addition, we test a total of 12 samples of the Xeon E5-2699 v3 processor (six production and six qualification samples). Our comparison focuses on the workloads with the least and most variations, namely LINPACK, Idle, and SOR at 100% load. We choose SOR at 50% load as an additional workload to focus on, representing workloads with average variations. Figures 3 and 4 show the Idle CPU power consumption of the E5-2680 v3 production and qualification samples with turbo enabled. For the Idle workload, qualification sample results are in the same range as production sample results. There seems to be no significant difference between the sample batches. Consequently, the CPU power means for the samples from the two batches also fail the Student’s T Test, as the 95% difference confidence interval includes 0. Disabling turbo does not change anything. The qualification samples still fall into the lower range of the overall distribution, but do not differ in a statistically significant way. The qualification samples’ CPU power does not differ significantly for the other worklets either. With turbo enabled, CPU power means for the qualification processors are always included in the min / max interval of the production means, regardless of load level or workload. This is even
11.2 11.0
Power (W)
10.8 10.6 10.4 10.2 10.0 9.8 9.6 0
Sample Figure 3: CPU power consumption of Xeon E5Idle@0%[1] Idle@0%[2] Idle@0%[3] Idle@0%[4] Idle@0%[5] Idle@0%[6] Idle@0%[7] 2680 v3 production samples running Idle. mean_cpu_power_Idle_0 Idle@0%[8] Idle@0%[9] Idle@0%[10] Idle@0%[11] Idle@0%[12] Idle@0%[13] Idle@0%[14]
10.5 Idle@0%[15]
Idle@0%[16]
Idle@0%[17]
Idle@0%[18]
Idle@0%[19]
Idle@0%[20]
10.4 Idle@0%[21]
Idle@0%[22]
Idle@0%[23]
Idle@0%[24]
Idle@0%[25]
Idle@0%[26]
Idle@0%[27] 10.3
Idle@0%[28]
Idle@0%[29]
Idle@0%[30]
Power (W)
Second order CVs in Table 17 are also overall smaller than for the other processors, but few exceptions remain. Despite being volatile with its means, Idle still features significant differences in the size of its variations. LINPACK, on the other hand, shows more volatility than on the E5-2660 v3, but less than on the E5-2680 v3. No other workload exceeds 27%, whereas they pass it multiple times on the newer CPUs. Concluding, we find that CPU architecture has a significant impact on the variances in power CPU power consumption over multiple CPU samples. As power scales differently over load levels, so do the differences for the samples. Specifically, differences for the Sandy Bridge CPUs increase with load levels and show no sign of throttling at high load. They also do not vary as much during idle times. Also, note that the measurement results over all Xeon E5-2609 samples differ significantly from repeated measurements on a single sample in Section 4, supporting the observations and conclusions of that section.
10.2 10.1 10.0 9.9 9.8
0
Sample
Figure 4: CPU power of qualification samples corresponding to Xeon E5-2680 v3, running Idle. Idle@0%[1]
Idle@0%[2]
Idle@0%[3]
Idle@0%[4]
true for LINPACK, although this workload features only a CPU power range of 0.05 W (0.05%) over all production samples. Despite this tiny window, no qualification sample strays beyond it. Disabling turbo changes this behavior for some workloads. Idle and LINPACK do not change, as min / max intervals of the production samples still include the qualification samples. SOR, on the other hand, features qualification outliers on all load levels. To illustrate, at 50% load one of the qualification samples has a mean power consumption that is 2.3 W less than the best production sample. However, these outliers are still not statistically significant and fail the 95% confidence level T test. This statistical indifference is repeated for the Xeon E5-2660 v3 and the corresponding qualification processors. Sample variations are difficult to compare, due to the qualification batch’s small sample size. Yet even with this small sample size, coefficients of variation across sample means are very similar for qualification and production samples. Idle features the greatest variation (7.3% for production and 7.0% for qualification samples, turbo on), followed by SOR at full load (4.5% and 4.3%). LINPACK features the smallest CVs without turbo (0.1% and 0.0%), and is surpassed slightly by LU at full load with turbo (0% for both production and qualification samples). Measurements on the Xeon E5-2699 v3 samples confirm these observations. Qualification and production samples are not distinguishable based on their power consumption. Again, some qualification samples use slightly less power than the production samples, yet not enough for any statistical significance. Other qualification samples consume
19160 19140
Throughput
19120 19100
Production Samples
Qualification Samples
Figure 5: Throughput distribution of qualification and production Xeon E5-2680 v3 samples, running SOR at 50% load. more power and behave similarly to some of the less energy efficient production samples. Figure 6 shows the power consumption of all samples for SOR at 50% load, visualizing that qualification samples behave like “good” production samples, but not in a statistically significant manner. mean_cpu_power_SOR_50
89 88
production7samples
qualification7samples
87 86
Power (W)
85 84 83 82 81 80
8.
79 78 77 76 0
Sample
Figure 6: CPU power of Xeon E5-2699 v3 running SOR@50%[1] SOR@50%[2] SOR@50%[3] SOR@50%[4] SOR@50%[5] SOR@50%[6] SOR at 50% load.SOR@50%[9] SOR@50%[10] SOR@50%[11] SOR@50%[12] SOR@50%[7] SOR@50%[8] Performance is also very similar for both qualification and production processors. Throughput means for the qualification samples are always in the min / max interval of the corresponding production sample throughputs. Figure 5 illustrates this using the throughput distributions for the Xeon E5-2680 v3 processor running SOR at 50% load. Concluding, qualification samples’ performance and power consumption does not differ significantly from the performance and power of their corresponding production processors. Our few qualification samples appear to have the properties of “good” production samples, consuming relatively little energy at similar performance. Yet, they do not feature any significant difference to other good production samples and are not different enough to conclude any systematic difference.
7.
absolute differences just before this limit is reached. Power consumption variations during other states is still significant. At 50% load, for instance, relative differences in CPU power can be as high as 12.5%. The results and conclusions of this paper are not only of interest to benchmarking and standardization bodies. Benchmarking features the challenge of uncertainty when dealing with measurement results as only a comparison with other samples on an identical system can show if a measured result was measured using a “good” or “bad” processor. Beyond benchmarking, power prediction for power management and modeling is affected. The variations presented in this paper show a boundary of how accurate any power prediction mechanism for a nominally known system can be. E.g., a power prediction might be off by 10% or more entirely because an unfavorable processor sample was used for the predicted system. This paper prompts future research as methods must be found to identify whether a given processor sample is a better or worse compared to other existing nominally identical samples. This is challenging as only a very small number (usually one) of processor samples is available to most users. The ability to identify the type of sample would enable more accurate comparisons of systems and classifications of measurement results.
CONCLUSIONS
In this paper, we demonstrate that identical systems, containing nominally identical processors can exhibit significant power consumption differences that do not correlate significantly with CPU temperature and system performance. The differences are most significant during two system states: idle and high load. Idle is the most volatile state for power measurements. Different processor samples exacerbate this problem, leading to differences in mean idle power consumption of up to 29.6%. The state with the second highest power differences is high load. Older systems exhibit their greatest variations here. Newer systems feature advanced throttling mechanisms that minimize differences at the processor’s temperature and power limit. They reach their greatest
ACKNOWLEDGMENTS
The authors also wish to acknowledge current and past members of the SPECpower Committee who have contributed to the design, development, testing, and overall success of SERT: Sanjay Sharma, Nathan Totura, Mike Tricker, Greg Darnell, Karl Huppler, Van Smith, Ashok Emani, Paul Muehr, David Ott, Cathy Sandifer, Jason Glick, and Dianne Rice, as well as the late Alan Adamson and Larry Gray. SPEC and the names SERT, SPEC PTDaemon, and SPECpower ssj are registered trademarks of the Standard Performance Evaluation Corporation. Additional product and service names mentioned herein may be the trademarks of their respective owners.
9.
REFERENCES
[1] SPEC Chauffeur WDK. http://spec.org/chauffeur-wdk/. [2] SPEC Power and Performance Benchmark Methodology. http://spec.org/power/docs/SPECPower and Performance Methodology.pdf. [3] C. Babcock. NY Times data center indictment misses the big picture. 2012. [4] R. Basmadjian, N. Ali, F. Niedermeier, H. de Meer, and G. Giuliani. A Methodology to Predict the Power Consumption of Servers in Data Centres. In Proceedings of the 2nd International Conference on Energy-Efficient Computing and Networking, e-Energy ’11, pages 1–10, New York, NY, USA, 2011. ACM. [5] R. Basmadjian and H. De Meer. Evaluating and modeling power consumption of multi-core processors. In Future Energy Systems: Where Energy, Computing and Communication Meet (e-Energy), 2012 Third International Conference on, pages 1–10, May 2012. [6] F. Bellosa. The Benefits of Event: Driven Energy Accounting in Power-sensitive Systems. In Proceedings of the 9th Workshop on ACM SIGOPS European
[7]
[8]
[9]
[10]
[11]
[12]
[13]
[14]
[15]
[16]
[17]
Workshop: Beyond the PC: New Challenges for the Operating System, EW 9, pages 37–42, New York, NY, USA, 2000. ACM. F. Chen, J. Grundy, Y. Yang, J.-G. Schneider, and Q. He. Experimental Analysis of Task-based Energy Consumption in Cloud Computing Systems. In Proceedings of the 4th ACM/SPEC International Conference on Performance Engineering, ICPE ’13, pages 295–306, New York, NY, USA, 2013. ACM. G. Contreras and M. Martonosi. Power prediction for Intel XScale reg; processors using performance monitoring unit events. In Low Power Electronics and Design, 2005. ISLPED ’05. Proceedings of the 2005 International Symposium on, pages 221–226, Aug 2005. J. J. Dongarra. The linpack benchmark: An explanation. In Supercomputing, pages 456–474. Springer, 1988. X. Fan, W.-D. Weber, and L. A. Barroso. Power Provisioning for a Warehouse-sized Computer. In The 34th ACM International Symposium on Computer Architecture, 2007. B. George, G. Yeap, M. Wloka, S. Tyler, and D. Gossain. Power analysis for semi-custom design. In Custom Integrated Circuits Conference, 1994., Proceedings of the IEEE 1994, pages 249–252, May 1994. M. Gomaa, M. D. Powell, and T. N. Vijaykumar. Heat-and-run: Leveraging SMT and CMP to Manage Power Density Through the Operating System. In Proceedings of the 11th International Conference on Architectural Support for Programming Languages and Operating Systems, ASPLOS XI, pages 260–270, New York, NY, USA, 2004. ACM. J. L. Henning. SPEC CPU2000: measuring CPU performance in the New Millennium. Computer, 33(7):28–35, Jul 2000. S. Heo, K. Barr, and K. Asanovic. Reducing power density through activity migration. In Low Power Electronics and Design, 2003. ISLPED ’03. Proceedings of the 2003 International Symposium on, pages 217–222, Aug 2003. C. X. Huang, B. Zhang, A.-C. Deng, and B. Swirski. The design and implementation of powermill. In Proceedings of the 1995 International Symposium on Low Power Design, ISLPED ’95, pages 105–110, New York, NY, USA, 1995. ACM. K. Huppler. The Art of Building a Good Benchmark. In R. Nambiar and M. Poess, editors, Performance Evaluation and Benchmarking, volume 5895 of Lecture Notes in Computer Science, pages 18–30. Springer Berlin Heidelberg, 2009. Intel. Intel Performance Counter Monitor. https://software.intel.com/en-us/articles/intelperformance-counter-monitor.
[18] K.-D. Lange. Identifying Shades of Green: The SPECpower Benchmarks. Computer, 42(3):95–97, March 2009. [19] K.-D. Lange and K. Huppler, editors. Server Efficiency: Metrics for Computer Servers and Storage. ASHRAE, January 2015. [20] K.-D. Lange and M. G. Tricker. The Design and Development of the Server Efficiency Rating Tool (SERT). In Proceedings of the 2nd ACM/SPEC International Conference on Performance Engineering, ICPE ’11, pages 145–150, New York, NY, USA, 2011. ACM. [21] A. Lewis, S. Ghosh, and N.-F. Tzeng. Run-time Energy Consumption Estimation Based on Workload in Server Systems. In Proceedings of the 2008 Conference on Power Aware Computing and Systems, HotPower’08, pages 4–4, Berkeley, CA, USA, 2008. USENIX Association. [22] S. Rivoire, P. Ranganathan, and C. Kozyrakis. A Comparison of High-level Full-system Power Models. In Proceedings of the 2008 Conference on Power Aware Computing and Systems, HotPower’08, pages 3–3, Berkeley, CA, USA, 2008. USENIX Association. [23] J. Russell and M. Jacome. Software power estimation and optimization for high performance, 32-bit embedded processors. In Computer Design: VLSI in Computers and Processors, 1998. ICCD ’98. Proceedings., pages 328–333, Oct 1998. [24] J. H. Sch¨ onherr, J. Richling, M. Werner, and G. M¨ uhl. Event-driven processor power management. In Proceedings of the 1st International Conference on Energy-Efficient Computing and Networking, e-Energy ’10, pages 61–70, New York, NY, USA, 2010. ACM. [25] J. von Kistowski, J. A. Arnold, K. Huppler, K.-D. Lange, J. L. Henning, and P. Cao. How to Build a Benchmark. In Proceedings of the 6th ACM/SPEC International Conference on Performance Engineering (ICPE 2015), ICPE ’15, New York, NY, USA, February 2015. ACM. [26] J. von Kistowski, J. Beckett, K.-D. Lange, H. Block, J. A. Arnold, and S. Kounev. Energy Efficiency of Hierarchical Server Load Distribution Strategies. In Proceedings of the IEEE 23nd International Symposium on Modeling, Analysis and Simulation of Computer and Telecommunication Systems (MASCOTS 2015). IEEE, October 2015. [27] J. von Kistowski, H. Block, J. Beckett, K.-D. Lange, J. A. Arnold, and S. Kounev. Analysis of the Influences on Server Power Consumption and Energy Efficiency for CPU-Intensive Workloads. In Proceedings of the 6th ACM/SPEC International Conference on Performance Engineering (ICPE 2015), ICPE ’15, New York, NY, USA, February 2015. ACM. [28] T. Welch. A Technique for High-Performance Data Compression. Computer, 17(6):8–19, June 1984.


![Why IT Works [PDF]](https://m.moam.info/img/260x300/why-it-works-pdf_647d70d0098a9e6c638b461a.jpg)