Diversity 2014, 6, 827-843; doi:10.3390/d6040827 OPEN ACCESS
diversity ISSN 1424-2818 www.mdpi.com/journal/diversity Article
Variations of Bacterial Community Structure and Composition in Mangrove Sediment at Different Depths in Southeastern Brazil Lucas William Mendes * and Siu Mui Tsai Cell and Molecular Biology Laboratory, Center for Nuclear Energy in Agriculture CENA, University of São Paulo USP, Piracicaba, SP, CEP 13400-970, Brazil; E-Mail:
[email protected] * Author to whom correspondence should be addressed; E-Mail:
[email protected]; Tel.: +55-19-34294643. External Editor: Peter Saenger Received: 20 October 2014; in revised form: 25 November 2014 / Accepted: 1 December 2014 / Published: 11 December 2014
Abstract: Tropical mangroves are considered one of the most productive ecosystems of the world, being characterized as nurseries and food sources for fish and other animals. Microorganisms play important roles in these environments, and the study of bacterial communities is of paramount importance for a better comprehension of mangrove dynamics. This study focused on the structure and composition of bacterial communities in mangrove sediments at different depths and points, located in Southeastern Brazil. Terminal Restriction Fragment Length Polymorphism (T-RFLP) was used to determine the community structure, and 16S rRNA gene pyrosequencing was used to characterize the community composition. Redundancy analysis of T-RFLP patterns revealed differences in bacterial community structure according to soil attributes and depth. The parameters K and depth presented significant correlation with general community structure. Most sequences were classified into the phylum Proteobacteria (88%), which presented differences according to the depth, where the classes Betaproteobacteria (21%) and Deltaproteobacteria (16%) were abundant at 10 cm and Epsilonproteobacteria (35%) was abundant at 40 cm depth. Clear differences were observed in community composition as shown by the differential distribution of the phyla Firmicutes (1.13% and 3.8%, for 10 cm and 40 cm respectively), Chloroflexi (2.8% and 0.75%), and Acidobacteria (2.75% and 0.57%) according to the depth. Bacterial diversity measurements indicated higher diversity in shallow samples. Taken together, our findings indicate that mangrove holds a diverse bacterial community, which is shaped by the variations found in the ecosystem, such as sediment properties and depth.
Diversity 2014, 6
828
Keywords: microbial ecology; T-RFLP; pyrosequencing; 16S rRNA; tropical mangrove; sediment bacterial community
1. Introduction Tropical mangroves are among the most productive ecosystems in the world, being characterized by high rate of organic matter and nutrient cycling [1]. They are located in the intertidal zones along tropical and subtropical coasts, in the transition between terrestrial, marine and freshwater environments [2]. Mangroves constitute a complex environment with high interaction between plants, animals and microorganisms, with important features such as anaerobic and highly reducing sediment [2,3]. The main determining factors for the occurrence, structure and functioning of these ecosystems are tropical temperatures, alluvial substrates, protection against waves, presence of salt water and large tidal range [4]. They are important breeding and growth habitats, refuge and food source for fish and other animals [5]. Although their importance is well known, they are at risk of degradation by pollutants and deforestation, needing urgent attention and conservation programs [6]. In mangrove sediment, the microorganisms play an important role in the productivity, conservation, and environment recovery, where they participate in the biogeochemical cycles and supply plant and animals with primary nutritional sources [7,8]. The structure and composition of microbial communities in mangrove are influenced by several factors such as nutrient content, biogeography, depth, anthropogenic activities, and tidal regime [8–11]. In recent years, the microbial communities of mangroves have been assessed using a range of techniques, including classical cultivation approach, fingerprinting techniques, clone libraries and next generation sequencing [8,9,11,12]. These studies focused on the diversity and distribution of microbial communities at different sites [8,10], different points within a mangrove [8], state of preservation [9,11,13], contamination by oil spill [14] and shrimp farms [15], and depths [11]. Recently, the advance in the next-generation DNA sequence methods, such as pyrosequencing [16], boosts scientific interests to understand the complexity of microbial community in a wide range of environments. Considering the importance and complexity of mangrove ecosystems, a description of the distribution and composition of bacterial communities in sediments would lead us to a better comprehension of the ecosystem dynamics. In the present study, in order to obtain a better insight into the mangrove microbiome, we assessed the bacterial community structure (T-RFLP) and composition (pyrosequencing) in a mangrove at different points and depths, and correlated this structure with the sediment chemical properties. This work highlights the importance of microbial ecology studies in mangrove environments and provides information that can be suitable for future development of sustainable approaches for the ecosystem preservation. 2. Methods 2.1. Sampling Sediment samples were collected from a pristine mangrove at Cardoso Island State Park in the estuary of the Cananéia, São Paulo State, Southeastern Brazil (25°05′02′′S and 47°57′42′′W—Point 1) in
Diversity 2014, 6
829
summer 2007. The vegetation is composed of three species, Laguncularia racemosa, Avicennia shaueriana and Rhizophora mangle. Sediment samples were collected along a transect of 180° S orientation and began at the margin of the bay and extended to the land. Three sub-regions were defined based on their proximity to the sea (Point 1), the middle of the mangrove (Point 2) and the proximity to the land (Point 3). The points were distributed equidistantly and were separated from one another by approximately 70 meters. Each point samples were collected in triplicate, avoiding the rhizospheric effect caused by the presence of plants roots on sediments. Tubes of 60 cm in length and 10 cm in diameter were inserted into the sediment and recovered to obtain sediment cores, which provided a vertical profile of the sediments. The cores were kept in the vertical orientation and on ice until their further processing in lab. Each of the cores was separated into subsamples based on sediment depth. Subsamples were collected at four depths: 0–10 cm, 10–20 cm, 20–30 cm and 30–40 cm. Samples were taken from the center of the tube to avoid any contamination. For each subsample, 1.5 g of sediment was collected and kept −80 °C until DNA extraction. 2.2. Sediment Chemical and Physical Analysis Sediment chemical properties were determined in triplicate for each sampling point and depth, based on 400 g of soil, performed at the Laboratory of Soil Analysis at “Luiz de Queiroz” College of Agriculture (ESALQ/USP, Piracicaba, Brazil), according to the methodology described by Van Raij et al. [17]. Briefly, the soil pH was measured in a 1:2.5 soil/water suspension and Organic matter (OM) content was measured via colorimetric method. Exchangeable Ca, and Mg were extracted with KCL 1 M. Calcium and Mg were determined by atomic absorption. Phosphorus and K were extracted by ion-exchange resin. Available micronutrients (Fe, Mn, Zn, and Cu) were extracted by Mehlich 1 and determined by atomic absorption spectrometry. Boron was extracted with hot water and determined by spectrophotometry with azomethine-H at 420 nm. Soil organic C was determined by the Walkley-Black method. The content of sand, silt and clay was estimated by dry soil and other procedures were made according to the methodologies used routinely in the lab. Nutrient content, pH and OM were measured according to the depth for each point, and physical properties, carbon, nitrogen, and sulfur were measured according to the point of sampling regardless of the depth. 2.3. DNA Extraction and T-RFLP Analysis DNA extraction from 250 mg of soil sample was carried out using the PowerSoil DNA Isolation Kit (MoBio Laboratories, Carlsbad, CA, USA), according to the manufacturer’s protocol. DNA quality and concentration were measured using NanoDrop 1000 spectrophotometry (Thermo Scientific, Waltham, EUA) and 1% sodium boric acid [18] agarose gel electrophoresis. T-RFLP fingerprinting was used to characterize the bacterial community structure of mangrove sediments. The 16S rRNA gene was amplified with primers 27f (5' AGAGTTTGATCCTGGCTCAG 3') e 1492r (5' ACCTTGTTACGACTT 3') [19]. The forward primer was labeled with 6-FAM (6-carboxyfluorescein) at the 5' end. The 25 μL reaction mixture contained 2.5 μL reaction buffer 10X (Invitrogen, Carlsbad, CA, USA), 1.0 µL MgCl2 (50 mM), 0.5 μL of deoxyribonucleotide triphosphate mixture (2.5 mM each), 0.25 µL of bovine serum albumin (BSA) (0.5 µg·µL−1), 0.5 μL of the primer set (5 pmol each), 0.2 µL (5 U) of Platinum Taq DNA polymerase (Invitrogen), 5 µL of DNA template (approximately 50 ng) and 14.55 µL of sterilized
Diversity 2014, 6
830
ultrapure water. PCR amplification was performed using a GeneAmp PCR System 9700 thermal cycler (Applied Biosystems, Foster City, CA, USA) with the following amplification cycles: 94 °C for 3 min (initial denaturation), followed by 35 cycles of 94 °C for 30 s, 59 °C for 45 s, and 72 °C for 1 min with a final extension step at 72 °C for 15 min. Negative controls without DNA were run in all amplifications. PCR products were purified using the GFX™ PCR DNA and Gel Band purification kit (GE Healthcare, Little Chalfont, Buckinghamshire, UK) after analysis by gel electrophoresis. After purification, 5 µL of amplification product (nearly 60 ng) were digested with the endonuclease HhaI (Invitrogen) in 15 μL reactions for 3 h at 37 °C. The digests were purified by sodium acetate/EDTA precipitation and then mixed with 0.25 μL of the Genescan 500 ROX size standard (Applied Biosystems) and 9.75 μL of deionized formamide. Prior to fragment analysis, samples were denatured at 95 °C for 5 min and chilled on ice. Analysis of terminal restriction fragment sizes and quantities was performed on an ABI PRISM 3100 genetic analyzer (Applied Biosystems). T-RFLP profiles were analyzed using PeakScanner v1.0 software (Applied Biosystems, Foster City, CA, USA). Terminal restriction fragments (T-RFs) smaller than 50 bp and larger than 800 bp were excluded from the analysis to avoid detection of primers and uncertainties of size determination. True peaks were determined using T-REX online software [20]. T-RF sizes were rounded to the nearest integer and peak heights were normalized to account for uncontrolled differences in the quantity of DNA between samples. The relative abundance of a single T-RF was calculated as percent fluorescence intensity relative to total fluorescence intensity of the peaks [21]. Diversity measurements (richness and Shannon index) were calculated based on T-RF abundance matrix and statistical analyzes of data were performed using One-way ANOVA based on Tukey’s test to determine the significance of differences between samples, using the software PAST [22]. Data from individual samples were subjected to multivariate analysis using the software Canoco 4.5 (Biometris, Wageningen, The Netherlands) and Primer6 (PrimerE, Ivybridge, UK) to determine the correlation between community structure and sediment physicochemical properties. All matrices were initially analyzed using de-trended correspondence analysis (DCA) to evaluate the gradient size of the species distribution; this analysis indicated linearly distributed data (length of gradient < 3), revealing that the best-fit mathematical model for the data was redundancy analysis (RDA). Forward selection (FS) and the Monte Carlo permutation test were applied with 1000 random permutations to verify the significance of sediment physicochemical properties upon a microbial community. In addition to p values for the significance of each soil chemical property, RDA and Monte Carlo permutation tests supplied information about the marginal effects of environmental variables, quantifying the amount of variance explained by each factor. 2.4. Pyrosequencing Analysis of the Bacterial 16S rRNA Gene To assess the composition of bacterial communities in mangrove sediments, samples from 10 cm and 40 cm depths were submitted to pyrosequencing analysis. The samples from points 1 to 3 were pooled and we consider for sequencing only the different depths of 10 cm and 40 cm. A partial V4 region of the bacterial 16S rRNA gene was amplified using the primer set 5' AYTGGGYDTAAAGNG 3' and 5' TACCRGGGTHTCTAATCC 3' containing specific Roche 454-pyrosequencing adaptors and barcodes of 8 bp [23]. PCRs contained 1X reaction buffer, 1.8 mM·MgCl2, 0.2 mM of each dNTP, 0.2 μM of each primer (Integrate DNA Technology), 10 mg·mL−1 of BSA, 4 ng·μL−1 of template, and 1 unit
Diversity 2014, 6
831
of FastStart High Fidelity PCR system enzyme blend (Roche Applied Science, Indianapolis, IN, USA) adding to 50 μL. Amplifications were performed using the following cycle parameters: 95 °C for 3 min (initial denaturation), followed by 30 cycles of 95 °C for 40 s, 57 °C for 45 s, and 72 °C for 1 min with a final extension step at 72 °C for 4 min. The PCR products were separated by gel electrophoresis, and fragments with size in the range of 270–300 bp were excised from the gel and extracted by using the Qiagen Gel Extraction Kit (Qiagen, Valencia, CA, USA). Further purification was performed with Qiagen PCR Purification Kit (Qiagen, Valencia, CA, USA). Sequencing was performed using a GS FLX sequencer (454 Life Sciences) at the Michigan State University Research Technology Support Facility using Titanium chemistry. Raw sequences were processed through the Ribosomal Database Project (RDP) pyrosequencing pipeline (http://pyro.cme.msu.edu). Within this tool the following analysis was performed, base calling, barcode sorting, primer trimming, chimera detection, and removal of bad quality sequences. The sequences obtained as described above were checked for presence of chimeras using the Greengenes chimera-check tool [24]. The remaining sequences were then analyzed using the Mothur software [25] based on a cut-off of 97% similarity, in order to identify operational taxonomic units (OTUs), measure diversity indices, generate rarefaction curves and Venn diagrams and to test significant difference between samples using the Libshuff test [26]. The sequence data generated by 454-pyrosequencing are available on the MG-RAST server (http://metagenomics.anl.gov) under the project “Bacterial Mangrove Profile” (ID 10820) and accession number 4481551.3 and 4481552.3 for 10 and 40 cm depths, respectively. 3. Results and Discussion The aim of this study was to assess the bacterial community structure and composition in sediments of Brazilian mangrove at different points and depths. Previous studies have shown the high microbial diversity in these environments, indicating that they might play an important role in nutrient cycling [8–11,14,27]. However, considering that mangrove ecosystems are very dynamic, in this study we took into account different points and depths. The sediment samples collected at the mangrove site were subjected to physical and chemical analyzes, and some factors were different according to the point or depth. The Table 1A shows the result of pH, OM and nutrients analyzed according to the depth for each sampling point. The Table 1B shows the result of carbon, nitrogen and sulfur content, and physical characteristics measured only for the different points in the mangrove, regardless the depth. The overall trend for the observed parameters was decrease over the vertical profile. Regarding to the points of sampling, the soil texture, carbon, conductivity and salinity were different between points. Environmental factors as salinity and nutrient availability are very variable and influenced by periodic tidal flood [28,29]. Bacterial communities are very responsive to this constant change in environmental conditions in order to adapt and maintain the ecosystem functioning [29]. Our data point to the importance of considering differences in mangrove ecosystem in microbial ecology studies.
Diversity 2014, 6
832 Table 1. Physicochemical properties of mangrove sediments sampled at different (A) depths and (B) points. Point 1 A
Point 2
Point 3
10 cm
20 cm
30 cm
40 cm
10 cm
20 cm
30 cm
40 cm
10 cm
20 cm
30 cm
40 cm
6.1 94 12 2.3 49 55 0.1 0.2 281 2.92 0.6
6.6 124 8 1.7 47 55 0.05 0.07 59.1 1.08 0.05
6.6 88 7 1.7 43 51 0.04 0.06 55.1 0.96 0.06
5.7 40 3 1.1 21 38 0.02 0.02 53 0.96 0.06
6.3 122 6 2.6 45 18 0.1 0.19 260 1.98 0.6
6.7 91 8 2.1 49 15 0.06 0.08 53.2 1.00 0.06
6.5 100 7 1.8 29 15 0.05 0.06 40.1 0.80 0.06
5.7 54 4 1.4 18 18 0.01 0.02 47.8 0.91 0.05
5.4 51 2 1.1 16 20 0.12 0.2 280 2.40 0.5
6.4 98 6 1.8 37 15 0.05 0.07 70.3 1.10 0.05
6.1 109 4 1.8 28 18 0.05 0.06 59.8 0.85 0.04
6.2 46 3 1.4 19 13 0.02 0.01 54 0.70 0.05
B
Point 1
Point 2
Point 3
Sand (%) Silt (%) Clay (%) Temperature (°C) Humidity (%) Total carbon (%) Organic carbon (%) Total nitrogen (%) Total sulphur (%) Condutivity (mS) Salinity (%)
22 26 52 12.5 69.9 13.9 12.2 0.7 0.2 20.8 1.3
82 6 12 13.3 40.8 5.1 3.0 0.2 0.1 11.4 0.7
78 12 10 13.7 49.2 7.0 3.5 0.2 0.1 3.5 0.2
pH (CaCl2) OM (g·dm−3) P (mg·dm−3) K (mmol·dm−3) Ca (mmol·dm−3) Mg (mmol·dm−3) B (mg·dm−3) Cu (mg·dm−3) Fe (mg·dm−3) Mn (mg·dm−3) Zn (mg·dm−3)
Diversity 2014, 6
833
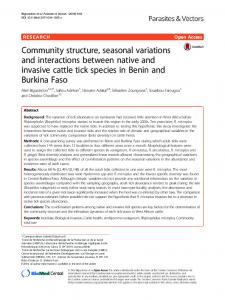
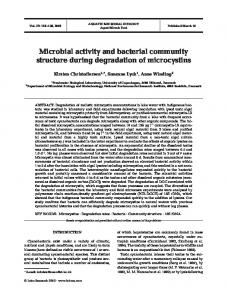
According to T-RFLP patterns, the bacterial community structure was different among samples, and the difference was larger between depths than points. Redundancy analysis showed that the observed variation between community structure was correlated with sediment attributes and environmental variations, such as conductivity, pH, point, potassium content and depth, the last two being the most significant (Figure 1 and Table 2). Several studies support that pH and attributes related to soil acidity are the best predictors of the richness and diversity of microbial communities in soils [30–33]. In our work, the pH showed significant difference between 10 and 40 cm depth, which may contribute to the difference found in bacterial structure. The K was the nutrient that most correlated to the variation in the community structure. Soil microorganisms have been reported to play a key role in the K cycle, and the potassium solubilizing bacteria are important to make potassium available for uptake by plants [34]. One of the best-known groups of potassium solubilizing bacteria is Bacillus, which belongs to the class Bacilli of the phylum Firmicutes [35,36]. Interestingly, our samples presented a clear variation in the abundance of sequences of the class Bacilli according to the depth. From the total sequences of Firmicutes, 2% and 47% belong to the class Bacilli for the samples from 10 cm and 40 cm depths, respectively. Interestingly, according to the chemical analysis, the sample from 40 cm presented low amount of K. Studies on long-term fertilization showed that microbial community responds to alteration in K content [37,38]. Together with K, the factor “depth” is significantly correlated to the bacterial community structure (p < 0.05). Although the Shannon diversity did not presented difference (p > 0.05), the richness was significantly different between 10 and 40 cm depth (p < 0.05), with shallow samples presenting higher number of T-RFs (Figure 2). In a previous study, Mendes et al. [11] showed that archaeal communities in mangrove are different at different depths, and the shallow samples presented higher diversity. In a study with methanogenic Archaea in mangrove, Taketani et al. [14] show a decrease in the richness of species belonging to the phylum Euryarchaeota with increasing depth. In both studies cited above, they correlate these differences to the decrease of OM according to the depth. In our study, other factors than OM also decreased with the increased depth, such as K, Mg and Fe (Table 1). This variation of nutrients may explain the significant difference between 10 and 40 cm depths. Along with our findings, several studies have also demonstrated that the microbial structure responds to different depths in soils [39–42]. Table 2. Statistical significance of environmental variable determined by multivariate analysis based on the redundancy methodology (RDA). Variable K Depth Conductivity Point pH
Lambda1 0.25 0.22 0.16 0.03 0.01
p Value 0.044 0.035 0.064 0.474 0.967
Values in bold are statistically significant factors that modulate the composition of bacterial communities according to Monte Carlo permutation test (p < 0.05).
Diversity 2014, 6 Figure 1. Redundancy analysis (RDA) performed on T-RFLP patterns obtained for the bacterial 16S rRNA gene and environmental characteristics of the mangrove sediment. Arrows indicate correlation between the chemical parameters and sample community structure. The significance of these correlations was evaluated by the Monte Carlo permutation test and is indicated as follows: * p < 0.05 (see also Table 2). The number below the symbols indicates the point of sampling.
Figure 2. Boxplots of the Shannon’s index and richness of observed T-RFs for mangrove bacterial communities in four depths. Center lines show the medians; box limits indicates the 25th and 75th percentiles as determined by R software; whiskers extend 1.5 times the interquartile range from the 25th and 75th percentiles. Significant differences among sediment depths are indicated by different letters according to the performed ANOVA and Tukey HSD test (p < 0.05).
834
Diversity 2014, 6
835 Figure 2. Cont.
The T-RFLP analysis indicated significant variation of bacterial community according to depth, therefor to further investigate the bacterial composition in mangrove sediment at different depths, we applied 454 pyrosequencing of the V4 hypervariable region of the 16S rRNA gene for samples from 10 cm and 40 cm depths. In this study, the description of bacterial communities using a culture-independent approach enable an overview of the groups inhabiting each depth of mangrove. The number of sequence reads obtained for each sampling was 6382 and 7117 sequences for 10 cm and 40 cm depths, respectively (Table 3). Statistical analyses were applied to evaluate species richness, the number of OTUs, and the difference occurring between the communities from the two different depths. The OTU were defined at a cut-off of 97% sequence similarity, a commonly recognized level for comparative analysis of 16S rRNA gene [43]. Confirming the results provided by T-RFLP analysis, differences between depths within the mangrove were detected by the richness of species and Chao1 richness estimator, where shallow samples presented higher number of OTUs (Table 3). In addition, the 454 sequencing showed that 10 cm depth presented higher diversity as shown by Shannon index (Table 3). This result is supported by the rarefaction curves (Figure 3), which indicated that 40 cm sampling requires fewer sequences to ensure comprehensive sampling effort at this depth compared to 10 cm sample. This rarefaction trend is an indicative of the diversity present in shallow layer of mangroves, higher than in the deeper layers. Despite the rarefaction curves have shown differences between depths, the curve did not achieve the plateau, revealed that this result should be viewed as an underestimation of the total diversity due the amount of sequences sampled [44]. Figure 4 shows the Venn diagram based on the 16S rRNA sequences from both mangrove depths. The sequences were separated into bins based on 0.03 cutoff dissimilarity, using Mothur to highlight the number of OTUs shared between samples. The number of shared sequences between depths was