Kovove Mater. 47 2009 381–387
381
Variations of microhardness with the solidification processing parameters and thermo-electrical properties with the temperature in the Sn-Cu alloy E. C ¸ adırlı1 , U. B¨oy¨ uk2 , S. Engin3 , H. Kaya2 , N. Mara¸slı4∗ 1 Ni˘gde University, Faculty of Arts and Sciences, Department of Physics, 51240, Ni˘gde, Turkey Erciyes University, Faculty of Education, Department of Science Education, 38039, Kayseri, Turkey 3 Erciyes University, Institute of Science and Technology, Department of Physics, 38039, Kayseri, Turkey 4 Erciyes University, Faculty of Arts and Sciences, Department of Physics, 38039, Kayseri, Turkey 2
Received 31 July 2009, received in revised form 5 October 2009, accepted 5 October 2009 Abstract Sn-1.2wt.%Cu eutectic alloy was directionally solidified upward with different growth rates (2.78–136.36 µm s−1 ) at a constant temperature gradient (2.69 K mm−1 ) and with different temperature gradients (2.69–8.88 K mm−1 ) at a constant growth rate (6.80 µm s−1 ) in the Bridgman-type growth apparatus. The measurements of microhardness of directionally solidified samples were obtained by using a microhardness test device. The dependence of microhardness HV on the growth rate (V ) and temperature gradient (G) were analysed. According to these results, it has been found that with the increasing values of V and G, the values of HV increase. Variations of electrical resistivity (ρ) and electrical conductivity (σ) for Sn-1.2wt.%Cu cast alloy with the temperature in the range of 300–500 K were also measured by using a standard d.c. four-point probe technique. The variation of Lorenz coefficient with the temperature for Sn-1.2wt.%Cu eutectic alloy was determined by using the measured values of electrical conductivity and thermal conductivity. The enthalpy of fusion for the same alloy was determined by means of differential scanning calorimeter (DSC) from heating trace during the transformation from eutectic liquid to eutectic solid. K e y w o r d s : eutectic solidification, soldering, hardness, electrical resistivity/conductivity
1. Introduction Eutectic alloys have relatively low melting points, excellent fluidity and good physical properties. The fibrous, lamellar or rod eutectic microstructure requires simultaneous growth of α and β solid phases and this is possible if diffusion in liquid is in the direction of growth. Eutectic alloys are the basis of many engineering materials [1–4]. This has led to an extensive theoretical and experimental study of the relationship among microstructure, physical properties and solidification processing parameters [5–13]. Many efforts were paid to develop Sn-rich, Pb-free solder, and this work is one of them. Directionally solidified Sn-Cu eutectic alloy can be a suitable candidate for replacement of Pb-Sn solder due to its convenient mechanical and thermo-electrical properties [14–
16], and relatively low cost, however, it needs more study. Thus the aims of present work were to study the dependence of microhardness on the solidification processing parameters (V and G) for directionally solidified Sn-Cu alloy at the eutectic composition and the variations of some thermo-electrical properties of Sn-1.2wt.%Cu cast alloy with the temperature in the range of 300–500 K.
2. Experimental procedure 2.1. S a m p l e p r e p a r a t i o n a n d solidification Using the vacuum melting and hot filling furnaces, Sn-1.2wt.%Cu alloy has been prepared under a va-
*Corresponding author: tel.: +90 352 437 4901 # 33114; fax: +90 352 437 49 33; e-mail address:
[email protected]
E. C ¸ adırlı et al. / Kovove Mater. 47 2009 381–387
382
cuum atmosphere by using 99.99 pure tin and 99.99 pure copper. After allowing time for melt homogenisation, the molten alloy was poured into 10 graphite crucibles (250 mm in length, 4 mm ID and 6.35 mm OD) held in a specially constructed hot filling furnace at approximately 50 K above the melting point of alloy. The molten metal was then directionally solidified from bottom to top to ensure that the crucible was completely full. Then, each sample was positioned in a Bridgman type furnace in a graphite cylinder (300 mm in length 10 mm ID and 40 mm OD). The details of the apparatus and experimental procedures are given in [17–21]. Unidirectional solidification of the samples with a moderate thermal gradient, which is between 2.69 K mm−1 and 8.88 K mm−1 , is performed with a maximum furnace temperature of 1300 K. In the experimental technique, the sample was heated about 50–200 K above the melting temperature and the sample was then grown by pulling it downwards by means of different speeded synchronous motors after the stabilizing the thermal conditions in the furnace under an argon atmosphere. After 10–12 cm steady state growth, the samples were quenched by rapidly pulling it down into the water reservoir. The melting point of Sn-1.2wt.%Cu alloy is about 500 K. Thus, the temperature of water in the reservoir was kept at 283 K to an accuracy of ±0.1 K using a Poly Sci-
ence digital 9102 model heating/refrigerating circulating bath to get well quenched solid-liquid interface in the present work. The temperature on the sample was also controlled to an accuracy of ±0.1 K agree with a Eurotherm 2604 type controller. Solidification of the samples was carried out with different growth rates (V = 2.78–136.36 µm s−1 ) at a constant temperature gradient (G = 2.69 K mm−1 ) and with different temperature gradients (G = 2.69–8.88 K mm−1 ) at a constant growth rate (V = 6.80 µm s−1 ). 2.2. M e a s u r e m e n t o f g r o w t h r a t e (V ) a n d t e m p e r a t u r e g r a d i e n t (G) The temperature in the specimen was measured with K-type 0.25 mm in diameter insulated three thermocouples which were fixed within the sample with spacing of 10–20 mm. In the present work, a 1.2 mm OD × 0.8 mm ID alumina tube was used to insulate the thermocouples from the melt. All the thermocouple ends were then connected to measurement unit consisting of data-logger and computer. The cooling rates were recorded with a data-logger via computer during the growth. When the solid/liquid interface was at the second thermocouple, the temperature difference between the first and second thermocouples (∆T ) was read from data-logger record. The time taken for the solid-liquid interface to pass the
T a b l e 1. Solidification processing parameters and microhardness for directional solidified Sn-1.2wt.%Cu alloy and the relationships between the solidification processing parameters and microhardness Solidification parameters G (K mm−1 ) 2.69 3.42 4.29 5.46 6.83 8.88 2.69 2.69 2.69 2.69 2.69 2.69 Relationships HVT HVL HVT HVL
= k1 V 0.08 = k2 V 0.07 = k3 G0.11 = k4 G0.10
Microhardness
V (µm s−1 ) 6.82 6.81 6.85 6.84 6.80 6.83 2.78 6.80 15.08 31.88 66.66 136.36
HVT (kg mm−2 ) 10.88 11.12 11.50 11.65 12.01 12.43 10.78 10.88 11.86 12.70 13.04 13.85
± ± ± ± ± ± ± ± ± ± ± ±
Regression constant k k1 k2 k3 k4
= = = =
15.81 (kg mm−2.08 s0.08 ) 14.39 (kg mm−12.07 s0.07 ) 9.75 (kg mm−11.89 K−10.11 ) 8.99 (kg mm−11.90 K−10.10 )
0.67 0.54 0.64 0.51 0.64 0.46 0.51 0.67 0.43 0.47 0.61 0.56
HVL (kg mm−2 ) 9.86 10.34 10.43 10.66 11.06 11.17 9.66 9.86 11.09 11.55 11.73 12.53
± ± ± ± ± ± ± ± ± ± ± ±
0.54 0.52 0.48 0.43 0.51 0.53 0.57 0.54 0.46 0.62 0.67 0.54
Correlation coefficient r r1 r2 r3 r4
HVT : The values of the microhardness obtained from the transverse section of the samples HVL : The values of the microhardness obtained from the longitudinal section of the samples
= = = =
0.982 0.974 0.994 0.978
E. C ¸ adırlı et al. / Kovove Mater. 47 2009 381–387
383
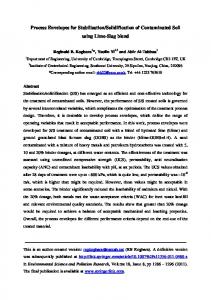
thermocouples separated by known distances was read from the data-logger record. Thus, the value of growth rate (V = ∆X/∆t ) for each sample was determined using the measured value of ∆t and known value of ∆X. The calculated values of V and G are given in Table 1. The temperature gradient (G = ∆T/∆X ) in the liquid phase for each sample was determined using the measured values of ∆T and ∆X. 2.3. M e t a l l o g r a p h i c e x a m i n a t i o n a n d the composition analyses of phases The quenched samples were removed from the graphite crucible and 3 cm in lengths from the top and bottom were cropped off and discarded. Then the rest of the samples were ground to observe the solid-liquid interface and the longitudinal section, which included the quenched interface, was separated from the specimen. This part was ground, polished and etched to reveal the quenched interface. Furthermore, the ground specimens were mounted in a cold-setting epoxy-resin. The longitudinal and transverse sections were wet ground down to grit 2500 and mechanically polished using 6 µm, 3 µm, 1 µm, and 1/4 µm diamond paste. Finally the specimens were etched with an acid solution (80 ml glycerine, 10 ml acetic acid and 10 ml nitric acid) to reveal the microstructure. After metallographic preparation, the microstructures were revealed. The microstructure was characterized from both transverse and longitudinal sections using a LEO scanning electron microscopy (SEM). Typical SEM images are shown in Fig. 1. As can be seen from Fig. 1, the microstructure consists of regular rod eutectic in the Sn-rich matrix. The solubility of Sn in Cu and Cu in Sn is about 1 wt.% and 0.006 wt.%, respectively, at the eutectic temperature [22]. The white phase is Cu6 Sn5 phase (Sn-39.61wt.%Cu) and the dark phase is pure Sn phase (Sn-100wt.%Sn). The composition of casting phase was also found to be Sn-1.24wt.%Cu. 2.4. T h e m e a s u r e m e n t o f m i c r o h a r d n e s s (H V) One of the purposes of this investigation was to obtain the relationships among solidification processing parameters (V and G) and microhardness (HV) for the directionally solidified Sn-1.2wt.%Cu alloy. The mechanical properties of any solidified materials are usually determined with hardness test, tensile test, etc. Since true tensile strength testing of solidified alloys gave inconsistent results with a wide scatter due to the strong dependence on solidified sample surface quality, mechanical properties were monitored by hardness testing, which is one of the easiest and most straightforward techniques. Microhardness measurements in this work were made with a Future-Tech FM-700 model hard-
Fig. 1. Typical SEM images; the white phase is Cu6 Sn5 phase (Sn-39.61wt.%Cu), the dark phase is pure Sn phase: (a) longitudinal section, (b) transverse section.
ness measuring test device using a (10–50) g load and a dwell time of 10 s giving a typical indentation depth about 40–60 µm, which is significantly smaller than the original solidified samples. The microhardness was the average of at least 30 measurements on the transverse sections, HVT , and the longitudinal sections, HVL . The measured values of G, V and HV are also given in Table 1 and the variations of microhardness with the solidification processing parameters are plotted in Fig. 2. 2.5. T h e m e a s u r e m e n t o f e l e c t r i c a l resistivity and electrical conductivity The temperature dependence of the electrical resistivity (ρ) and electrical conductivity (σ) for cast Sn-1.2wt.%Cu alloy were measured by the d.c. four-point probe method [23]. The four-point probe method is the most widely used technique for electrical profile measurement of materials. The method
E. C ¸ adırlı et al. / Kovove Mater. 47 2009 381–387
384
Fig. 2. Variation of the microhardness with (a) the growth rate, (b) the temperature gradient.
Fig. 3. Temperature dependency of (a) the electrical resistivity of Sn-Cu eutectic cast alloy and (b) of the electrical conductivity of cast Sn-Cu eutectic.
has proven to be a convenient tool for the resistivity measurement. A four-point probe measurement is performed by making four electrical contacts to a sample surface. The specimen thickness and width were measured to an accuracy of 1 µm using a digital micrometer. The resistance data were converted to resistivity values with the measured specimen dimensions. The details of the measuring method have been described elsewhere [24]. The electrical resistivity strongly depends on temperature. In metals, electrical resistivity increases with increasing temperature. The temperature coefficient of resistivity is often expressed as a slope in the electrical resistivity and conductivity versus temperature graph and can be given as
The temperature dependences of the electrical resistivity, ρ, and the electrical conductivity, σ, were determined in the temperature interval 300–500 K and the data are plotted in Fig. 3a,b. Figure 3a shows that the resistivity increases linearly with the increasing temperature of cast Sn-1.2wt.%Cu. Figure 3b shows the temperature dependence of the electrical conductivity for the same alloy. The electrical conductivity of sample is inversely proportional to temperature.
α=
1 ∆ρ ρ − ρS0 = , ρS0 (T − T0 ) ρS0 ∆T
(1)
where ρ is the electrical resistivity at the temperature T, ρS0 is the electrical resistivity at the room temperature, T0 = 300 K and α is the temperature coefficient of electrical resistivity.
2.6. D e t e r m i n a t i o n o f e n t h a l p y a n d sp ecific heat The enthalpy of fusion (∆H ) and specific heat (Cp ) were measured because they are very important parameters for industrial applications. The DSC (Perkin Elmer Diamond model) thermal analysis was performed in the temperature range of 300–600 K with a heating rate of 10 K min−1 and under a constant stream of nitrogen at atmospheric pressure. The DSC curve obtained for Sn-1.2wt.%Cu eutectic alloy is shown in Fig. 4. It is clear that sharp peak is observed for melting process as shown in Fig. 4. The enthalpy of fusion (∆H ) and specific heat (Cp ) were
E. C ¸ adırlı et al. / Kovove Mater. 47 2009 381–387
Fig. 4. Heat flow curve versus the temperature for Sn1.2wt.%Cu alloy at a heating rate of 10 K min−1 .
calculated as the area under the peak by numerical integration.
3. Results and discussion 3.1. E f f e c t o f t h e g r o w t h r a t e a n d temp erature gradient on the microhardness As can be seen from Table 1 and Fig. 2, the dependence of HV on the V and G can be represented by equations as follows: HV = kV a ,
(2)
HV = kGb ,
(3)
where k is a constant, a and b are the exponent values relating to the growth rate and temperature gradient, respectively. Figure 2a shows the variation of HV as a function of V with a constant G. HV increases with the increasing V. The exponent values relating to the growth rate for the transverse and longitudinal sections are found to be 0.08 and 0.07, respectively. The exponent values relating to growth rate obtained in this study are very close to 0.07, 0.08 and 0.10 obtained by Vnuk et al. [25, 26], Telli and Kısak¨ urek [27] for different eutectic alloy systems, in respectively similar solidification conditions. The exponent values relating to the temperature gradient for the transverse and longitudinal sections are also found to be 0.11 and 0.10, respectively. The average value of the exponent relating to growth rate is equal to 0.08 for Sn-1.2wt.%Cu alloy. As can be seen from Table 1 and Fig. 2b, the microhardness values increase with the increasing G for a given constant V as well. The average value of the exponent relating to G is equal to 0.11 for Sn-1.2wt.%Cu
385
Fig. 5. Thermal conductivity of solid Sn-1.2wt.%Cu alloy versus temperature [31].
alloy. This exponent value relating to G obtained in present work is generally in a good agreement with the exponent values relating to the G obtained in previous experimental works [28, 29]. 3.2. E l e c t r i c a l p r o p e r t i e s o f S n - 1 . 2 w t .% C u a l l o y As mentioned above, the variation of electrical resistivity (ρ) with the temperature in the range of 300–500 K for Sn-1.2wt.%Cu alloy were measured and plotted as shown in Fig. 3a. As can be seen from Fig. 3a, the values of ρ were found to be in the range of 15.5 × 10⁻⁶ –36 × 10−6 Ω cm. Figure 3a shows that the resistivity increases linearly with the increasing temperature. The values of ρ are very close to data obtained by Ashram and Shalaby [14] and Kamal and Ashram [30] for the same alloy system. The temperature coefficient of electrical resistivity for Sn-1.2wt.%Cu alloy was determined to be 7.23 × 10⁻³ K−1 from the graph of electrical resistivity variation versus temperature. As can be also seen from Fig. 3b, the values of σ are inversely proportional to temperature and found to be in the range of 64 × 103 –28 × 103 Ω−1 cm−1 . 3.3. V a r i a t i o n s o f L o r e n z n u m b e r w i t h t e m p e r a t u r e f o r S n - 1 . 2 w t .% C u a l l o y Variation of thermal conductivity (KS ) of solid phase for Sn-1.2wt.%Cu alloy in respect of temperature was measured by Kaygısız et al. [31] and is shown in Fig. 5. The thermal conductivity values are slightly decreasing with increasing temperature in the range 300–500 K. The value of KS for Sn-1.2wt.%Cu alloy at the eutectic melting temperature was obtained to be 74.91 W K−1 m−1 by extrapolating to the eutectic temperature [31].
E. C ¸ adırlı et al. / Kovove Mater. 47 2009 381–387
386
Fig. 6. The values of K/σ versus the temperature.
T a b l e 2. The values of Lorenz number as a function of temperature for Sn-1.2wt.%Cu alloy Temperature T (K)
Lorenz number (× 10−18 ) L (W Ω K −2 )
323 363 403 443 493
2.68 2.98 3.32 3.56 3.56
4. Conclusions
The electrical conductivity is a measure of a material’s ability to conduct an electric current and one of the physical properties of materials such as thermal conductivity, specific heat and thermal expansion. The relationship between the thermal conductivity and the electrical conductivity is established by the Wiedemann-Franz law, which is based upon the fact that heat and electrical transport both involve the free electrons in the metal as K = LT, σ
in Table 2. The results also show that the Lorenz number slightly increases with the increasing temperature. So the experimental results slightly deviate from the Wiedemann-Franz law. This discrepancy can be interpreted that some other mechanisms, such as electron-electron interaction, phonon-phonon interaction, grain boundary/impurity scattering etc. involve to the thermal conduction process. The molten Sn-1.2wt.%Cu alloy was heated with a heating rate of 10 K min−1 from room temperature to 560 K by using a Perkin Elmer Diamond model DCS and the heat flow versus temperature for Sn1.2wt.%Cu alloy is given in Fig. 4. As can be seen from Fig. 4, the melting temperature of Sn-1.2wt.%Cu alloy was detected to be 499.43 K. The values of the enthalpy of fusion (∆H) and the specific heat (Cp ) for Sn-1.2wt.%Cu alloy were also calculated to be 53.43 J g−1 , and 0.236 J g−1 K−1 , respectively, from the graph of the heat flow versus temperature. Resulting values of ∆H and Cp are in a good agreement with the values of ∆H and Cp obtained by Ashram and Shalaby [14] for the same alloy.
(4)
where K is thermal conductivity, σ is electrical conductivity, T is absolute temperature and L is the constant of proportionality (2.45 × 10⁻⁸ W Ω K−2 ), which is called the Lorenz number [32]. The ratios of the thermal conductivity to the electrical conductivity for Sn-1.2wt.%Cu alloy as a function of temperature were determined from Figs. 3 and 5. The ratio of the thermal conductivity to the electrical conductivity versus the temperature was also plotted and given in Fig. 6. The values of Lorenz number as a function of temperature for Sn-1.2wt.%Cu alloy were determined from Eq. (4) as a function of temperature and are given
It was found that the values of microhardness (HV) for directionally solidified Sn-1.2wt.%Cu alloy increase with increasing of the values V and G. The exponent values relating to the growth rate and the temperature gradient obtained in present work agree very well with the exponent values relating to the growth rate and temperature gradient obtained in previous works [28, 29]. The electrical resistivity (ρ) of Sn-1.2wt.%Cu alloy increased with the temperature as the electrical conductivity (σ) of Sn-1.2wt.%Cu alloy decreased. Resulting values of ρ and σ for Sn-1.2wt.%Cu alloy are in a good agreement with the values of ρ and σ obtained by Ashram and Shalaby [14] and Kamal and Ashram [30] for the same alloy. Furthermore, the temperature coefficient of resistivity was determined to be 7.23 × 10⁻³ K−1 from the graph of electrical resistivity variation versus temperature. Variations of the Lorenz numbers with temperature for the same alloy were obtained from the experimental K/σ values as a function of the temperature. The values of Lorenz numbers slightly deviate from the Wiedemann-Franz law. Resulting values of ∆H = 53.43 J g−1 and Cp = 0.236 J g−1 K−1 for Sn-1.2wt.%Cu alloy are in a good agreement with the values of ∆H and Cp obtained by Ashram and Shalaby [14] for the same alloy. Acknowledgements The authors are grateful to the Scientific and Technical
E. C ¸ adırlı et al. / Kovove Mater. 47 2009 381–387 ˙ Research Council of Turkey (TUBITAK) for financial support under contract no. 107T095.
References [1] ELLIOTT, R.: Eutectic Solidification Processing Crystalline and Glassy Alloys. Guilford, UK, Butterworths 1983. [2] MCLEAN, M.: Directionally Solidified Materials for High Temperature Service. London, The Metal Society Book 1983. [3] STEFANESCU, D. M.—ABBASCHIAN, G. J.—BAYUZICK, R. J.: Solidification Processing of Eutectic Alloys. Ohio, American Society for Metals 1988. [4] FLEMINGS, M. C.: Solidification Processing. New York, Mc Graw Hill 1974. [5] LIU, J. M.—ZHOU, Y.—SHANG, B.: Acta Metall., 38, 1990, p. 1625. [6] LAPIN, J.—GABALCOVÁ, Z.—BAJANA, O.—DALOZ, D.: Kovove Mater., 44, 2006, p. 297. [7] LAPIN, J.—GABALCOVÁ, Z.: Kovove Mater., 46, 2008, p. 185. ¨ ¨ [8] C ¸ ADIRLI, E.—GUND UZ, M.: J. Mat. Proc. Tech., 97, 2000, p. 74. [9] ZHUANG, Y. X.—ZHANG, X. M.—ZHU, L. H.—HU, Z. Q.: Sci. Tech. Adv. Mat., 2, 2001, p. 37. [10] HUNT, J. D.: Sci. Tech. Adv. Mat., 2, 2001, p. 147. [11] CHEN, Y. J.—DAVIS, S. H.: Acta Metall., 50, 2002, p. 2269. [12] JACKSON, K. A.—HUNT, J. D.: Metall. Soc. A.I.M.E., 236, 1966, p. 1129. [13] TRIVEDI, R.—MAGNIN, P.—KURZ, W.: Acta Metall., 35, 1987, p. 971. [14] EL-ASHRAM, T.—SHALABY, R. M.: J. Electron. Mater., 34, 2005, p. 212. [15] SHALABY, R. M.: J. Mater. Sci.: Mater. Electron., 15, 2004, p. 205. [16] EL-ASHRAM, T.: J. Mater. Sci.: Mater. Electron., 16, 2005, p. 501.
387
¨ ¨ M.—KAYA, H.—C ¨ [17] GUND UZ, ¸ ADIRLI, E.—OZMEN, A.: Mat. Sci. Eng. A, 369, 2004, p. 215. ¨ ¨ M.: Mat. Res. [18] C ¸ ADIRLI, E.—KAYA, H.—GUND UZ, Bull., 38, 2003, p. 1457. ¨ ¨ [19] KAYA, H.—C ¸ ADIRLI, E.—GUND UZ, M.: J. Mat. Eng. and Perf., 12, 2003, p. 465. ¨ ¨ ¨ M.: Materi[20] C ¸ ADIRLI, E.—ULGEN, A.—GUND UZ, als Transactions (JIM), 40, 1999, p. 989. ¨ UK, ¨ [21] C ¸ ADIRLI, E.—BOY U.—KAYA, H.—MARAS ¸˙ ˘ LI, N.—KES ¸ LIOGLU, K.—AKBULUT, S.—OCAK, Y.: J. Alloys Comp., 470, 2009, p. 150. [22] HANSEN, M.—ANDERKO, K.: Constitutions of Binary Alloys. New York, McGraw-Hill 1958. [23] SMITHS, F. M.: The Bell Sys. Tech. J., 37, 1958, p. 711. ˙ B.—GUND ¨ ¨ [24] ARI, M.—SAATC ¸ I, UZ, M.—MEYDA˙ NERI, F.—BOZOKLU, M.: Mat. Characterization, 59, 2008, p. 624. [25] VNUK, F.—SAHOO, M.—VAN DE MERWE, R.— SMITH, R. W.: J. Mat. Sci., 14, 1979, p. 975. [26] VNUK, F.—SAHOO, M.—BARAGOR, D.—SMITH, R. W.: J. Mat. Sci., 15, 1980, p. 2573. ˙ ¨ [27] TELLI, A. I.—KISAK UREK, S. E.: Mat. Sci. and Tech., 4, 1988, p. 153. ¨ UK, ¨ [28] KAYA, H.—C ¸ ADIRLI, E.—BOY U.—MARAS ¸LI, N.: Applied Surface Science, 255, 2008, p. 3071. ¨ UK, ¨ [29] KAYA, H.—BOY U.—C ¸ ADIRLI, E.—OCAK, ˙ GLU, ˘ Y.—AKBULUT, S.—KES ¸ LIO K.—MARAS ¸ LI, N.: Met. Mater. Int., 14, 2008, p. 575. [30] KAMAL, M.—EL ASHRAM, T.: Mat. Sci. Eng. A, 456, 2007, p. 1. [31] KAYGISIZ, Y.—OCAK, Y.—AKBULUT, S.—KES ¸˙ GLU, ˘ LIO K.—MARAS ¸ LI, N.—C ¸ ADIRLI, E.— KAYA, H.: Chemical Physics Letters, 2009, accepted for publication. [32] KITTEL, C.: Introduction to Solid State Physics. 6th Ed. New York, John Wiley and Sons 1965.