Available online at www.sciencedirect.com
ScienceDirect Energy Procedia 39 (2013) 258 – 266
Asian Nuclear Prospects 2012 (ANUP2012)
Various Bypass Flow Paths and Bypass Flow Ratios in HTR-PM Sun Jun*, Zheng Yanhua, Li Fu Institute of Nuclear and New Energy Technology, Tsinghua University, Beijing 100084, China
Abstract In HTR-PM, gaps between graphite and carbon blocks are widely distributed in the reactor core. The cold helium flows may be bypassed and not completely heated, therefore, the accurate prediction of bypass flows is a key problem related to the reactor safety. The flow network method was employed to represent interconnected bypass flow paths and calculate the bypass flow rates. Bypass paths in irregular shapes were simulated by CFD to get local and friction resistances. Typical bypass flow paths, included flow through sealing ring to the pebble discharge tube, flow through small holes to the control rod channels and flow through vertical gaps to the hot plenum, were modeled to calculate corresponding bypass flow rates. Large gaps, where might induce high flow rates at two ends of the bypass paths, should receive more concerns.
© 20xx The Authors. Published by Elsevier Ltd. CC BY-NC-ND license. © 2013 Theand/or Authors. Published byunder Elsevier Ltd. Open access Selection peer-review responsibility of under Institute of Nuclear and New Energy Technology, Selection and peer-review under responsibility of Institute of Nuclear and New Energy Technology, Tsinghua University Tsinghua University Keywords: HTR-PM; gap; bypass flow; flow network, CFD
1. Introduction Characterised with inherent safety and many potential industry applications, the HTR-PM (High Temperature Reactor Pebble bed Module) is one of the advanced and promising reactors in progress [1]. Taken the helium gas as the coolant, the inlet and outlet helium temperatures are designed as 250 and 750 with the helium flow rate at 96 kg/s in full power condition. Filled with hundreds thousands of spherical fuel elements in the pebble bed, the HTR-PM reactor core is mainly constructed with ceramic
* Corresponding author. Tel.: +86-10-6278-4826; fax: +86-10-6277-1150. E-mail address:
[email protected].
1876-6102 © 2013 The Authors. Published by Elsevier Ltd. Open access under CC BY-NC-ND license.
Selection and peer-review under responsibility of Institute of Nuclear and New Energy Technology, Tsinghua University
doi:10.1016/j.egypro.2013.07.212
Sun Jun et al. / Energy Procedia 39 (2013) 258 – 266
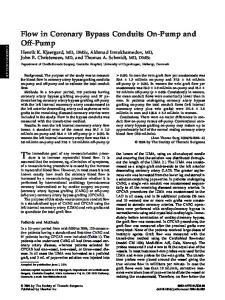
materials. Large amount of graphite blocks are served as the neutron reflectors and the structure materials, where the helium flow channels are also shaped and formed inside. According to the flow directions demonstrated in Fig. 1, the helium gas at low temperature from the blower will flow upward in the coolant rising channels and mix in the cold plenum, then flow downward through the pebble bed and finally converge into the hot plenum before the heat exchange in the steam generator. A majority of the helium flows are fully heated in the pebble to reach high enough temperatures, meanwhile, a small part get through gaps among graphite blocks in neutron reflectors. These minority flows are not heated sufficiently by the pebbles and become varieties of bypass flows at lower temperature levels. The exact prediction of the bypass flows in HTR-PM is a key issue to the reactor safety. Since the total helium flow rate is determined in reactor physics and thermal hydraulic designs, more bypass flows would induce less main flow through the pebble bed, resulting in higher maximum fuel temperature and sooner fission product diffusion out of fuel pebbles. Therefore, the bypass flows should be paid higher attention and be well understood in order to be controlled strictly to the reactor design. In this paper, various bypass flow paths were introduced according the HTR-PM structure design. Following that, the flow networks were established to predict bypass flow rates with aid of graphic user interface simulation platform and computational fluid mechanics (CFD) tools. Preliminary results were given and discussed for better understanding the positions, amount and importance of the bypass flows. Future works were also described at last.
Fig. 1. Longitudinal section of the HTR-PM structure [2] (1) reactor core (2) side reflector and carbon thermal shield (3) core barrel (4) reactor pressure vessel (5) steam generator (6) steam generator vessel (7) coaxial gas duct (8) water-cooling panel (9) blower (10) fuel discharging tube
259
260
Sun Jun et al. / Energy Procedia 39 (2013) 258 – 266
Nomenclature A
cross section area of flow path (m2)
Cb
resistance parameter of flow path
D
characteristic size of flow path (m)
d
depth of vertical gaps (m)
f
local and friction resistance coefficient of flow path
g
gravitational acceleration (kg m s-2)
H
inlet and outlet height difference of flow path (m)
h
width of vertical gaps (m)
L
length of flow path (m)
l
length of vertical gaps (m)
p
pressure of flow node (Pa)
Rb
resistance parameter of flow path
Re
Reynolds number
V
volume of flow node (m3)
w
mass flow rate of the of flow path (kg s-1)
Greek symbols density of flow node (kg m-3) time step (s) helium dynamic viscosity coefficient (Pa s) Superscripts con
sudden contraction
ex
sudden expansion
i, j, m, n number of flow node and flow path L
large flow area
S
small flow area
t
time
Sun Jun et al. / Energy Procedia 39 (2013) 258 – 266
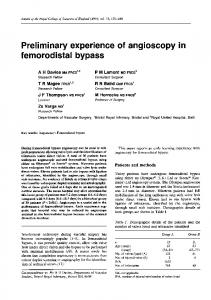
2. Various Bypass Flow Paths Due to the graphite block structures, bypass flows in high temperature reactors always exist. In HTR10 [3], the ratio of bypass flow to the total flow was estimated to be less than 14%. According to the preliminary safety analysis of the HTR-PM, the bypass flow ratio was about 6%, which is still under study. Two kinds of bypass flows in the HTR-PM are used for cooling, including the bypass flow through the sealing ring to the discharge tube and bypass flow in the control rod channels. The other widely distributed bypass flows among graphite blocks are more complicated. Seen from Fig. 1 in the bottom part of the reactor core, a small part of helium may flow from the bottom head of pressure vessel, through a sealing ring, and into the long tube of discharging pebbles. This part of bypass flow is controlled by the resistance of the sealing ring and used to cool the discharged pebbles before the fuel circulating. Many functional channels are shaped in graphite reflectors around the pebble bed, as shown in Fig. 2. The control rods are important power adjusting tools, which move inside the control rod channels in the side reflectors. A minority of helium in the cold plenum may flow into the control rod channels through small holes in graphite side reflectors around the cold plenum. This part of bypass flows is able to cool the control rods at relatively low temperature. Then, it flows out of these channels at the bottom and flows into the hot plenum. The amount of bypass flows in the control rod channels is mainly due to the pressure difference of cold plenum and hot plenum, as well as the resistances of the inlet and outlet holes in side reflectors. The most complicated bypass flows are flows through gaps among graphite blocks widely distributed in the reactor core. These gaps are small in size, interconnected, and may be in irregular shapes due to non-uniform thermal expansion and irradiation. One example of these bypass flows is from the cold plenum, through the vertical gaps, to the hot plenum, named P-P bypass flow, as shown in Fig. 2 and Fig. 3. From the cross section, the pebble bed is circled around with 30 graphite side reflectors, between two of which is a vertical gap in a few millimetres wide. Along the vertical gap, pressure difference between the pebble bed and gaps may induce horizontal (radial) flows. Since the horizontal pressure difference varies from top to bottom, different extent of horizontal flows may change the P-P bypass flow rates and have strong effect on the bypass predictions.
Fig. 2. Cross-section of the reactor core structure in HTR-PM
261
262
Sun Jun et al. / Energy Procedia 39 (2013) 258 – 266
Also in Fig. 2, many keys used for supporting the core structure are also possible bypass flow paths. Flows around these keys are induced by larger pressure difference and larger gaps between keys and graphite blocks. In the cold and hot plenums, which consist of large amount of graphite blocks and keys, the bypass flows are far more complicated.
Fig. 3. Schematic of P-P bypass flow and horizontal flow in a narrow gap around two graphite blocks
3. Methodology The bypass flows are coexisted with the main flow along with the core structure. The main flow is the majority and decides the pressure distribution in the reactor core. Since the bypass flows are basically due to the pressure distribution and local resistance of graphite structure, the bypass flows can only be predicted with the main flow and detailed core structure together. Thousands of graphite blocks make the number of bypass gaps also in thousands, so that the only practical method to predict the whole bypass flows is to build proper and complete flow network for the main flow and bypass flows [4]. The bypass flow problem can be solved in definitely three major steps: Recognizing the possible bypass flow paths; Clarifying the resistance of those bypass flow paths; Building proper flow network and solve the flow rate distributions. As in the first step, possible bypass flow paths are mainly from two impact factors: pressure difference and gaps. The interconnection of gaps and the connection to main flow are basis of building right flow network. In the previous section, various bypass flows were described. The detailed connections of gaps were demonstrated in the next section. The knowledge of flow resistance of various flow paths is necessary to quantitative prediction of bypass flows. Many gaps and their connections are regular so that the friction or local resistance can follow some empirical formula. For example, narrow gap with rectangular cross section obeys the turbulent friction resistance by f
L 0.3164 D Re0.25
(1)
In the bi-directional horizontal flows between the pebble bed and vertical flows, the resistances of sudden expansion and sudden contraction are
263
Sun Jun et al. / Energy Procedia 39 (2013) 258 – 266
f ex f con
0.5
2
1 AS AL 1
AS AL
(2) 2
(3)
However, the gaps are not always in regular shapes that the flow resistance of them cannot be predetermined, such as the sealing ring [4], small holes into the control rod channels and flow around keys. The common method is by aid of computational fluid dynamics (CFD), in which, the relation of pressure difference and flow rate through the bypass path is calculated. For example, the sealing ring was modeled to get the resistance coefficient as follows:
(a) three-dimension model
(b) two-dimension design figure
Fig. 4. Three-dimension and two-dimension models of the sealing ring (1/4)
f
60.1 Re 0.07
(4)
The small hole into the control rod channel was also modeled as shown in Fig. 5 and the resistance coefficient was fitted in Eq. (5).
Fig. 5. Three-dimension model of the small hole into the control rod channels
264
Sun Jun et al. / Energy Procedia 39 (2013) 258 – 266
f
22 Re 0.044
(5)
Based on the main flow and bypass flow connections and their flow resistance, the flow network can be built and solved at last. A brief flow process shown in Fig. 6 can be used to guide the flow network building in the HTR-PM reactor core, in which, various bypass flows are illustrated. Detailed flow network should be added with proper number of flow nodes, flow links and corresponding flow modules representing the flow paths’ resistance in the next section.
Fig. 6. Brief flow process in the HTR-PM with various bypass flows
In the method of flow network, three-dimension flow is discretised into combinations of flow nodes and one-dimension flow links. Flow nodes are divided into boundary nodes and inner nodes. Flow links are connecting two flow nodes, representing all the main flow and bypass flow paths with respect resistance. Different from the mass, momentum balance equations in three-dimension flow, the linearized pressure equation set of the flow network is much more simplified and formed by combining the mass balance equations of the flow nodes and the momentum balance equations of the flow links. The common form of the linearized pressure equation at the time (t+1) is m
n m
Rb,i i 1
Rb,m j 1
m
V j
p
pt t
n m
Rb,i pi ,t
1 i 1
1 j 1
Rb
m
Rb,m j pm
1 f w A2
n m
Cb,i
j ,t 1 i 1
Cb,m j 1
V j
p
pt t
(6)
(7)
265
Sun Jun et al. / Energy Procedia 39 (2013) 258 – 266
Cb
f 2
2 A
ww
gH
f w A2
(8)
The graphic modeling of the flow network is demonstrated on vPower simulation platform, which is developed by Beijing Neoswise Technology Company Limited. The modules adopted into the vPower, representing the flow nodes, flow links, and flow resistance, are further developed with the coolant and material properties, many empirical correlations, and operation parameters of the HTR-PM. When the modules are connected with respect to the flow directions and given boundary conditions, the equations of the flow network are formed and directly solved in vPower by some numerical methods to the large sparse matrix. 4. Flow network and preliminary results With the method determined in predicting the bypass flows, the last and important step is to build and solve the flow network including the main flow and bypass flows. Since the bypass flow through the discharging tube is in short and simple flow path, the pressure difference and flow resistance of which are both explicit. The bypass flow in the discharging tube can be easily calculated. As studied in previous research [4], the pressure loss of bypass flow through the discharging tube was caused by local resistance of sealing ring (follow Eq. (4)) and friction resistance of piled discharged pebbles (follow KTA rules[5]). For various operating conditions, the ratio of bypass flow in the discharging tube to the total flow in the primary loop was less than 2%. The bypass flow in the control rod channels can also be calculated similar to the bypass flow in the discharging tube. The bypass flow path in one control rod channel can be divided into four parts: small hole into the channel, channel with control rod inserted, channel without control rod inserted, and small hole out of the channel to the hot plenum. As the first part, the resistance of small hole into the channel was calculated by CFD and the local resistant coefficient followed Eq. (5). The second and third parts were regular annular and circular channels, the resistant coefficients of which both followed Eq. (1) with respect cross section areas. The lengths of the second and third channels also varied due to different depth of the control rod inserted into the control rod channel. As for the last part, its local resistance mainly from the area contraction and expansion before and after the small hole in the bottom graphite block. Since the pressure difference of the cold and hot plenum was determined with fixed total flow rate, the summary of bypass flows in 8 control rod channels was less than 1.5% for different control rod positions. As for bypass flows in variety of gaps among graphite blocks, things are much more complicated that the bypass flows must be modeled and calculated along with the main flow. Taken the P-P bypass flow as the example, the flow network was shown in Fig. 7 [6]. The main flow in pebble bed, the 30 bypass flows in vertical gaps from the cold plenum at the top to the hot plenum at the bottom were discretized into several flow nodes and flow paths. Horizontal flow between the pebble bed and gap bypass were also modeled in bi-directional flows. The P-P bypass flows were sensitive to the gap sizes and the gap size distributions. Larger gap meant less local resistance and might induce more horizontal flows around. Furthermore, the position of larger gap also affected the bypass flows that larger gap on the top or bottom had strong effect on the horizontal flow as well as the bypass flow ratio. If all the vertical gaps were smaller than 3.0mm in width (h in Fig. 3), the ratio of bypass flows in 30 vertical gaps to the total flow was less than 6.7%.
266
Sun Jun et al. / Energy Procedia 39 (2013) 258 – 266
Fig. 7. Flow network of the P-P bypass flow problems (1/30)
5. Conclusions Various bypass flow paths in HTR-PM were described and discussed due to the reactor structure in this paper. Three major steps were indicated and explained to predict the bypass flow rates, one of which was to build proper flow network. Some specific bypass flows were calculated with preliminary results including the bypass flows in discharging tube, control rod channels, and vertical gaps between side reflectors. In the future work, more complete and complicated flow network will be built to demonstrate more detailed gaps among graphite blocks in the reactor core. Acknowledgements This work has been supported by the National S&T Major Project (Grant No. ZX06901). The flow network was modelled and solved on the vPower simulation platform developed by Beijing Neoswise Technology Co. Ltd. References [1] Zhang Z, Wu Z, Wang D, Xu Y, Sun Y, Li F, et al. Current status and technical description of Chinese 2×250 MWth HTRPM demonstration plant. Nucl Eng Des 2009; 239 :1212-1219. [2] Zheng Y, Shi L. Reactivity accident in a high temperature gas-cooled reactor due to inadvertent withdrawal of control rod, J Eng Gas Turbines Power. 2011; 133: 052902. [3] Gao Z, Shi L. Thermal hydraulic calculation of the HTR-10 for the initial and equilibrium core, Nucl Eng Des. 2002; 218: 51-64. [4] Sun J, Zheng Y, Li F, Sui Z, Ma Y. Prediction of bypass flows in HTR-PM by the flow network method, 19th International Conference on Nuclear Engineering, Osaka, Japan; 2011. [5] KTA 3102.3, Reactor core design of high-temperature gas-cooled reactors part 3: loss of pressure through friction in pebble bed cores, Nuclear Safety Standards Commission (KTA), Federal Republic of Germany; 1981. [6] Sun J, Zheng Y, Li F, Researches of Bypass Flows from Cold Plenum to Hot Plenum in HTR-PM by the Flow Network Method, 20th International Conference on Nuclear Engineering, Anaheim, California, USA; 2012.