Abstruct4olor edge detection is approached in this paper using vector order statistics. Based on the R-ordering method, a clasis of color edge de- tectors is ...
IEEE TRANSACTIONS ON SYSTEMS, MAN, AND CYBERNE,TICS-PART B: CYBERNETICS, VOL. 26, NO. 1, FEBRUARY 1996
135
CorrespondenceVector Order Statistics Operators as Color Edge Detectors P. E. Trahanias and A. N. Venetsanopoulos
Abstruct4olor edge detection is approached in this paper using vector order statistics. Based on the R-ordering method, a clasis of color edge detectors is defined. These detectors function as vector operators as opposed to component-wise operators. Specific edge detectors can he obtained as special cases of this class. Various such detectors are defined and analyzed. Experimental results show the noise robustness of the vector order statistics operators. A quantitative evaluation aind comparison to other color edge detectors favors our approach. Edge detection results obtained from real color images demonstrate the efFectiveness of the proposed approach in real applications.
I. INTRODUCTION An edge is characterized in a monochrome image by an intensity discontinuity. This may correspond to object boundaries or to a change in some physical property, such as illumination (shadows) or reflectance (surface orientation). In the case of mulltispectral (color) images, color plays a significant role in the perception of boundaries between regions as it is indicated by psychological research on the human visual system [l], [2]. It follows that color information should also be considered in addition to the other physical properties in edge detection approaches for color images. However, this is implicitly not considered in color edge detection schemes where the edges are searched separately in different components of a color image (e.g. intensity, normalized red, normalized green [3]) or in a component that results as a combination of some other components (e.g. brightness [4]). More surprisingly, research in the problem of color edge detection seems to have been neglected, especially when compared to the bulk of work done in monochrome edge detection so far [5]-[SI. The early approaches to color edge detection usually comprise extensions of the monochrome edge detectors 1.0 color images. Nevatia [3] has proposed the use of the Hueckel edge operator in the luminance, chrominance color space. Robinsoin [4] has studied the application of compass gradient edge detection method to color images. The gradient operators proposed for grey-level images [9] can be extended to color images by taking the vector sum of the gradients of the individual components [lo], [ I l l . However, this approach may be very unsatisfactory in certain cases [ I l l . Consider for example, the case of a color image where in a certain direction, the red component is constant while the green and the blue components both show step edges with the same strength but in opposite directions. Then, the vector sum of the gradients would provide a null gradient. Manuscript received July 11, 1992; revised April 1, 1994, and January 19, 1995. P. E. Trahanias was with the Department of Electrical and Computer Engineering University of Toronto, Toronto, Ontario, Canada M5S 1A4. He is now with the Department of Computer Science, University of Crete, GR 714 09 Heraklion, Crete, and the Institute of Computer Science, Foundation for Research and Technology - Hellas (FORTH) GR 711 10 Heraklion, Crete, Greece. A. N. Venetsanopoulos is with the Department of Electrical and Computer Engineering, University of Toronto, Toronto, Ontario, Canada M5S 1A4. Publisher Item Identifier S 1083-4419(96)00420-7.
Consequently, latest approaches consider the problem of color edge detection in the vector space. In these approaches, color images are treated as vector fields, as has initially been suggested in [12]. Zenzo [ I l l , and Cumani [I31 employ vector gradient and second order derivative operators, respectively. In another approach, reported in [lo], the entropy operator is used as an edge detector for monochrome as well as for color images. A different approach to the problem of color edge detection is proposed in this paper which is based on vector order statistics [ 141. This approach is inspired by the morphological edge detectors [15], [16] that have been proposed for the case of monochrome images. These detectors essentially operate by detecting local minima and maxima in the image function and combining them in a suitable way in order to produce a positive response for an edge pixel. Since there is no exact equivalent of the min-max scalar operators for multivariate variables, we rely on the vector ordering schemes that have been proposed in the statistics literature [14]. More specifically, the R-ordering (reduced or aggregate ordering) scheme is adopted, and a class of color edge detectors is defined using linear combinations of the sorted vector samples. The minimum over the magnitudes of these linear combinations defines this class of operators. Different coefficients in the linear combinations result in different edge detectors that vary in simplicity and in efficiency. The coefficients are preset and cannot be changed at run time. It is shown by experimental and simulation results that a certain set of coefficients achieves a robust color edge detector. Moreover, our approach is shown superior to previous approaches based on comparative evaluation results using Pratt’s figure of merit [17]. The comparison has been made against the well known vector operators (vector gradient, second order derivative, entropy), and the vector sum of the gradients of the three color components. The final operator is also used since it presents one of the best known component-wise operators [181. In what follows, a brief introduction to vector order statistics is first given in Section I1 for the self completeness of the paper. Our approach to color edge detection is described in detail in Section 111. Evaluation results as well as edge detection results obtained from real images are presented in Section IV, and our conclusions are outlined in Section V.
11. VECTORORDERSTATISTICS Scalar order statistics have played an important role in the design of robust signal analysis techniques. This is due to the fact that any outliers will be located in the extreme ranks in the sorted data. Consequently, these outliers can be isolated and filtered out before the signal is further processed. Ordering of univariate data is well defined and has been extensively studied [19]. Let the n random variables X,, i = 1 , 2 , . . . , n, be arranged in ascending order of magnitude as
Then the ith random variable X(t) is the so-called ith order statistic. The minimum X(l),maximum X(n),and median X(n/2)are among the most important order statistics, resulting in the min, max, and median filters, respectively.
10834419/96$05.00 0 1996 IEEE
136
IEEE TRANSACTIONS ON SYSTEMS, MAN. AND CYBERNETICS-PART B: CYBERNETICS, VOL. 26, NO. 1, FEBRUARY 1996
These concepts are, however, not straightforwardly expanded to multivariate data since there isn’t any universal way of defining an ordering in multivariate data. There has been a number of ways proposed to perform multivariate data ordering that are generally classified into [ 141: marginal ordering (M-ordering), reduced or aggregate ordering (R-ordering), partial ordering (P-ordering), and conditional ordering (C-ordering). multivariate X = Let X represent a p-dimensional [ X I , X 2 , .. . , X p l T where Xi, I = 1 , 2 , . . . . p are random variables and let X’, i = 1 , 2 , . . . , n be an observation of X. Each Xt is a p-dimensional vector Xt = [ X i ,XG, . . . , X i ] T . In M-ordering the multivariate samples are ordered along each one of the p-dimensions independently. For color signals this is equivalent to the separable method where each one of the colors is processed independently. The ith marginal order statistic is the
r
I
\ \ \ \ \ \ \
\ \ \ \ \ \ \
\ \ \ \ \ \ \
/ / / / / / /
/ / / / / / /
/ / / / / / /
I
1
I
I
\ \ \ \ \ \ \
\ \ \ \ \ \ \
(a)
\ \ \ \ \ \ \
t t t t t t t
\ \ \ \ \ \ \
/ / / / / / /
/ / / / / / /
I
(b)
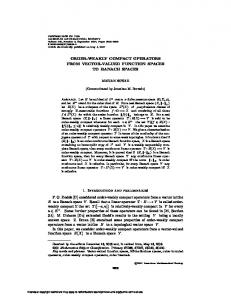
Fig. 1. (a) ideal color step edge (VI z\, color ramp edge (VI S,: V2 37, Vy =
V2 2
E/),
(b) ideal 3-pixel
=TI. -
111. COLOREDGEDETECTION
T
vector X‘” = [Xp’, Xp’, . . . , Xt’] , where Xp) is the ith largest element in the rth channel. The marginal order statistic X(‘) may not correspond to any of the original samples X I , X2,. . . . X” as it does in one dimension. In R-ordering, each multivariate observation X’ is reduced to a scalar value d, according to a distance criterion. A metric that is often used is the generalized distance to some point x. The samples are then arranged in ascending order of magnitude of the associated metric values d,. In P-ordering the objective is to partition the data into groups or sets of samples, such that the groups can be distinguished with respect to order, rank, or extremeness. This type of ordering can be accomplished by using the notion of convex hulls. However, the determination of the convex hull is difficult to do in more than two dimensions. Other ways to achieve P-ordering are ad hoc partitioning procedures and are thus not preferred. Another drawback associated with P-ordering is that there is no ordering within the groups and thus it is not easily expressed in analytical terms. These properties make P-ordering infeasible for implementation in digital image processing. In C-ordering the multivariate samples are ordered conditional on one of the marginal sets of observations. This has the disadvantage in color image processing that only the information in one component (channel) is used. From the above it is evident that R-ordering is more appropriate for color image processing than the other vector ordering methods. If we employ as a distance metric the aggregate distance of Xz to the set of vectors X I , X 2 , .. . ,X ” , then
I
\ \ \ \ \ \ \
A. Notation and Definitions In this work a color image is viewed as a vector field, represented by a discrete vector valued function f(x) : 2’ + Z m , where Z represents the set of integers’. A notation will be used in the following concerning the image function f . For W C Z 2 , xz E W , i = 1 , 2 . . . . . n, n is the size (number of pixels) of W, f(xt)will be denoted as X” X(’) will denote the ith ordered vector in the window TV according to the R-ordering method where the aggregate distance is used as a distance metric. Consequently, X(’) is the vector median in the window W and X(”)is the outlier in the highest rank of the ordered vectors. Although definitions of color edges have been given in other works [3], [13] we give here a loose definition of color edges in the context of vector fields. We also want to extend the notion of ramp edges that is well understood in monochrome images to color images. It is noted that the following definitions are not intended as formal definitions that can lead to edge detection operators but rather as intuitive descriptions of the notion of color edges in order to facilitate our discussion on edge detectors. We define a color edge as any signiJcant discontinuity in the vector field representing the color image function. An abrupt change in the vector field characterizes a color step edge, whereas a gradual change characterizes a color ramp edge. These points are illustrated in Fig. 1. A vertical color step edge is shown in Fig. l(a), whereas a vertical color 3-pixel ramp edge is shown in Fig. l(b). B. Color Edge Detectors Based on Vector Order Statistics
where I/ . 11 represents an appropriate vector norm. The arrangement of the d , s in ascending order (d(’) 5 d ( 2 ) 5 . . . 5 c l ( n ) ) , associates the same ordering to the multivariate X’s
Based on the previous discussion on vector order statistics, we define the basic color edge detector, the vector range’ (VR) edge detector, as
V R expresses in a quantitative way the deviation of the vector outlier
In the ordered sequence X(’) is the vector median of the data samples [20].It is defined as the vector contained in the given set whose distance to all other vectors is a minimum. Moreover, vectors appearing in low ranks in the ordered sequence are vectors centrally located in the population, whereas vectors appearing in high ranks are vectors that diverge mostly from the data population. These samples are generally called “outliers.” It follows that this ordering scheme gives a natural definition of the median of a population and of the outliers of a population.
in the highest rank from the vector median in W . Consequently, in a uniform area, where all vectors will be close to each other, the output of V R will be small. However, its response on an edge will be large since X(”) will be selected among the vectors from the one side of the edge (the smaller side, when we assume that W is divided by the edge into two unequal sides) while X(’) will be selected among the vectors from the other side of the edge (the larger side). By thresholding the output of V R the actual edges can be obtained.
’
Usually m = 3 but the results presented hold for m 2 2 . ’The name is borrowed from the scalar case where X ( ” ) - X ( ’ ) is the range of the ordered random variables.
IEEE TRANSACTIONS ON SYSTEMS, MAN, AND CYBERNETICS-PART B: CYBERNETICS, VOL. 26, NO. 1, FEBRUARY 1996
o o o c c o o 0 0 o c c 0 0 0 0
o c c
0 0
oooccoo o o o c c o o o o o c c o o 0 0
o c c 0
0
Fig. 2. (a) response of VR to the image of Fig. l(a), C == JIV1-VzI(, (b) response of V R to the image of Fig. lb, C/2 = llVl -V:$II = IIVz -V311. The response of V R to the two images (vector fields) of Fig. 1 is shown in Fig. 23. As can be verified from Fig. 2, V R introduces no bias in the case of a color step edge since it responds equally to both sides of the edge (Fig. 2(a)), but it responds with a 3-pixel wide edge in the case of an ideal color ramp edge. V R is also sensitive to noise, especially to noise modeled with a heavy-tailed distribution (e.g. double-exponential) which, according to [20]1, 161, is termed as heavy-tailed noise. Similarly, noise modeled with a short-tailed distribution (e.g. gaussian) is termed as short-tailed noise. VR will respond with n pixels (the pixels that belong to W ) to a single noisy pixel in the center of W . This drawback leads us to consider dispersion measures which are known as more robust estimates in the presence of noise [19]. A class of operators can be defined as a linear combination of the ordered vectors; V R is a special case of this class. This class of operators expresses a measure of the dispersion of the ordered vectors, and hence the name vector dispersion edge detectors (V D E D ) :
where at are proper coefficients (weights). V R is obtained from V D E D for a , = 1, a1 = -1, and a , = 0, i = 2 , . . . , n - 1. Equation (5) can be further generalized by considering k sets of coefficients at and combining the resulting vector magnitudes in a suitable way. The combination that is proposed employs a minimum operator which attenuates the effect of noise. Such a minimum operator has also been employed in [16] in order to derive a detector insensitive to noise impulses. According to the above, the general class of color edge detectors based on vector order statistics is defined as (6), shown at the bottom of the page, where h ! f V D E D stands for minimum V D E D . Specific color edge detectors can be obtained from M V D E D by selecting sets of coefficients a t 3 .Since a strict mathematical approach to this seems very difficult, we select sets of aC3 s that satisfy the requirements of (a) noise insensitivity, and (b) proper response to ramp edges. 3 A 3 x 3 window is assumed in this and all subsequent #examplespresented in this section.
137
The resulting edge detectors, that conform to the above requirements, are considered next. Two cases are presented that result in operators with (a) immunity to heavy-tailed noise, and (b) immunity to short-tailed noise and improved performance in the presence of ramp edges. An operator that combines these characteristics is finally introduced. For the sake of brevity, the coefficients aZIwill implicitly be considered as being equal to zero for all the pairs i , j for which they are not defined. Case I : a,, = a , - 1 , p - . . . - a,-k+l,k = 1, = -1, j = 1 , 2 , . . . , k , k < n. As explained previously, VR is sensitive to noise (especially to heavy-tailed noise) since the vectors placed in the highest ranks of the ordered data will essentially correspond to noisy samples and consequently VR will erroneously respond in the presence of noise. This problem can be alleviated by employing the magnitudes of the differences of the k highest vectors from X(') and obtain an edge detector that is insensitive to heavytailed noise (e.g. impulsive or exponential). In terms of (6) this can be formulated as
j=1,2
,..., k ,
k < n
(7)
where M V R stands for minimum VR. The choice of k depends on n, the size of W . For a 3 x 3 window, for example, k 5 3 and for a 5 x 5, k 5 10. Unfortunately, there is no general formula to obtain k and its value should be subjectively estimated. However, this is not a difficult task since k can be interpreted as the number of pixels that belong to the smaller side of an edge, when W is centered on an edge pixel. Moreover, its value is not crucial in the overall performance of MVR. The response of M V R to ideal step and ramp color edges is exactly the same as the response of V R . However, it exhibits improved noise immunity. It will not respond to up to k - 1 noisy pixels in W . A final comment on M V R concerns the use of the min function. We note that this can not be simply replaced by taking the magnitude of the vector difference between X("-"') (the "smallest" among the X("-3+1),j = 1 , 2 , . . . , k , vectors) and X(') since it will yield in general different results. In other words, the magnitudes of vector differences in a sorted vector data set, do not necessarily follow the order of the sorted vectors. This is exemplified by a simple example concerning the set of 2 - D vectors S, = {(5,4),(4,5),(4,7),(4,2),(3.4)). Sorting S , will result in the orderedsets, = {(4,5),(5,4),(3,4),(4,2),(4,7)}.Itisnotedthat (4,7) has been placed in the highest rank in the sorted data set and (4,2) has been placed in the second highest rank. The distance, however, of (4,2) to the vector median (4,5)is larger than the distance of (4,7)to (4,5)for both L1 and Lp metrics. Case 2: k = 1, an, = 1, a,l = -111, i = I , & ... , I , 1 < n. This choice of coefficients results in a vector dispersion ( V D ) edge detector that employs an averaging scheme
IEEE TRANSACTIONS ON SYSTEMS. MAN. AND CYBERNETICS-PART B: CYBERNETICS, VOL. 26, NO. 1, FEBRUARY 1996
138
o ooo ooo 0 0 o
0 0
c c c c
c 0 0 coo c 0 0 c 0 0
0 0 O C C 0 0 0 0 o c c 0 0 0 0 o c c 0 0
0 0 0 cz c1 0 0 0 cz c1 0 0 0 CZ c1
c2
0
c2
0 0 0 c2 c1 0 0 0 c2 c1 0 0 0 cz c1 0 0 0 c2 c1
c2
Ct
0 0 0 0 0
c2
0
Fig. 3. (a) response of V D to the image of Fig. la, C = llVl response of V D to the image of Fig. lb, C1 > C,.
CZ
c2
- Vz
11,
@)
The response of VD to the two images of Fig. 1 is shown in Fig. 3. Its behavior is exactly the same with the behavior of T'-R and M V R in the case of the color step edge. However, it has improved performance in the case of a color ramp edge since it assigns a higher value (Cl) to the true edge pixel than the value (C,) assigned to the neighboring pixels (the fact that C1 > C, can be very easily proved by geometrical considerations). Consequently, by thresholding the output of VD with a proper threshold value, the ramp edges can be extracted. For ideal ramp edges of larger spatial extent than the detectors window, more than one central pixels will be given a large value. However, by enlarging the window size the central (true edge) pixel will again be given a higher value than its neighbors and it can be detected by thresholding. The value of the parameter I used in the computation of 1 - D can not be formally defined as it is the case for the parameter k employed in the computation of M V R .However, a duality exists I I between these two parameters; Z expresses the number of pixels that belong to the larger side of an edge when TV is centered on an edge (e) (f) pixel. Therefore, proper values for the parameter 1 can be subjectively Fig. 4. Response of M V D to noise contaminated edge. (a) Initial edge, estimated for various sizes of W . (b) Response of .IfVD to (a), (c) edge (a) corrupted with gaussian noise, (d) response of M V D to ( c ) , (e) edge (a) corrupted with double-exponential The second term in the vector difference in (8) x ( i ) 7) is the vector a-trimmed mean ( V a T M ) [21], which is a robust noise. (0response of M V D to (e). signal estimate in color images when the noise is modeled as shorttailed [22].It is, therefore, expected that TrD will have improved performance in the presence of short-tailed noise due to the smoothing the presence of heavy-tailed noise (due to the minimum operation) and short-tailed noise (due to the averaging operation). The noise performed. Case3: anl = a,-1,2 = . . . = a n - k + l , k = 1. ai3 = i = performance of M V D is illustrated in Fig. 4 for the cases of 1 , 2 . . . . , I , .j = 1 , 2 , . . . , k , Z,k < n. The two operators introduced gaussian (Fig. 4(c)) and double-exponential (Fig. 4(e)) noise. The previously ( M V R , VD) have some desirable properties that are response of M V D , shown in Fig. 4(d) and (f), respectively, is different in each case. M V R is insensitive in the presence of heavy- much larger at the true edge which is, therefore, easily detected by tailed noise. VD responds properly to color ramp edges and has thresholding. improved performance in the presence of short-tailed noise. We wish to combine these two operators in order to exploit the properties of both. This can be achieved by the set of coefficients a Z Joutlined above. The resulting edge detector (minimum vector dispersion - C. Statistical Considerations M V D ) is given as A statistical analysis of M V D is attempted here in order to derive the error probability of the edge detector. The analysis is confined to the case of multivariate normal distributions only, since these are the only distributions for which analytical results concerning the distribution functions have been derived in the statistics literature. We j = l , 2 , . . . ,k , k , I < n (9) consider an ideal edge model with the sample vectors X, on the one side of the edge as instances of a random variable X which follows a M V D inherits the properties of its ancestors. It is a bias free multivariate normal distribution N , ( p z ,I,). Similarly, the sample operator for color step edges whereas it produces a larger response vectors Y , on the other side are instances of the random variable Y for the true edge of a color ramp edge. Its response to the images which is N,(pVr I m ) .Then, the error probability is given as
(Cl=,
+.
of Fig. 1 is exactly the same as the response of V D (Fig. 3). Moreover, it has improved noise performance since it is robust in
IEEE TRANSACTIONS ON SYSTEMS, MAN, AND CYBERNETICS-PART B: CYBE{RNETICS, VOL. 26, NO. 1, FEBRUARY 1996
139
IV. EXPERIMENTAL RESULTS
0
-1
1
2
3
t’
Quantitative evaluation of the performance of edge detectors is complicated since different evaluation criteria are employed by the designers which lead to different performance figures. Moreover, quantitative evaluation is in many cases not performed and only qualitative results are presented which are very difficult to be used in assessing the performance of edge detectors. The quantitative performance measures can be grouped into two types, probabilistic measures and distance measures. The first type is based upon the statistics of false edge detection and false edge rejection. The second type is based upon edge deviation or error distance which is the minimum distance between the detected and the truth edge. A distance measure that is often used in edge detector’s evaluations is Pratt’s figure of merit (FOM) [17]. It is defined as
Fig. 5. PE versus t’ (see text for explanation).
where P,, P, denote the prior probabilities of “edge” and “no edge,” respectively, and I‘M, PF are the probabilities of missing an edge and false edge alarm, respectively. A detailed analysis of (IO) is carried out in the Appendix. Based on the results presented there, a plot of PE is drawin which is shown in Fig. 5. The parameter p shown on the plot expresses the number of sample distances (i.e. ordered vectors) and is equal to IC [see (9)]. It is, therefore, related to the window size n. Froin (16), (17), and Fig. 5 we can conclude that PE is decreased with respect top. Since p increases with the window size n, it is concluded that the probability of error PE decreases with respect to 7 ~ .However, n can not be drastically increased since it is well known that a large window has a negative effect in accurate edge localization. Besides, n should be kept reasonably small due to computational requirements as we will see in the next section.
D. Computational Considerations Computationally the vector ordering task is a 0(n2) operation since $ n ( n- I) vector distances have to be computed. The ordering itself may be performed by a fast sorting algorithim (e.g. quicksort) with a O(n1ogn) complexity. Therefore, the whole task of vector ordering is dominated by the O ( n 2 ) term which determines its complexity. For the case, however, of color im,age processing, a fast algorithm has been proposed for the computation of the vector distances [20]. This algorithm is based on the principle that as the window W (of size n ) moves in the image plane, only m (< n ) new pixels are considered each time whose distances have to be computed. The distances of the rest n - rn pixels are simply updated. This algorithm results in a 0 n3” complexity for the computation
where 10, I I are the number of detected and number of ideal edge points respectively, a (> 0) is a calibration constant, and d , is the separation distance of the ith detected edge point normal to a line of ideal edge points [17]. In all cases 0 < F O M 5 1; for a p e ~ e c match t between the detected and the ideal edges F O M = 1, whereas as the detected edges deviate more and more from the ideal ones F O M goes to zero. F O h l has been adopted in this work due to its advantage over the probabilistic measures that it renders a more realistic appraisal of the detected edges [7]. If we consider, for example, the case where all the edges are 1-pixel shifted from the ground truth, a probabilistic measure would give a very poor rating but F O M still gives a performance measure very close to unity (0.9). Moreover, F O M has been used by many authors in the evaluation of edge detectors [7], [17], [25]. The scaling constant a = 1/9 proposed by Abdou and Pratt has been adopted in our simulations. A. Performance Evaluation
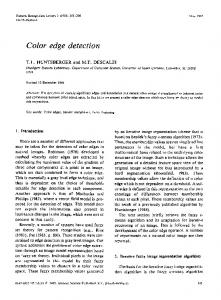
An artificial image has been created and used as a benchmark for assessing the performance of the vector order statistics operators and for comparison purposes. It is shown in Fig. 6 along with its red, green and blue components. This image has been intentionally created in order to meet a number of requirements: (a) it contains vertical, horizontal and diagonal edges, (b) there are edges where all three color components, or two color components, or only one color component change, (c) black (all color components are zero), white (all color components are equal to the maximum value, 255) and grey (all color components have the same value) areas are present on of the vector distances in the case of square windows (m = The the image, and (d) isoluminant (areas with identical luminance) and trade-off is the increased programming complexity in the computation nonisoluminant areas are present on the image. A number of edge detection experiments have been conducted of the distances. using various noise distributions at various noise levels to contaminate The V a T M can be computed only once since it does not depend the test image. In each case, F O M has been measured and used as on the index j [(9)]. Its computation is a O ( l ) operation, 1 < n. The computation of the magnitudes of the IC vector differences the performance criterion. The ground truth (real edges) that is needed for the computation of F O M , is trivially obtained for the noise free X(”-3f1)- V a T M is a O ( k ) operatiton, k < n. This (original) artificial image (Fig. 6) with the application of any edge operation can be performed simultaneously with the minimization detector. Three noise types were used in the experiments: gaussian, operation. In summary, the computational complexity of (9) is O ( n 2 ) double-exponential and impulsive. For each noise type two sets of if all the vector distances in W7 are computed, which can be reduced experiments have been performed. In the first set, the noise process to O(n3”) if the fast algorithm is employed. For small IL, which in each channel has been considered as an independent process. In is the case in edge detection, even the O ( n 2 )complexity is not the second set, the noise process has been considered as a correlated very expensive. Furthermore, if the L1 norm is adopted only integer process since there is some indication that this type of correlation operations are involved, whereas for the La norm, square root may exist in real color images. operations have to be employed. However, the siquare roots can be The performance measures of the color edge detectors based on avoided, which is equivalent to computing the M V D squared. vector order statistics are shown graphically in Fig. 7. A number of
0
(/
11)
6).
IEEE TRANSACTIONS ON SYSTEMS, MA??, AND CYBERNETICS-PART B: CYBERNETICS, VOL. 26, NO. 1, FEBRUARY 1996
140
Gaussian independent noise
Gaussian correlated noise
1
0.8
0.6 FOM
FOM 0.4
0
10
20 30 SNR (dB)
40
0
Double-exp independent noise
10
20 30 SNR (dB)
40
Double-exp correlated noise
1
1
0.8
”MVD“ 0.6
”MVR” ”VR”
FOM
0.4
08
-
-
0.6
-
FOM 0.4
0
10
20
30
40
SNR (dB) Impulsive independent noise
Irn~ulsivecorrelated noise
1 0.8
”MVD” ”VD”
0.6
(c)
(d)
Fig. 6. Artificial image used for testing and comparison purposes (a) image, (b) red component, (c) green component, (d) blue component.
“MVR” ”VR”
FOM 0.4
0
10
20
30
SNR (dB)
conclusions can be drawn from the graphs of Fig. 7 which are in accordance with the structure of the edge detectors: The performance of M V D is superior compared to the other operators for all types of noise. This is quite as expected since M V D has actually been assembled using the desirable properties of the other operators. V R is sensitive to noise and its performance is largely deteriorated as noise increases. * M V R and TiD have good performances for heavy-tailed and short-tailed noise, respectively. From the plots of Fig. 7 we also conclude that the performance deterioration of the vector order statistics edge detectors is “smooth” as noise increases. Only for the case of impulsive noise we observe a more “precipitous” performance degradation in the range 6 8 dB, which, for the test image of Fig. 6, corresponds to 8-10% of noise corruption. This noise level is sufficiently high to justify the performance degradation, especially for the case of color images where the contribution of the three channels causes one in every three or four pixels to be corrupted. In the experiments described above the Llnorm has been used. The reason for this is that very similar results have been obtained for both the L I and the Lz norms, but L1 is cheaper to compute. The values used for the parameters of the operators were: 5 x 5 window, IC = 8, I = 12. It should be noted here that these values have been experimentally obtained and, more importantly, they are not critical in the overall performance. Practically, their performance has been left unchanged for 7