293
IEEE TRANSACTIONS ON PATERN ANALYSIS AND MACHINE INTELLIGENCE, VOL. 18, NO. 3, MARCH 1996
Vehicle Segmentation and Classification Using Deformable Templates Marie-Pierre Dubuisson Jolly, Sridhar Lakshmanan, and Ani1 K. Jain, Fellow, /€E€ Abstract-This paper proposes a segmentation algorithm using deformable template models to segment a vehicle of interest both from the stationary complex background and other moving vehicles in an image sequence. We define a polygonal template to characterize a general model of a vehicle and derive a prior probability density function to constrain the template to be deformed within a set of allowed shapes. We propose a likelihood probability density function which combines motion information and edge directionality to ensure that the deformable template is contained within the moving areas in the image and its boundary coincides with strong edges with the same orientation in the image. The segmentation problem is reduced to a minimization problem and solved by the Metropolis algorithm. The system was successfully tested on 405 image sequences containing multiple moving vehicles on a highway.
Index Terms-Object shape models, contour extraction, deformable templates, Bayesian inference, simulated annealing, motion detection, travel time estimation.
+ 1 INTRODUCTION 1.1 Problem Description
0
UR vision application is in the domain of ITS
(Intelligent Transportation Systems). A large number of papers describing machine vision systems for ITS have been published in the literature [l],[2], [3], [4]. One of the primary objectives of ITS is to reduce travel time by assisting the traveler to avoid congested traffic situations and find the minimum travel time path through a road network [SI. One machine vision-based solution to the problem of measuring the average time for vehicles to go from one point to another in a road network is to match license plates [ 6 ] . However, the camera needs to be focused on the license plate and the license plate has to be large enough in the sensed image so that individual characters can be recognized. These constraints are difficult to overcome in dense traffic situations, especially when the vehicles are moving at high speed. An alternate machine vision-based approach which is currently being evaluated [7] is the following (see Fig. 1):cameras are placed at different locations on the sides of the road to capture the images of moving vehicles. Vehicles are matched with previously observed vehicles using color and shape features. In this application, transportation researchers have demonstrated that it is not necessary to find all the correct
matches; it is enough to find a sufficient number of reliable matches in order to compute some statistical information about the travel time from one point to another or about the travel pattern in a road network [8]. The focus of this paper is a solution to the underlying vision problem, namely, the one of classifying vehicle shapes from image sequences.
I
T-
4
t
Locating front vehicle Feature extraction L
Matching 1
*Locating front vehicle *Feature extraction
I
M.-P. Dubuisson Jolly is with Siemens Corporate Research, 755 College Road East, Princeton, NI 08540. E-mail: dubuissoQscr.siemens.com. S . Lakshmanan is with the Department of Electrical and Computer Engineering, University of Michigan-Dearbom, Dearbom, M I 48128. E-mail:
[email protected]. A X . Jain is with the Department of Computer Science, Michigan State University, East Lansing, MI 48824. E-mail:
[email protected]. Manuscript received May 24,1995; revised Nov. 10,1995. Recommended for acceptance by S. Peleg. For information on obtaining reprints of this article, please send e-mail to:
[email protected],and reference IEEECS Log Number P95175.
Travel time
Fig. 1. Matching vehicles for travel time estimation.
We solve the problem of segmenting a moving vehicle in image sequences of a complex road scene using deformable templates. Fig. 2a shows a typical image in our database.
0162-8828/96$05.00 01996 IEEE
294
IEEE TRANSACTIONS ON PATTERN ANALYSIS AND MACHINE INTELLIGENCE, VOL. 18, NO. 3, MARCH 1996
We are interested in segmenting the vehicle in the lane closest to the camera (front vehicle). This segmentation is difficult due to the complex nature of the background-it contains other moving vehicles, strong region boundaries that do not pertain to the vehicle of interest, and large patches of texture. By using a deformable template based Bayesian scheme we are able to overcome this inherent difficulty, and successfully segment the front vehicle from the background and the other moving vehicles as can be seen in Fig. 2b.
in the lane closest to the camera, 3 ) it i s moving, and 4) its edges in &e image are well defined. We incorporate this prior knowledge by using deformable template models, and pose the vehicle segmentation problem as a Bayesian energy minimization problem. There are two broad classes of deformable template models-the “snakes” model in Kass et al. [ l l ] which constrains the edges in the image to be continuous, and the global shape models in [12], [13], [14], [15], [161, [171, 1181 which describe in a stylized manner the geometric properties of the objects which appear in the image. In this paper we adopt the global shape models, because we find it to be better suited for the problem at hand. A global shape model based image segmentation scheme consists of the following: 1) a template ‘I-defined (@ by a),
set of deformation parameters 0 = (el, ..., ON),which denotes a prototype of the objects present in an image Z, 2) a prior probability density function p ( 0 ) which specifies what deformations of the prototype template are more likely to be present in Z, 3 ) a likelihood probability density function p(Z I 0 ) which discriminates between different hypothesized deformations in terms of how ”close” they are to the actual objects in the image Z , and 4) an algorithm for finding the template T ( 0 ) defined by the parameters 0 which ”best” characterizes the objects in the image Z; more specifically, the deformation parameters 0 which maximizes the a posteriori probability p ( 0 I Z).
f.2 Template The template specification T ( 0 ) is problem dependent. For example, in [13] the template T ( 0 )is a polygonal shaped object representing the contours of a human hand, where 0 denotes the edges of the polygon. In [12] the template T ( 0 )is an intensity image over a rectangular domain representing an X-ray picture of a typical human hand, and 0 denotes the underlying rectangular domain. In [14] the template T(O)is a three-region object representing typical road scenes, and 0 denotes the two straight and parallel edges that specify the three regions. In [18] the template T(O)is an ellipsoidal object representing the human eye, where 0 specifies the parameters of the ellipses. We refer the reader to [19] for several other examples of template definitions.
1.3 Prior The prior probability density function p ( 0 ) is constructed in such a way that the deformation parameters 0 for
Fig. 2. Vehicle segmentation: (a) a typical image; (b) segmentation of the vehicle in the lane closest to the camera.
The usual approach to image segmentation involves edge detection and region grouping 191, [lo]. These approaches neither require nor incorporate any specific knowledge about the scene and are meant to solve generic image segmentation problems. There is a considerable amount of domain-specific knowledge in our segmentation problem: 1)the object of interest is a vehicle, 2) it is located
which the deformed template T ( 0 ) is likely to be present in the image Z are assigned higher probability, and other values of 0 are assigned a lower probability. In the literature, there exists several examples of p ( 0 ) . For example, in [13] it is a Markovian density, in [12], [20] it is a Gaussian density, and in [14], [18] it is a uniform density over a compact support. We again refer the reader to [19] for other examples.
1.4 Likelihood The likelihood function P(Z IO) evaluates the probability of the observed image Z, given a set of deformation parameters 0. The likelihood function is constructed to attain its
DUBUISSON JOLLY ET AL.: VEHICLE SEGMENTATIONAND CLASSIFICATIONUSING DEFORMABLE TEMPLATES
295
function. It attains its maximum value when the contours of the deformed template coincide with underlying image edges that have a strong gradient magnitude and whose gradient orientation is perpendicular to the contour. Our definition of the likelihood function differs from previously published works in two ways. An important characteristic of our energy function is that it combines multiple cues about the imaging process, namely motion and edge information. By using gradient magnitude and direction on the boundary of the template, we implicitly correlate both sides (object and background) of the boundary. This differs from random field based approaches where the inside and the outside of the template are modeled by two independent processes. This also differs from the approach described in [2] which combines motion information and edge magnitude only. 1.5 Minimization algorithm Our segmentation problem is stated in a Bayesian When solving an image segmentation problem using de- framework and is reduced to an energy minimization formable templates, the algorithm for finding the deforma- problem. Our energy function contains many local minima, tion parameters 0 that maximize the posterior probability and so we have chosen a simulated annealing procedure density function p ( 0 12) plays an important role. Typically, based on the Metropolis algorithm to solve the minimizathe maximization problem is posed as an equivalent energy tion problem. We have also experimented with a number of minimization problem. In [15], [MI, greedy (gradient- temperature cooling schedules and adopted a geometric based) methods are used for energy minimization. These cooling because it yields consistently good results in a small methods have the disadvantage of requiring very good ini- number of iterations. tial parameter estimates, otherwise they will converge to a In our opinion, the primary contribution of our work lies local minima. Stochastic methods based on simulated an- in a sensible construction and combination of the prior and nealing [21], [22], [23], [24], [25] have the capability of likelihood functions in order to solve an important practical avoiding local minima. In [14] the Metropolis algorithm problem, namely, one of segmenting moving vehicles from [21] is used for energy minimization. Annealing algorithms complex background. This paper is different from our earbased on the Langevin diffusion equation [23], [24] are used lier work on a similar topic [27]. In [27], the approach was for energy minimization in [12], [13]. In [25] and [26] the to combine motion and color information to obtain a accudiffusion-based algorithms are combined with a random rate segmentation of the moving object. Motion and color jump process to yield jump-diffusion algorithms for energy information were integrated using a "snakes" paradigm. minimization. An important assumption in [27] was that there was only one moving object in the image-the algorithm in [27] was 1.6 Vehicle Segmentation not able to separate multiple moving objects; instead, they Our definition of the prototype template of a vehicle is were grouped into a single moving object. The remainder of this paper is organized as follows. similar to the one adopted by Phillips and Smith [20]. We model a generic deformable vehicle as a polygon with N Section 2 describes the deformable vehicle template and the vertices. Thus, our deformable template is characterized by prior probability density function. Section 3 defines the a finite set of parameters (the locations of the vertices). We likelihood probability density function comprising of a moensure that the polygonal template resembles a vehicle by tion information term and an edge directionality term. Secimposing a number of constraints on the relative locations tion 4 presents the minimization algorithm. In Section 5, we of its vertices. These constraints are used to derive a prior discuss vehicle segmentation results and explain how these probability density function on the set of parameters which results are used by our matching system to identify pairs of restricts the template to be deformed within a set of al- identical vehicles for the purpose of travel time estimation. lowed shapes. The fact that the vehicle is located in the lane Finally, Section 6 summarizes our study. closest to the camera further constrains the positions of the vertices. We describe how to derive these constraints (a set 2 A DEFORMABLE VEHICLETEMPLATE of rules) directly from training samples of vehicle images. We note that, the same approach can also be applied to de- The first two steps in designing a segmentation algorithm rive deformable template models for other (nonvehicular) using deformable templates consist of defining a prototype polygonal shapes. template and a prior probability density function governOur likelihood probability density function is modeled by ing deformations of this prototype template. We define a Gibbs distribution whose exponent comprises of two terms. the prototype template of a generic vehicle as a polygon The first term is a function which is derived from the fact that characterized by N vertices 0 = (el,e,, ..., 0,) in the 2D the vehicle of interest is moving. It attains its maximum value when the deformed template encompasses only those pixels plane as shown in Fig. 3, where 8, = ( X , , Y J , and X , , Y , are that are moving. The second term is a directional edge-based the Cartesian coordinates of 8,. Each pair of successive maximum value (with respect to 0) when the deformed template and the underlying image features exactly match. For example, in [18] the likelihood function is edge-based, and it attains its maximum value when the deformed template contours fall exactly on top of the underlying image edges. In [14] and [15], the likelihood functions are based on a random field description of the underlying image texture, and they attain their maximum values when the image is partitioned by the deformed template contours into distinctly different random field textures. Finally, in [12], [13] the observed image is assumed to be generated from the deformed template by adding independent Gaussian noise and it attains its maximum value when the deformed template and underlying image intensities match at every pixel.
IEEE TRANSACTIONS ON PATTERNANALYSIS AND MACHINE INTELLIGENCE, VOL. 18, NO. 3, MARCH 1996
296
e+,),
points (8,, i = 1, . .., N defines a boundary segment of the template. We assume that the boundary is closed, so for notation purposes, ON+, = 0,.
parameters (XI, Y,,..., XI,Yl;j # k,, ... XN,YN)of the template. We define a prior probability density function so that, within the interval Xcm, the prior prob-
Xy],
ability for the parameter Xkl is maximum. As Xk,deviates from the bounds of the interval, its prior probability decreases. More specifically, we define a function g,( ) €or rule rl as follows:
-Xkl +XFm if Xkl < X r if X c m I Xkl _< Fig. 3. Deformabletemplate defining a generic model of a vehicle.
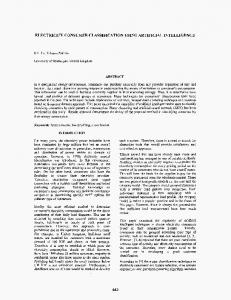
The shape of the prototype vehicle template was established by studying a database of images containing typical vehicles which can be considered as our training samples. Since there are large variations in vehicle shapes, it is unlikely that a single template can capture all the shapes. So, we have categorized vehicles into the following five classes: sedans, pickup trucks, hatchbacks, station wagons and 4 x 4s, and vans. This list can be further expanded to include heavy vehicles such as trucks, buses, trailers, etc. Each vehicle class is defined by its own prototype template as shown in Fig. 4. Note that the sedan and pickup trucks are modeled by a polygon with eight vertices whereas the polygonal model of the hatchbacks, station wagons or 4 x 4s, and vans only have seven vertices.
Sedan
Pickup Truck
Fig. 4. Five classes of deformable vehicle templates.
We allow the prototype template to deform by changing the values of the template parameters 0. In order for the deformed template to resemble a vehicle, some constraints on the relationships between the different vertices (e,, 6J2,..., ON) must be satisfied. For example, p4should always be above p8, pl should always be located to the left of p7, etc. A set of rules on the template parameters 0 constrains the shape of the vehicle template. These rules were empirically determined by studying the intraclass variability of the vehicles in our training set. A generic rule, say Y,, specifies the range of allowable values that a parameter (the X or Y coordinate of one of the vertices Bk) is allowed to take. Without a loss of generality, we denote this parameter as Xk,.The The interval boundarule y1 states: (Xc” I Xkl I
Xy).
ries X r and
X y are themselves functions of the other
Xy
(1)
For a given deformation of the prototype template 0, the function
where M is the total number of rules, defines a constraint satisfaction function. The prior probability of a set of deformation parameters 0 is defined in terms of how well it satisfies the constraints: p(@) = x1 exp{-~(O)), (3) where
4 denotes the normalizing constant.
We have defined a set of 17 rules as shown in Table 1. There is one rule for each of the 16 vertex coordinates and an additional rule to constrain the vehicle template to be a closed polygon. To simplify the notation, we have defined L = (Y,- YJ to be the length of a deformed template. It can be seen that most of the rules depend on L, thereby allowing the prior probability of the template to be independent of scale. We have also defined three other parameters, namely, B and B, representing the row position and the starting c o l m position of the initial baseline, and Lo representing the initial estimate of,the length of the vehicle. The values of B, B,, and Lo are directly estimated from !the TABLE 1 SET OF RULES USED TO DEFINETHE PRIOR PROBABILITY ON THE DEFORMED VEHICLE Au B-2 XS
XT- 0.6L
-
Xz 0.6L X I - 0.95(& - X4) Xi - O.95(X1 - X,) X, B-2
Station wagons and 4x4s: Yz 4 1; 5 Y, yZ 5Y45 %+0.2L % + 0 . U 5 % 5 12 +0.65L YG +0.15L 5 6 5 Y, +0.4L
Y , + 0.lL
Sedans:
< 1:
tkw, (i, j ) E G,
Dt(i, j)=
and 3(k, l ) E G s. t. D(k, 2) > t:gh, 0 otherwise
(6)
where G is any fully connected region. The thresholded image Dt is used to produce a motion mask 3M such that N(i,j ) = 1 if pixel (i, j ) belongs to the moving object and N(i,j ) = 0, otherwise. This mask is obtained by deleting isolated ”on” pixels in Di and grouping the remaining “on” pixels into a single blob through a chamfering technique equivalent to a morphological ”close” operation 1271. Fig. 5 shows an example of the motion detection results. Note that this motion detection algorithm does not use any domainspecific knowledge about the type of input images or the type of objects expected to be present in the input images. The resulting motion mask highlights the moving areas in the image which include both the vehicle of interest and other moving vehicles. The difference image is also used to compute B and B,, the row and column estimates of the initial baseline, and Lo an initial estimate of the vehicle’s length (see Fig. 6). Recall that B, B,, and Lo are needed to evaluate the constraint function C(O) in (2). The vehicle of interest is located in the lane closest to the camera, and the lane’s extent within the image (row positions tl and &) is determined by the camera geometry. The row position of the initial vehicle baseline is found by summing the rows of the difference image and finding the maximum sum between and t2.
B = arg
max
5%5 i 5 t7
C D ( i , j). i
(7)
IEEE TRANSACTIONSON PATTERN ANALYSIS AND MACHINE INTELLIGENCE, VOL. 18, NO. 3, MARCH 1996
298
(4
(4
Fig. 5. Motion detection: (a) frame 1; (b) frame 2; (c) frame 3; (d) thresholded difference image D,;(e) outline of the motion mask % overfaid on frame 2.
The extent of the vehicle in column position is determined by locating the column positions B , and B, where sharp changes in the sums
" D ( i l j ) occur. The initial esti1=51
mate of the vehicle length is defined as Lo = (B2- BJ. Note that in Fig. 6d, as a first approximation of the vehicle baseline, this algorithm mostly identifies the vehicle shadow. The vehicle baseline and length are further refined by the deformable template algorithm.
I
1
I
Fig. 6. Estimation of the initial vehicle baseline and length: (a) difference image; (b) row summation and location of B; (c) column summation and location of B, and B2; (d) the white line shows the estimated initial vehicle baseline and length.
and the gradient unit length direction vector
3.2 Edge ~ n ~ ~ ~ m a ~ i ~ n Information regarding edges of the vehicle is extracted from the middle frame in the three-frame sequence, thus I = Z2 in the following. The gradients VI, and VIy in the x and y directions, respectively, are computed using the Canny edge detector [28]. The gradient magnitude
(a)
are computed at every point in the image. Fig. 7 shows the resulting edge images.
3.3 Likelihood function The likelihood function comprises of a motion detection
(b)
--t
Fig. 7. Edge detection: (a) input image I; (b) edge magnitude image (IVI((; (c) gradient direction vector image V I .
(4
299
DUBUISSON JOLLY ET AL.: VEHICLE SEGMENTATIONAND CLASSIFICATIONUSING DEFORMABLE TEMPLATES
term and a edge directional information term. Motion detection is included in the likelihood function by defining a motion energy function UM(ax,,Z) for each boundary segment q of the deformed template:
where Nk is the number of pixels in the line feature q.Note
puted, then it would automatically remove all of the inherent biases in the composite energy function. Since we cannot compute it, we have chosen to remove the biasing effects in a step-by-step fashion-by directly normalizing the terms in (lo), (ll),and (13). We acknowledge that this represents a deviation from proper Bayesian inference, but many of the existing studies also suffer from the same drawback. For the choice of h(.),we also considered the function A h'(x) = 1+ a(xl
that 0 S U M ( q )S 1, and UM(qQ attains its maximum value when all the points on ax, are included in the motion mask N. which was suggested by Blake and Zisserman [30].In this The directional edge information is included in the likeli- function, A controls the height of the curve at the origin and a hood function by defining an edge energy function UE(ax,,Z ) controls the spread of the curve. This function is more appropriate for infinite domains. However, in our expression of the for each ax,: edge directionality term, h(.) is applied to a variable whose value varies between -1 and 1. For different values of A and a, we noticed that (14) resulted in very narrow valleys of the energy function. The function h(.) that we propose in (12) does not suffer from this problem and results in a smoother energy function, whose maxima are easier to find. where
4 MAP SEGMENTATION I.'
denotes the dot product of two vectors, and 1-IxI -15 x 2 1 h(x) = 0 elsewhere.
The first term in the numerator of (11)is maximum when the image pixels along ax, have a high gradient magnitude. The second term is maximum when the direction of the image gradient along q is perpendicular to the orientation of q.In other words, LIE(%, Z ) attains its maximum value when ax, is placed exactly on top of an underlying image edge. The term in the denominator of (11)has three major roles: 1) it ensures that LIE( ax, ,Z ) is not biased towards large template deformations (using the Schwartz inequality it can be shown that 0 5 LIE(q,, Z ) 5 1);2) it balances the importance between gradient magnitude and gradient direction, so that one does not dominate the other; and 3) it makes the energy function smoother while retaining its significant peaks and valleys. The composite energy function LI(0,Z ) and the likelihood probability density function p(Z I 0)are defined as ~ ( ~ 1=0K~ ) exp {U(@,z)}
Given the prior and the likelihood probability density functions, we formulate the vehicle segmentation problem in a Bayesian framework. In particular, we seek the maximum a posteriori (MAP) estimate of the template parameters 0 given the images Z, defined as: O* = argmax ~(01~). 0
(15)
Combining the prior (3) and the likelihood (13) probability density functions, using the Bayes rule, the posterior probability density function p ( 0 I Z ) can be rewritten as a Gibbs distribution whose energy function is E(@, Z ) = - U(@, Z ) + C(0):
p( O ~ Z=)x3 exp {-E( 0,z)},
(16)
where '5 is a normalizing constant that only depends on Z and not on 0.Hence, (15) reduces to
0' = arg min E(@, Z ) = arg min[-U(@, Z ) + C(O)].
(17)
Q
In other words, the vehicle segmentation problem is equivalent to the energy minimization problem:
11
(13)
where N is the number of line features in the polygonal model. The factor 1 / N allows deformed templates with different dimensionalities (number of boundary segments) to be directly compared. We note that the normalizing constant % is not necessarily independent of the deformation parameters 0 [29]. Exact computation of x2 involves an intractable summation of exp (U(@, Z)} with respect to Z . If this constant could be com-
This energy function is quite complicated. Fig. 8 shows two cross-sections of our energy function E(@, Z ) as a func-
tion of the parameters Y3 and Y5 (y-coordinates of two vertices on the deformed template). Notice that, the energy function contains several local minima. Thus, 0 ' cannot be determined using greedy gradient-based algorithms. To obtain a global minimum, we use the Metropolis algorithm
P11.
IEEE TRANSACTIONSON PATTERN ANALYSIS AND MACHINE INTELLIGENCE, VOL. 18, NO. 3, MARCH 1996
300
- 1- I81 8
'
-188"
"
66
68
70
' 72
"
74
76
"
78
SO
'
e
82
84
'
Y3
algorithm as many times as the number of classes. Our vehicle segmentation procedure is divided into five epochs, each epoch corresponding to a particular vehicle class (sedan, pickup truck, hatchback, station wagon or 4 x 4, and van). In each epoch, the Metropolis algorithm is started with an initial prototype template belonging to the vehicle class being considered and it iterates while constraining the deformations to remain in the same class. We examine the results of all five epochs and pick the deformation parameters whose energy is smallest among them. This approach has two advantages: 1) the five epochs can be executed in parallel, and 2) in addition to segmenting the vehicle in the lane closest to the camera, the algorithm is also able to classify the vehicle into one of five classes. 4.2 Temperature Schedule
-1.81
The temperature schedule Tk is a critical component of the Metropolis algorithm. The temperature schedule Tk = in (20) requires that we pick a sufficiently large
&
-1 87 -188
"
"
J
"
"
"
'
122 124 126 128 130 132 134 136 138 140 142 144 146
Y5
(b) Fig. 8. Cross-sections of the energy function along two parameters Y3 and Y5.
value of T. This choice is difficult, and familiar, for users of simulated annealing-if T is chosen too large, then the algorithm requires too many iterations for convergence, whereas if T is chosen too small, then the algorithm converges to a (0) local minimum relatively close to the starting position @ . Strenski and Kirkpatrick in [31] have studied temperafure schedules to restrict the number of iterations to be finite. They recommend a geometric temperature schedule: k
4.1 Metropolis Algorithm The Metropolis algorithm is a simulated annealing procedure. It minimizes the energy function E(@, Z ) by consfmct(1) ing a sequence of template deformations 0 , , ..., starting
dk)
from a prototype template @('), such that limk+ = 0'. At @+I) each iteration k, the algorithm determines a new value 0 of the deformation parameters, based on their current value (k) 0 . First a parameter set 6 is selected at random from the neighbors of and then @(k+l) is determined as
where To is the starting temperature, Tfis the final temperature, and Kmnr is the number of iterations. Fig. 9 shows the behavior of the geometric cooling schedule compared to the logarithmic schedule. It can be seen that in the geometric schedule, the temperature does not initially drop too rapidIy, but it approaches the zero value much faster. We find the geometric schedule to be suitable for our minimization problem, and so we adopt it. 10
L
4
logarithmic geometric ----~--.
9
where
8 7
&
5
c g
4 3
and T,is a monotonically decreasing sequence such that 1) for a sufficiently large T, and 2) lim, + Tk = T > -t log i 0. In this paper we deviate slightly from this prescription. For every k, we sequentially update each of the N compo(k) nents of 0 (see Table 2 ) . Since the vehicle class is not known a priori, and the constraint satisfaction function C(0) is different for the various vehicle classes, we chose to run the Metropolis
'\.,
2
-._
1
0 0
250
500
750 1 0 0 0 1250 1 5 0 0 1 7 5 0 2000 Number of iterations
Fig. 9. Comparison of the logarithmic and geometric temperature cooling schedules.
IEEE TRANSACTIONS ON PAl-rERN ANALYSIS AND MACHINE INTELLIGENCE, VOL. 18, NO. 3, MARCH 1996
iiJotion mask ,U,
Iteration 0 ( E = -0.9i’O)
Itcration 200 ( E = 2.296)
Iteration 400 ( E = 1.822)
Iteration GO0 ( E = -0.796)
Iteration 800 ( E = -1.579)
Iteration 1000 ( E = -1.814)
Iteration 1200 ( E = -1.777)
Iteration 1400 ( E = -1.884
Itcmtion 1600 ( E = -1.893)
Itcmtion 1800 ( E = -1.917)
Iteration 2000 ( E = -1.927
301
Fig. 10. Successive iterations of the segmentation algorithm.
Fig. 10 illustrates the evolution of the template as the number of iterations increases. The initial placement of the template is determined by the parameters B, B,, and Lo, which estimate the initial position of the baseline and the initial length of the vehicle. In the beginning, the temperature is relatively high, so the algorithm explores the space of template parameters even if the corresponding deformed templates do not satisfy the constraints and have a relatively high energy. As the temperature decreases, the constraints become satisfied, the outline of the template gets closer to the edges of the vehicle of interest, and the energy converges towards the global minimum. We do, however, experience some difficulties even with the geometric temperature schedule, particularly in choosing values for To and Kmx. We ran five epochs of the Me-
tropolis algorithm for 18 sets of parameters: To E {l.O, 2.0, 5.0, 10.0, 20.0,50.0), Tr= 0.01, and Kmx E (2000, 2500, 3000) on a particular image to observe the behavior of the algorithm. Figs. 11 and 12 show the resulting best deformed template, their vehicle class, and their corresponding energy function. It can be seen that the segmentation and classification results are strongly affected by the choice of To and Kmx. In 12 of the 18 cases, the vehicle was correctly classified as a van, but in two of those cases, the shape of the template is not very accurate. In the remaining six cases, the vehicle was mistaken for a sedan or a pickup truck. Unfortunately, the best set of values for To and ICmx varies with the input image. By studying the behavior of the algorithm on a number of images, we have noticed that the definition of the energy function is correct in the
302
Fig. 11. Results of
IEEE TRANSACTIONS ON P A n E R N ANALYSIS AND MACHINE INTELLIGENCE, VOL. 18, NO. 3, MARCH 1996
T" = 1.0.h' = 2000 E = -1.89.Sedan
To = 1.0, R = 2500 E = -1.88, Sedan
To = 10,li = 3000 E = -1 87, Plckup
TO = 2.0,K == 2000 E = -1.89;Sedan
7"= 2.0.K = 2500 E = -1.92. ]'an
To = 2.0,K = 3000 E = -1.91,Van
To = 5.0.K = 2000
To = 5.0;K = 2500
E = -1 91,\.'an
E = -1.89.Sedan
T0 : - d.0, K 3000 E = -1.92.Van
the Metropolis algorithm for different set of parameters.
sense that the global minimum of E(@, Z ) always corresponds to a deformed template which follows the contours of the vehicle. So, the problem lies with the sensitivity of the annealing algorithm to the parameters of the cooling schedule. To maximize the chances of finding the global minimum of the energy function, we run each epoch of the Metropolis algorithm with 18 different sets of cooling schedules and retain the template which has the minimum energy. Of course, this adds to the computational requirement of the algorithm. Table 2 summarizes our vehicle segmentation algorithm, and provides an overall picture of our simulated annealing procedure. The CPU time requirements (on a Sparcstation 20) for a 256 x 256 image are as follows. The motion detection takes 1 second for blurring, 0.3 seconds to compute and threshold the difference image, and 2.5 seconds to derive the motion mask, for a total of 3.8 seconds. The computation of the gradient magnitude and direction based on the Canny edge detector takes 3.5 seconds. Finally, each epoch of the deformable template algorithm takes 10 seconds for 2,000 iterations.
TABLE 2
VEHICLE SEGMENTATION ALGORITHM
fm7€{1.0,Z.O,5.0,10.0,20.0,50.0} fnr K, E {2wO,25W, 3000) fm C E ( W a n , Pickup truck, Hatchback, Station Wagon, Van) Select an initial set of template parametem Oca)in C Evaluate E(@'), Z ) Set k = 0
/* K,-
iterations of the Metropolis algorithm
*/
d&k