This study showed the application potentials of ballistic movement models for evaluating 3D movements. Keywords: 3D pointing, ballistic movements, Fitts' law, ...
Verification of ballistic movement models in a true 3D environment Jui-Feng Lin & Yi-Cheng Ho Department of Industrial Engineering & Management, Yuan Ze University, Taiwan
ABSTRACT: To provide an alternative methodology for evaluating individual differences and humancomputer interaction designs while performing three-dimensional (3D) movements, this study tested the application of ballistic movement models. In a darkened room, six participants conducted 3D ballistic movements of specific amplitudes using a personal computer, a self-developed laser emitter, and an electromagnetic tracking system. The measured data of movement time and movement end-point variability were utilized to test the ballistic movement time model and the ballistic movement variability model. The results showed that both the ballistic movement time model and variability model described well the measured data. This study showed the application potentials of ballistic movement models for evaluating 3D movements. Keywords: 3D pointing, ballistic movements, Fitts’ law, target acquisition, virtual reality 1 INTRODUCTION In our everyday living, we perform hand-control movements to accomplish a variety of operational goals. One of the most primitive movements is called the “self-paced aiming movement”, in which a human operator controls an object (such as a computer cursor or a stylus) to reach a target by moving a certain distance according to his/her own determined speed. Examples of these movements could be threading a needle or pointing Nintendo’s WiiRemote at the interface buttons on a TV screen. Regarding to these self-paced aiming movements, one of the most popular topics studied by researchers is the speed-accuracy tradeoff relationship. Faster movements always result in less accuracy; whereas, higher accurate movements require longer period of time to compensate. To predict this relationship while performing self-paced aiming movements, researchers have developed quantitative models for tasks conducted in a variety of conditions. 1.1 Fitts-type models To predict the speed-accuracy tradeoff relationship, Fitts’ law (1954) is the most popular model that have been applied for several decades. As shown in
Equations 1 and 2, Fitts’ law describes that the movement time ( ) increases according to the increased index of difficulty ( ID ), in which is movement amplitude and is target width.
ID log
(1) (2)
As shown in Equation 2, Fitts’ law was developed in a condition where only one-dimensional constraint of the target (i.e., ) was considered. Fitts’ law has been empirically validated for many different types of movements, manipulations, environments, and participant populations (see Plamondon and Alimi 1997, for a review). The effectiveness of Fitts’ law in predicting the speedaccuracy tradeoff relationship drives researchers to extend the model for multi-dimensional constraint targets. While performing aiming movements on a plane, it is reasonable to consider the effect of twodimensional constraint of a target. Several studies modified Fitts’ law for multi-dimensional constraint target acquisition. In additional to target width, MacKenzie and Buxton (1992) considered the effect of target height while the approach angle of an aiming movement toward a rectangular target. They proposed five potential forms of the shown in
Equation 2 and found that the SMALLER-OF model (smaller of width or height) and the ′ model (width along line of approach) fitted the data better. The SMALLER-OF model was later supported by Hoffmann and Sheikh (1994) who proposed a new Fitts-type model (Equation 3) for two-dimensional constraint target acquisition. max
,
(3)
where again, is movement time; and are experimentally determined variables, is the index of difficulty calculated in the movement direction and is the index of difficulty calculated perpendicular to the movement direction. Furthermore, Fitts’ law is also extended to model the three-dimensional constraints target acquisition. Based on MacKenzie and Buxton’s (1992) SMALLER-OF model, Ware and his colleagues (Ware and Balakrishnan 1994; Ware and Lowther 1997) proposed a modified ID, shown as Equation 4, to predict three-dimensional constraint aiming movements conducted in Fish Tank VR environments. log
, ,
1
(4)
where , , and are target width, target height and target depth, respectively. Although Fitts-type models are effective in describing the speed-accuracy tradeoff relationships while performing self-paced aiming movements at one-, two-, and three-dimensional constraint targets, the utilization of Fitts-type models has several limitations. First, as mentioned by Gan and Hoffmann (1988), Fitts’ law falls when is small than three. When pointing movements are with relatively short movement distances and large target size, Fitts’ law may not predict the speed-accuracy tradeoff relationship well. Second, the Fitts-type models introduced above lack of theoretical supports. MacKenzie and Buxton’s (1992) bivariate target model and Ware and Lowther’s (1997) trivariate target model were developed by including additional predictors to modify so that the experimental results could be fitted better. Hence, the models were not supported by the concepts of information theory originally applied to develop Fitts’ law. Finally, Fitts-type models cannot provide separated performance information of speed and accuracy while evaluating individual differences or device designs. The linear regression lines described by Fittts-type models are an overall result comprising the performance of speed and accuracy. While utilizing Fitts-type models for evaluations, it is difficult to determine the differences among regression lines were resulted from the difference of speed or the differ-
ence of accuracy. The limitations mentioned above encourage researchers to propose better methodologies for evaluation applications. 1.2 Ballistic movement models To study how ballistic movements are related to self-paced aiming movements, Lin and Drury’s (2011) verified two models for predicting twodimensional ballistic movements performed on a drawing tablet. The ballistic movement time model, as shown in Equation 5, predicts that the ballistic movement time ( ) is linearly related to the square root of ballistic movement distance ( ). (5) where and are experimentally determined constants. Furthermore, the ballistic movement variability model, as shown in Equation 6, predicts that the endpoint variability of a ballistic movement is linearly related to the square of ballistic movement distance ( ). (6) where g and are experimentally determined constants. Based on Equation 5, Equation 6 and the concepts of the general model (Lin et al. 2009), Lin and Drury (2010) demonstrated that how well a human operator can perform self-paced aiming movements is based on (1) the time required by him/her to perform ballistic movements (i.e., ballistic movement time) and (2) how accuracy he/she can perform ballistic movements (i.e., ballistic movement variability). Compared to self-paced pointing movements, ballistic movements are relatively essential to describe a human operator’s capability while performing hand-control movements. As mentioned above, the speed-accuracy tradeoff relationship described by Fitts’ law is a combination resulted from the property of ballistic movement time and the property of ballistic movement variability. To evaluate individual differences or device designs, ballistic movements could be a more representative experimental task to measure. 1.3 Research objective Since the ballistic movement models have been tested in a two-dimensional environment by Lin and Drury (2010), the purpose of this study was to further test the application of ballistic movement models in a true three-dimensional environment.
2 METHOD
2.2 Experimental setting and procedures
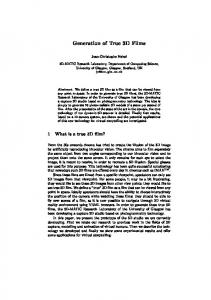
2.1 Participants and Apparatus Three male and three female graduate students, aged from 22-27 years, were recruited to participate in this study. The average heights of males and females were 174.7 cm and 164.3 cm, respectively. All of them were right-handed. A personal computer (PC) with a 17” (432 mm) LCD monitor was used to run Visual Basic using a self-designed experimental program that both showed the experimental tasks and measured task performance. To show the experimental tasks, a self-developed 3D ballistic movement execution device was utilized. As shown in Figure 1, the execution device consisted of a U-shape metal frame and a laser emitter control box. One horizontal laser emitter was affixed to the vertical rod of the U-shape metal frame and eight vertical laser emitters were affixed to the horizontal based. These laser emitters (JPMJ-AC, 532 nm green line, 5mW, LightVision Technology Corp.) emitted green laser beams that could be seen clearly in a darkened room. Each vertical laser beams were precisely adjusted to intersect with the horizontal laser beams, resulting in eight intersections with equal intervals of 50 mm. The first intersection, counted away from the participant, represented the start point of movements. The rest of the intersections indicated seven movement targets with different movement distances. Via a USB (universal serial bus) cable connected to the PC, the laser emitter control box controlled the switches of laser emitters according to the experimental program setup. To measure task performance, a 3D Guidance trakSTAR (Ascension Technology Corp.) was utilized to continuously measure movement positions in the 3D space. U-shape metal frame
Cross Target Start Point
Z X trakSTAR Sensor
Y Laser Emitter Control Box
Figure 1. ment.
3D Guidance trakSTAR
Executions of three-dimensional ballistic move-
To make laser beams easy to see, the experiments were conducted in a darkened room and the desktop background of the PC was set as black color. While conducting the experiment, as shown in Figure 1, participants stood in front of the 3D execution device and held a stylus in which a 1.5 mm magnetic position sensor was attached to the tip with a 330 cm cable. To perform ballistic movements, they controlled the stylus tip to move in the 3D space. The movements were all performed away from the body and toward the sagittal plane. The tasks started by placing the stylus tip at the start point and then moved rapidly toward the target point. Once the stylus tip was moved away from the start point, the laser emitters were turned off and the movement time started to record. When the movement stopped, the laser emitters were turned on and the information about the movement speed and the movement accuracy calculated in three dimensions were immediately displayed on the monitor screen. By moving the stylus tip back at the start point, the participants could continue on the next trail. 2.3 Experimental variables Independent variables of the experiment were ballistic movement distance and hand. The seven values of ballistic movement distance were 50, 100, 150, 200, 250, 300, and 350 mm. In a formal measurement, every movement distance was replicated 24 times, resulting in a total of 168 trials. All the trials were randomly conducted by each participant using one hand, taking about 15 minutes to finish. Totally, every participant used their hands in turns to perform four formal measurements. Before these formal measurements, there were two separate halfhour practices for each hand. Between two formal measurements, there was a 15 minutes rest to alleviate hand fatigue. Four dependent variables, comprising ballistic movement time, X error, Y error, and Z error, were automatically recorded by the experimental program after every completed experimental trial. As shown in Figure 1, X error was the longitudinal discrepancy between a ballistic movement endpoint and the target point. Y error and Z error were the perpendicular discrepancy between the endpoint and the target point. However, Y error was measured in horizontal direction and Z error was measured in vertical direction.
3 RESULTS 3.1 Ballistic movement time Analysis of variance was performed on the movement time, using a mixed model with Distance, Hand as fixed effects and Participant as random, in which the two-way, three-way interaction effects among these main effects were analyzed. The results showed significant main effects of Distance 101.41, 0.001), two-way interaction ( , effect of Participant Hand ( , 17.76 , 0.001), and three-way interaction effect of Participant Hand Distance ( 1.90 , , 0.01). These significant effects, as shown in Figure 2, explained that (1) the increased ballistic movement distance resulted in increased ballistic movement time, (2) the change of hands had different effects on ballistic movement time for individuals, and (3) the increase rates of movement time according to increased distance were different for participants while using different hands. 50
100 150 200 250 300 350 2
3
800 600 400 200
4
800
5
0
6
Hand Left Right
600 400 200 0 50
100 150 200 250 300 350
Panel variable: Participant
50
100 150 200 250 300 350
Ballistic M ovement Distance (mm)
Ballistic M ovement Time (milliseconds)
Figure 2. Three-way interaction effect of Participant Hand Distance. S R-Sq R-Sq(adj)
500
10.4232 99.4% 99.2%
400
300
3.2 Ballistic movement end-point variability The movement errors consisted of constant error and variable error. To analyze whether the independent variables had significant effects on these two types of errors, 48 replications of each experimental combination were calculated as the constant error and the variable error (measured by variance). However, only the results of variable error were discussed in this article. Analysis of variance was performed on three axes of variable errors, comprising X-variable error, Yvariable error, and Z-variable error, using a mixed model with Distance, Hand as fixed effects and Participant as random. Due to the limited degrees of freedom, only main effects were analyzed. As shown in Table 1, except that Participant did not have significant effect on X-variable error, all the independent variables had significant effects on three axes of variable errors. As shown in Figure 4, participants performed the movements with different end-point variability if it was measured in Y axis and Z axis. No matter which axis of variable error was analyzed, movements performed by left hand resulted in larger amplitudes of variance (see Figure 5). Furthermore, as shown in Figure 6, the increased ballistic movement distance resulted in increased ballistic movement end-point variability for all the three axes of errors. Table 1. The significant effects of independent variables on three axes of variable errors. Variable Error Effect X Y Z Participant * ** Hand * * ** Distance * *** *** Note: - ( p > 0.05), * (p < 0.05), ** (p < 0.01), *** (p < 0.001) 1
200
Y
2
3
4
5
6
Z
60 95% CI for the Mean 100
Movement Time = - 51.98 + 28.86 * Distance 0 6
8
10
12
14
16
18
20
Square Root of Ballistic M ovement Distance (mm^0. 5)
Figure 3. Relationship between ballistic movement time and the square root of ballistic movement distance.
Because of significant main effect of Distance was found, the test of Equation 5 could be performed. The means of ballistic movement time ( ) were regressed on to the square root of
End-Point Variability (mm^2)
Ballistic Movement Time (milliseconds)
1
) to give the slopes ballistic movement distance ( and intercepts. As shown in Figure 3 above, the model fitted the data very well. It accounted for 99.2 % variance of the overall participants’ data.
50 40 30 20 10 0 1
2
3
4
5
6
Participant Panel variable: Variable Error
Figure 4. Main effect of Participant on Y-variable error and Z-variable error.
End-Point Variability (mm^2)
140
95% CI for the Mean
120 100 80 60
4 DISCUSSION
40 20 0
Hand Error
Left
Right
L eft
X
Figure 5. rors.
Right
Left
Y
Right Z
Main effect of Hand on three axes of variable er-
160
Error X Y Z
End-Point Variability (mm^2)
140 120 100 80 60 40 20 0 50
100
150
200
250
300
350
Ballistic Movement Distance (mm)
Figure 6. errors. 180
Main effect of Distance on three axes of variable
Error X Y Z
160
End-Point Variability (mm^2)
ment distance resulted in increased end-point variability for all the three axes of variable errors. These rates of increase arranged from high to low were X-variable error, Z-variable error, and then Yvariable error.
140 120 100 80 60 40 20 0 0
20000
40000
60000
80000
100000
120000
The Square of Ballistic M ovement Distance (mm^2)
Figure 7. Relationship between three axes variable errors and the square of distance.
With Distance having significant effects on all the three axes of variable errors, Equation 6 could be tested for model fittings. Three axes error variances, calculate from the raw data for each distance, to give the slopes, interwere regressed on to cepts, and values. As shown in Figure 7 above, Equation 6 accounted for overall participants’ data well. It accounted for 96.6 % variance of Xvariable error, 92.2 % variance of Y-variable error, and 89.3 % variance of Z-variable error. As predicted by Equation 6, the increased square of move-
With a self-developed 3D ballistic movement execution device and a 3D Guidance trakSTAR, this study successfully measured ballistic movement time and ballistic movement end-point variability when participant performed ballistic movement in a true three-dimensional environment. As found in Lin and Drury (2011), the ballistic movement time ranged widely (150 – 500 milliseconds) than that reported by Gan and Hoffmann (1988) because of the wide range of values used as well as the experimental setup. We were surprised that the main effect of hand had no significant effect on movement time. Intuitively, our dominate hands should move faster than non-dominate hands. Since our participants were all right-handed, we expected the movements performed by right hands were faster (i.e., shorter movement times). However, as shown in Figure 2, only Participant 6 performed movements faster with his right hand. We speculated that the reason might be due to the training effect. Although every participant had the same practices for both hands before formal measurements, all the participants performed formal measurements with right hands first. The formal measurements with right hands might also improve the performance of left hand. However, the result was found different in movement end-point variability. As shown in Figure 5, it was clear that movements were performed better using right hands no matter which axis of variable error was considered. Furthermore, as shown in Figure 6, we found that the amplitude of Xvariable error was much larger than those of Yvariable error and Z-variable error. The difference between the longitudinal error (i.e., X-variable error) and the lateral errors (i.e., Y-variable error and Zvariable error) increased rapidly as the movement distance increased. This result was in line with Grossman and Balakrishnan (Grossman and Balakrishnan 2004) who reported that target size dimension along the primary axis of movement had a greater impact on performance than the other two dimensions. While comparing the other two lateral errors that both measured perpendicularly to the movement direction, the Z-variable error was about 1.8 times larger than as the Y-variable error. The testing of ballistic movement time model (i.e., Equation 5) showed that the model predicted
the relationship between ballistic movement time and the square root of ballistic movement distance very well. Equation 6 was originally tested by Gan and Hoffmann (1988) with aiming movements with small IDs and with short movement time (less than 200 milliseconds). In line with Lin and Drury (2011), this study verified Equation 6 was valid for the ballistic movements were performed even as long as 500 milliseconds. The testing of ballistic movement variability model (i.e., Equation 6) showed that the model predicted well the overall participants’ data, indicating that three axes of ballistic movement end-point variability were linearly related to the square of ballistic movement distance. With the experimental setup in this study, it was the first time that the three axes endpoint variability were modeled and compared while performing ballistic movements in a true three-dimensional environment. This preliminary study only demonstrated the application of ballistic movement models in a true three-dimensional environment. To show superiorities of the models, more independent variables, such as gender, movement angle, age, could be tested by using both ballistic movement models and Fitts-type models. Once the ballistic movement models are comprehensively validated, they could be utilized to measure individual differences and to evaluate the input devices and systems of vertical reality. 5 CONCLUSIONS The study tested the ballistic movement models for predicting movement time and three axes of movement end-point variability while performing ballistic movements in a true three-dimensional environment. Both ballistic movement time model and ballistic movement variability model predicted well the measured data, showing their application potentials. To demonstrate the models’ superiorities, compared to Fitts-type models, individual differences and different device designs could be tested with larger numbers of participants in future research. ACKNOWLEDGMENTS We would like to acknowledge the grant support from Taiwan National Science Council (NSC 992221-E-155-066) for funding the paper submission and presentation.
REFERENCES Fitts, P. M. 1954. The information capacity of the human motor system in controlling the amplitude of movement. Journal of Experimental Psychology 47:381-391. Gan, K. -C., and E. R. Hoffmann. 1988. Geometrical conditions for ballistic and visually controlled movements. Ergonomics 31:829-839. Grossman, Tovi, and Ravin Balakrishnan. 2004. Pointing at trivariate targets in 3D environments. In The SIGCHI Conference on Human Factors in Computing Systems. Vienna, Austria: ACM Press. Hoffmann, E. R., and I. H. Sheikh. 1994. Effect of varying target height in a Fitts' movement task. Ergonomics 36 (7):1071-1088. Lin, Jui-Feng, and C. Drury. 2010. Modeling Fitts' law. In The 9th Pan-Pacific Conference on Ergonomics. The Ambassador Hotel, Kaohsiung, Taiwan. Lin, Jui-Feng, C. Drury, M. Karwan, and V. Paquet. 2009. A general model that accounts for Fitts' law and Drury's model. In Proceedings of the 17th Congress of the International Ergonomics Association. Beijing, China. Lin, Jui-Feng, and Colin G. Drury. 2011. Verification of two models for predicting time and variability while performing ballistic movements. In The fourteenth International Conference on Human - Computer Interaction. Orlando, Florida, USA: Springer. MacKenzie, I. S., and W. Buxton. 1992. Extending Fitts' law to two-dimensional tasks. Proceedings of ACM CHI's 92 Conference on Human Factors in Computing Systems 7:219-226. Plamondon, R., and Adel M. Alimi. 1997. Speed/accuracy trade-offs in target-directed movements. Behavioral and Brain Sciences 20:279-349. Ware, Colin, and Ravin Balakrishnan. 1994. Reaching for objects in VR displays: lag and frame rate. ACM Transactions on Computer-Human Interaction 1 (4):331356. Ware, Colin, and Kathy Lowther. 1997. Selection using a oneeyed cursor in a fish tank VR environment. ACM Transactions on Computer-Human Interaction 4 (4):309322.