Verification of Cloud Dynamics and Radiation Database (CDRD) Passive Microwave Precipitation Retrieval Algorithm using TRMM Satellite Radar and Radiometer Measurements over Southern Mediterranean Basin Daniele Casella, Stefano Dietrich,
Eric A. Smith
Gregory J. Tripoli
Marco Formenton, Alberto
Center for Research on the
Dept. of Atmospheric and
Mugnai, Giulia Panegrossi,
Changing Earth System (CRCES)
Oceanic Sciences (AOS),
Paolo Sana
Tallahassee, FL, USA
University of Wisconsin. Madison, WI, USA
ISAC-CNR Rome, ITALY
[email protected] Abstract:
the Cloud
statistics indicate CDRD vis-a-vis 2a12 over-land improvements
Dynamics and Radiation Database (CDRD) rainfall algorithm
A
verification study is
conducted
for
of 78% and 14% in regards to mean error and rms error,
over the southern Mediterranean Basin (25-36°N / 25°W-45°E),
respectively.
based on TRMM Microwave Imager (TMI) passive microwave The
Keywords: CDRD Rainfall Algorithm Verification; Bayesian
CDRD's required synthetic database is generated from a high
(PMW)
brightness
temperature
(TB)
measurements.
Passive Microwave Precipitation Retrieval; Precipitation Regime
resolution, nonhydrostatic cloud resolving model equipped with a
Recognition; Meteorological Constraints;
precision RTE model.
Precipitation Retrievals
This dual modeling system is used to
TRMM TMI and PR
simulate numerous and precipitating storms over Europe and across the Mediterranean Basin as the database's foundation. Extracted from the simulations for the database are the a priori knowledge
variables involving
many
thousands of synthetic
INTRODUCTION
I.
The Cloud Dynamics and Radiation Database (CDRD)
their
passive microwave (PMW) precipitation retrieval algorithm is
This
based on the Bayesian physical approach and the Minimum
information provides the probability framework for the CDRD
Mean Square criterion (see [1]) in which the required synthetic a priori probability information resides in a large pre calculated database. The database is made up of thousands of
precipitating
microphysical-meteorological
concomitant
synthetic
multi-frequency
profiles
PMW
and
TBs.
algorithm's Bayesian inversion process and thus the means to relate measured solutions.
satellite TBs to the most probable rainfall
As the newest algorithm feature, the CDRD scheme
makes use of precipitation
meteorological systems,
parameters
obtained
from
(tags) of observed
global
NWP
model
synthesized initialization data, for both precipitation regime recognition and Bayesian retrieval constraints.
These two steps
effectively reduce non-uniqueness problems in obtaining retrieval solutions.
microphysical-meteorological profiles derived from numerous modeled precipitating storm simulations which are produced by a cloud resolving model (CRM) equipped with a radiative transfer equation (RTE) model system.
The latter is used to
calculate multi-frequency PMW brightness temperatures (TBs) that are linked in the database to their associated CRM profiles. One of the main barrier problems in conjunction with PMW
Comparison
of
TMI-based
CDRD
retrievals
to
coincident
TRMM Precipitation Radar (PR) retrievals, used as ground truth, provides the means to assess the algorithm's performance and the twofold use of meteorological tag information for control and constraint.
PR-retrieved cloud property parameters (e.g.,
freezing level) are also compared to NWP model tags to further verify algorithm design performance. The verification procedure utilizes a full year
(2010) of TMI and
PR measurements,
indicating CDRD over-ocean and over-land results are within 0.10 and 0.17 mm hr-l of the PR means, with accompanying 1.24 and 2.94 mm hr-l rms errors.
The CDRD algorithm is also
compared to the TRMM TMI facility exhibiting
slight
improvement
over
algorithm
water
(in
(2a12-v7), correlation
coefficient) and significantly improvement over land.
978-1-4673-1470-1112/$31. 00 ©2012 IEEE
Error
precipitation retrieval is solution ambiguity, stemming from the non-unique relationship between measured multi-frequency TBs and precipitation. CDRD
algorithm
is
The most important innovation of the the
introduction
dynamical-thermodynamical-hydrological
of
model-based
(DTH)
profile
variables that are common to both the CRM simulator and various independent numerical weather prediction (NWP) models that are used to produce optimally assimilated global datasets for operational weather predictions. DTH
profile
variables,
and
particularly
We find that the various
scalar
meteorological parameters (referred to henceforth as tags) diagnosed
from these variables, can be used to reduce ambiguity and to improve the concomitant rainfall retrievals.
The CDRD algorithm is described in [2].
This paper
l
•
0)700: Omega (vertical velocity) at 700 hPa [hPa S- ]
•
qA50: Vertical Moisture Flux SO hPa AGL [g m-2 S-I]
•
CAPE: Convective Available Potential Energy [J kg-I]
includes a critical analysis and verification of the algorithm using DMSP SSM/I and SSMIS satellite measurements for various case study events of convective and stratiform rainfall over Italy's Lazio region.
The algorithm performed very well
as ascertained by a calibration-quality Doppler-polarimetric C
For a detailed description of these parameter see [2] and [3].
band ground radar situated at the edge of Rome and within
800
observational view of the events. Herein we present the results of a further verification study of CDRD rainfall, and of the
700
reliability of using DTH-based tags for both precipitation
4500
regime recognition and Bayesian retrieval constraints.
600
The source of rainfall verification data and for additional cloud property parameters directly analogous to the invoked CDRD meteorological tags is the TRMM Precipitation Radar (PR).
CDRD retrievals are made using a year of TMI
4000
I
400
� 2500
300
Basin for which there is TRMM coverage (TRMM's orbit
UJ
3S0).
Concurrent
rainfall
retrievals
from
TRMM's latest PR facility algorithm 2A2S-v7 are used for verification,
i.e.,
to
statistical synthesis.
determine
error
quantities
and
8
3000
measurements (i.e., 2010) over the southern Mediterranean is
�
Cl
.�
inclination
500 �
� 3500 � i!:!
u.
2000
200
their
To assess CDRD algorithm improvement
1500
100
over existing PMW algorithm methodology, we examine the CDRD retrievals in counterpoint to those from TRMM's latest TMI facility algorithm 2a12-v7 -- referred to as GPROF.
1000
1500
2000
2500 PR
II.
DATASET DESCRIPTION
The Europe / Mediterranean Basin CDRD is made up of 60 simulations over the region 2S-7soN / 2soW-4soE for a one year period from March'06 through February'07 using the . Modeling System (NMS) [3] (a detailed
Nonhydrostatic
�
3000 3500 4000 Freezing Level (m1
4500
o
5000
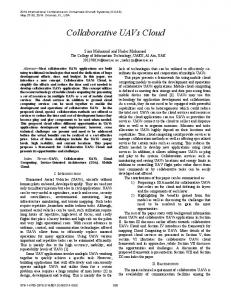
Figure I. Comparison ofHFL measured by PR and determined by NCEP/GFS over verification area for 20 I o. Colour scale indicates occurrence frequency.HFL quantities from NCEP/GFS model are interpolated spatiotemporally to consistently matchup with corresponding PR measurements.
descriptions of the database is included in [4D. The PR obtains measurements in the zone between 36°S-36°N.
throughout the year of 2010 over the area where the TRMM orbit overlaps the CDRD domain (this coincides with the Southern Mediterranean area 2S-36°N / 2S0W -4S0E). In this verification dataset, the PR surface rainfall measurements are considered ground truth. The PR profile measurements are also used to verity various tag parameters for selected cases. The observational DTH-based tags are obtained from the National
Centers
for
Environmental
Predictions/Global
Forecast System (NCEP/GFS) NWP initialization analyses and/or
3-hour
forecasts.
The
freezing
level
height
and
convective-stratiform classification of PR have been compared to the GFS freezing level and GFS-based classification of convective or stratiform clouds. GFS values are re-sampled spatiotemporally in order to obtain matches in space and time with TRMM observations. The PR precipitation measurements at SxS km spatial
krn (i.e., resolution of TMI's 8S GHz channel) using a Gaussian-shaped antenna function with a full width at half maximum (FWHM) equal to Sx7 km. This is done in order to take into account the ground pattern differences of the TMI and The verification dataset also includes surface rainfall
retrievals from the v7 GPROF algorithm, a new PR-trained TMI scheme. The latter measurements in conjunction with those
from
the
PR
are
used
in
order
to
define
precipitating/non-precipitating mask. The DTH-based tag parameters used for the study are: •
COMPARISON OF DTH-BASED TAG PARAMETERS
�
Fig. 1 illustrates a comparison of HFL measured b� the R and determined by the NCEP/GFS model over the venficatlOn area for all of 201O. Close agreement is evident; the mean error is -12.9 m while the rms error is
IIS.S m.
This result
demonstrates that the HFL determined by the NCEP/GFS model is a reliable tag for use in the CDRD retrieval algorithm. The other three tag parameters are more difficult to validate; 0)700,
qA50 and CAPE exhibit high spatial and temp�ral variability and thus special care must be taken in applymg space-time filters. Moreover, objective verification of these parameters is complex because no direct measurem�nts �e available from the PRo However, they can be used to ldentrfy convective
cloud
profiles
in
which
the
results
of
an
identification procedure can be compared to the PR-based convective-stratiform
(CS) classification
indices,
quantities
inherent to the TRMM PR facility algorithm group.
resolution are averaged to the CDRD product resolution of Sx7
PRo
III.
A verification
dataset is compiled from concurrent TMI and PR observations
HFL: Freezing Level Height [m]
the
This is relevant because CS categorization has become a valuable
component
of
precipitation
retrieval
algorithms,
including those based only on PMW observations.
Various
such algorithms use the standard deviations of TBs within grid boxes surrounding the retrieved precipitation values, or other quantities related to spatial variability; see [S] for a PMW algorithm which uses the standard deviations of the 8S GHv V pol TBs
(0"85V)
within SO-krn resolution grid boxes.
These
types of schemes presumes greater variability is indicative of stronger convection and vice versa. Fig. 2 shows an example of how DTH-based tags can be useful in discriminating the most convective portions of a cloud area. A PR-based CS categorization from a TRMM data swath near the northwest African coast (18 February 2010 at 07:36
UTC) is shown in the upper panel in which red shades indicate
they determine a final retrieval solution through weighted
the most likely convective precipitation areas while blue shades
averaging of the subset profiles (see [2]).
indicate the most likely stratiform areas. shows a TMI
The middle panel
O'S5Y map where green and red shades presumably
indicate regions of greatest convection. The ovals highlight the most variable areas; the green oval indicates the most probable area of strong and widespread convection. Notably, the PR CS indices compares well with the
O'S5YS within the green oval.
(i)700, qt.50 and CAPE
In precis, the CDRD algorithm uses
parameters provided by the NCEP/GFS model, in conjunction with TMI
0'8SVS,
to classify observed TMI pixels into three
precipitation regimes: (1) Convective, (2) Stratiform and (3) Undetermined.
The simulated database is classified as well
using equivalent synthetic
(i)700, qt.50 and CAPE DTH-based
tag parameters and the associated synthetic
0'8SV
parameter.
Retrieval is performed by first matching observed and synthetic regime classifications for each observed TMI pixel, a process which constrains the members allowed in a sweep 1 Bayesian influence profile subset. Second, within a given sweep I subset, the HFL parameter is applied as a single constraint in which profiles may only remain in a sweep 2 subset if they abide by the constraint rule [HFL - 400] :::; HFL :::; [HFL + 400].
A final
sweep 3 subset is generated from proximity tests with the multi-frequency TBs themselves, this final subset governing the precipitation profile solution through weighted averaging. �r-------�
�
�
15
�
rr. c
.� a: o
�
10
5
.:, �...
(.)
5 10 2A25-PR R,in R,I.
Figure 2. Top panel shows PR CS classification map for TRMM swath on 18 February 2010 at 0736 UTC near northwest African coast. Middle panel shows (J85V map from corresponding TMI observations. Bottom panel shows NCEP/GFS model's ClIq650 parameter,temporally interpolated between 0600 and 0900 UTC forecasts. [See text for further explanation.]
Nevertheless
using
this
parameter
alone
can
lead
15
(mmlhr(
15
� 2A25-PR Rain Rate
(mmlhr)
�
Figure 3. Over-land surface rain rate retrievals comparing PR and CORD algorithms (left panel) and PR and GPROF algorithms (right panel). All 2010 concurrent instantaneous rain rates are included from verification area. Colour scale indicates frequency of occurrence. Black diagonals are bisectors.
�.-------�
�.-------�
to
categorization errors due to large TB variations related to changes in surface emission and/or scattering. For example, as seen in the middle panel, the area highlighted by the rightmost red oval indicates elevated values of
0'85V
over the African 2A25-PR Rain Rate
coastal region, but no evidence of convection in the PR's CS classification map; additional mis-identification is found within
Figure 4.
the leftmost red oval to the west of the PR's indication of a cloud border.
O'S5YS
2, qt.50 improves CS classification. It appears, at least qualitatively, that the q�50 near-surface moisture flux map is the use of
better spatially correlated with the PR's CS classification map
0'8SV map,
and produces few false alarm errors over the
coastal landscape and western cloud border. IV.
[mmlhrJ
Same as Fig. 3 except for over water background.
V.
fail to elevate where the PR CS indices indicate
convection. However, as evident in the lower panel of Fig.
than the
2A25·PR Rain Rate
By the same token, there appears to be little
evidence of the opposing type of classification error in which the
(mmlhr]
USE OF TAG PARAMETERS IN CDRD ALGORITHM
The tag parameters defined in Section II are used in the CDRD algorithm's retrieval process to guide selection from the database of microphysical-meteorological profiles most likely representative of a given observed scene from a combined TB DTH measurement perspective. For a given observation, such profiles are referred to as a Bayesian influence profile subset;
A.
RESULTS
Full Comparison In Fig. 3-4, CDRD and GPROF surface rain rate retrievals
for 2010 over the verification area are compared to the corresponding PR retrievals.
Fig. 3 shows over-land results
while Fig. 4 shows over-water results.
The left panels of the
two figures contain scatter diagrams between the PR results on the abscissa and the CDRD results on the ordinate.
The right
panels show corresponding scatter diagrams between the PR results
and
the
GPROF
results.
The
comparisons
are
summarized statistically in Table 1. It is seen that over water, the CDRD algorithm performs slightly better than GPROF while over land the CDRD algorithm is clearly superior.
This analysis and the one below have been performed by separating land and water backgrounds because of the well known physical differences in how precipitation contrasts and
water,
and because
the GPROF
rainfall
product
..c
E �
is
comprised of two independent algorithms for land [5] and Both CDRD and GPROF algorithms exhibit better
e W
performance over water than over land (i.e., the rms error over
'"
water [6].
I-Cdrdl
5
itself to the differing emission and scattering properties of land
-0 Q)
land is more than twice that of over water) -- see Table 1.
" 0-
Ul
4.5
--2a12
4 3.5 3
'" 2.5 Q) c:
TABLE I.
VERIFICATION STATISTIC BETWEEN
CDRD AND GPROF.
:2 "0
2
0
t:r
rms Error
[mmhr-')
CDRD
GPROF
Land
2.94
3.42
Water
1.24
1.27
Land
0.17
0.78
[mmhr-')
Water
0.10
-0.11
Correlation
Land
0.59
0.54
Coefficient
Water
0.65
0.60
Mean Error
..c
0
4
2
6 month
8
10
12
6 month
8
10
12
1.5
E � g W -0 Q)
'"
drd C l I
" 0-
Ul
'" Q) :2 "0 c:
B.
1.5
Monthly Comparison
0.5
--
0
t:r
Fig. 5 shows that in a month-by-month framework of rms
0
0
error for both the CDRD and GPROF algorithms (rms error has
2
2a12
4
been calculated pixel by pixel with reference to the PR pixels), that the over-land rms errors for the CDRD algorithm are consistently lower than GPROF for all 12 months. Mean errors
Figure 5. Monthly variation of nms error of CDRD (red line) and 2a l 2 (black line) algorithms for over-land (upper panel) and over-water (lower panel).
are comparable for all 12 months. The large seasonal variation in error behavior is interesting.
The smallest mean error and
ACKNOWLEDGMENTS
largest rms error occur during the West African monsoon wet season where rain sampling is greatest.
Clearly, greater
sampling tends to improve the bias while
dispersing the
random scatter and thus worsening the precision.
VI.
This research has been supported by the EUMETSAT project
CONCLUSIONS
A comparison of the NCEP/GFS-based freezing
level height to that from PR retrievals shows close agreement
P. Sano, "The Cloud Dynamics and Radiation Database (CDRD) Approach for Precipitation Retrieval by Means of Satellite Based Microwave Radiometry", PhD. Dissertation, Dept. of Computer, Systems and Production Engineering, Tor Vergata University of Rome "Tor Vergata", 00173 Rome, ITALY, 165 pp., 2010.
[3]
D. Casella, "Analysis and Verification of the Cloud Dynamics and Radiation Database (CDRD) Methodology for Bayesian Retrieval of Precipitation with Passive Microwave Radiometer Instruments Onboard Satellites", PhD. Dissertation, Dept. of Science, Technical Infonmation and Communication, University of Rome "Sapienza", 00185 Rome, ITALY, 121 pp., 2010.
[4]
GJ. Tripoli, "A nonhydrostatic model designed to simulate scale interaction",Mon. Wea. Rev.,vol. 120,1342-1359,1992.
[5]
K. Gopalan, N.Y. Wang, R. Ferraro, C.T_ Liu, "Status of the TRMM 2AI2 land precipitation algorithm", J. Atmos. Ocean. Technol., vol. 27, n. 8,pp. 1343-1354,2010.
[ 6]
C.D. Kummerow, S. Ringerud, J. Crook, D. Randel, W. Berg, "An observationally generated a priori database for microwave rainfall retrievals", J. Atmos. Ocean. Technol.,vol. 28,n. 2,pp. 113-130,2011.
In continuation of
analyzed in comparison to the latest PR-2a25-v7 and TMI2a12-v7 (GPROF) TRMM facility algorithms. analysis
for
2010
over
the
southern
Mediterranean Basin for over-land retrievals indicates much better performance of the CDRD algorithm than the GPROF algorithm vis-a-vis the PR algorithm as verification standard based on significant reductions in both mean and rms errors (78%
and
14%,
respectively).
Over
to
[2]
verification studies, an entire year of TRMM data has been
Verification
Support
[I]
for a quantity varying from 1,000 to 5,000 m and helps support algorithm.
on
REFERENCES
algorithm to mitigate against non-uniqueness effects in retrieval
of the new
Facility
F.S. Marzano, A. Mugnai, G. Panegrossi, N. Perdicca,E.A. Smith and J. Turk, "Bayesian estimation of precipitating cloud parameters from combined measurements of space-borne microwave radiometer and radar," IEEE Trans. Geosci. Remote Sens.,vol. 37,pp. 593-613,1999.
NCEP/GFS model analyses are used in the CDRD precipitation
the design
Application
by the Italian Civil Protection Department.
In this study DTH-based meteorological tags obtained from
solutions.
"Satellite
Operational Hydrology and Water Management" (H-SAF) and
water,
the
algorithm performs slightly better in correlation terms.
CDRD These
results are encouraging in that the GPROF ocean module uses a database developed from a large set of PR cloud profiles [6], while the database developed for the CDRD algorithm is based strictly on CRM simulations and thus can be applied globally.