This is an open access article published under an ACS AuthorChoice License, which permits copying and redistribution of the article or any adaptations for non-commercial purposes.
Article pubs.acs.org/acssensors
Single-Step DNA Detection Assay Monitoring Dual-Color Light Scattering from Individual Metal Nanoparticle Aggregates Stéphanie Vial,† Youri Berrahal,† Marta Prado,‡ and Jérôme Wenger*,† †
Aix Marseille Univ, CNRS, Centrale Marseille, Institut Fresnel, Marseille, France International Iberian Nanotechnology Laboratory (INL) Avenida Mestre José Veiga, 4715-310, Braga, Portugal
‡
S Supporting Information *
ABSTRACT: Efficiently detecting DNA sequences within a limited time is vital for disease screening and public health monitoring. This calls for a new method that combines high sensitivity, fast read-out time, and easy manipulation of the sample, avoiding the extensive steps of DNA amplification, purification, or grafting to a surface. Here, we introduce photon cross-correlation spectroscopy as a new method for specific DNA sensing with high sensitivity in a single-step homogeneous solution phase. Our approach is based on confocal dualcolor illumination and detection of the scattering intensities from individual silver nanoparticles and gold nanorods. In the absence of the target DNA, the nanoparticles move independently and their respective scattering signals are uncorrelated. In the presence of the target DNA, the probe-functionalized gold and silver nanoparticles assemble via DNA hybridization with the target, giving rise to temporal coincidence between the signals scattered by each nanoparticle. The degree of coincidence accurately quantifies the amount of target DNA. To demonstrate the efficiency of our technique, we detect a specific DNA sequence of sesame, an allergenic food ingredient, for a range of concentration from 5 pM to 1.5 nM with a limit of detection of 1 pM. Our method is sensitive and specific enough to detect single nucleotide deletion and mismatch. With the dualcolor scattering signals being much brighter than fluorescence-based analogs, the analysis is fast, quantitative, and simple to operate, making it valuable for biosensing applications. KEYWORDS: DNA detection, optical scattering, metal nanoparticles, biosensing, dynamic light scattering, plasmonics
P
Metal NPs have thus attracted much attention for molecular biosensing, leading to DNA colorimetric assays that are detectable with the naked eye, although with a limited 10 nM sensitivity.14−16 Their ease of use involving a single mixing step makes them especially attractive.17−21 As another technique using metal NPs, local surface plasmon resonance (LSPR) monitors the spectral shift induced on the scattering or absorption spectrum induced by the presence of the analyte.22,23 However, the sensitivity and applicability of LSPR are limited by the small spectral shifts respective to the broad width of the plasmon resonance peaks. Recently, dynamic light scattering (DLS) and two photon photoluminescence (TPPL) have been introduced as detection techniques for NP-based DNA assays.24−26 In DLS, the presence of target DNA is revealed by an increase in the apparent average size of the nanoparticles.24,27−30 In TPPL, the target DNA reduces the distance between nanoparticles, increasing the plasmon coupling strength and enhancing the TPPL signal.26 Colorimetric, LSPR, DLS, and TPPL take
olymerase chain reaction (PCR) has made a significant stride for DNA sensing in bioanalysis and molecular biology.1,2 However, due to the several steps involved in the process, PCR is time-consuming and requires experienced personnel.3,4 Fluorescence-based devices5−7 (microarrays and molecular beacons) offer an alternative method to reach quantitative DNA detection, down to the single molecule level, and without the need for PCR amplification. Unfortunately, single molecule fluorescence-based techniques are limited by the weak signals and the poor photostability of typical fluorescent dyes. Fluorescent microbeads provide one approach to obtain an intense fluorescence signal, and are particularly relevant when the microbeads are color-coded and combined to a flow cytometry device for multiplexed detection as in Luminex assays.8 However, meeting the needs of future point-of-care biosensors still requires further simplification in the assay format, sample manipulation, and optical signal analysis.9 Noble metal nanoparticles (NPs) are another approach to obtain an intense optical signal thanks to their large absorption and scattering cross sections. Typically, the scattered intensity from a single metal NP can be 106 times higher than a bright fluorescent dye,10−13 and still feature a perfect photostability. © XXXX American Chemical Society
Received: November 16, 2016 Accepted: January 23, 2017 Published: January 23, 2017 A
DOI: 10.1021/acssensors.6b00737 ACS Sens. XXXX, XXX, XXX−XXX
Article
ACS Sensors
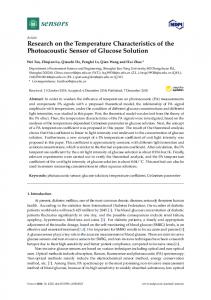
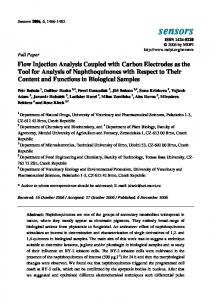
Figure 1. Principle of dual-color photon cross-correlation spectroscopy: the sample containing the probe metal nanoparticles is illuminated by two lasers at different wavelengths (blue and red). The resulting scattering signal is collected for both colors and compared to detect temporal coincidences between the detection channels. In the presence of the target DNA, nanoparticle probes A and B associate, yielding temporal coincidence between the detection channels as individual nanoparticle-DNA constructs are sampled across the femtoliter detection volume.
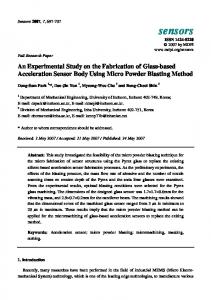
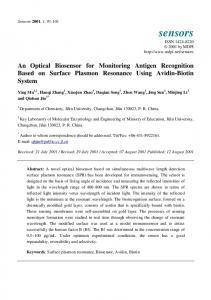
Figure 2. (A) Scanning electron microscope images of the AgNPs and AuNRs. (B) Scattering spectra of AgNPs (blue) and AuNRs (red) showing the local surface plasmon resonance. The 488 and 633 nm illumination and detection channels are also represented and are optimized to minimize cross-talk between channels. (C) Intensity time traces recorded for both detection channels on a solution containing only AgNPs (left) or AuNRs (right). The temporal coincidence K is strictly zero in this case after burst threshold detection has been applied. The horizontal dashed lines correspond to threshold of 80 counts per ms to remove the background noise and the small crosstalk between channels.
therefore call it photon cross-correlation spectroscopy (PhoCCS). Our results achieve a sensitivity of 1 pM without any DNA amplification by PCR, the detection is specific to a single nucleotide mismatch or deletion, and only a single mixing step is required in the process to put together the solution containing the DNA target and the NPs. Our approach is schematically represented in Figure 1. The detection of DNA relies on the self-assembly of two distinct scattering NPs (silver nanoparticles AgNPs and gold nanorods AuNRs) mediated via specific based pair recognition between single strand ss-DNA target and ss-DNA probes anchored to the NPs surfaces. Two focused laser beams with distinct wavelengths illuminate the sample solution containing the
advantage of the bright optical response of metal NP to detect DNA in a simple single-step workflow. However, all these techniques are based on ensemble averaging over a large number of nanoparticles and depend on the distance and the plasmon coupling between nanoparticles. To improve the sensitivity toward the picomolar regime and increase the detection speed, a flow cytometry approach interrogating each NP individually would be a preferable alternative to detect scarce NP aggregates and avoid ensemble averaging. Here, we introduce a novel technique for one-step detection of specific DNA sequences in homogeneous solution. Our approach is based on detecting the light intensity scattered by individual metal NP aggregates at two different wavelengths; we B
DOI: 10.1021/acssensors.6b00737 ACS Sens. XXXX, XXX, XXX−XXX
Article
ACS Sensors
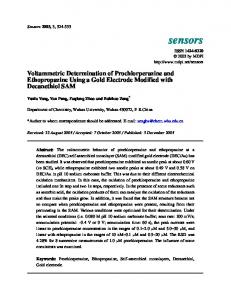
Figure 3. Representative intensity time traces and coincidence parameter K on AgNPs−AuNRs mixtures for three different concentrations of DNA target. The full trace duration is 200 s. Black dashed lines represent the threshold of 80 counts per ms to remove the background noise and the small crosstalk between channels. Only detection events above this level are considered in the computation of the coincidence parameter. UV−visible extinction spectra confirm that the synthesized NPs are well-dispersed with a plasmon band around 430 nm for AgNPs and a longitudinal plasmon band located at 630 nm for AuNRs (Figure S2). Nanoparticle Modification with DNA. Thiol-functionalized single-stranded oligonucleotides (probe A and probe B, 100 nmol) were reduced in 0.3 mL of 100 mM dithiolthreitol (DTT) solution in 10 mM of phosphate buffer (PB) (pH = 7.4), followed by 30 min incubation. The samples then were loaded onto a freshly purified sephadex column (NAP-5, GE Healthcare), and eluted with 2.5 mL 10 mM PB. The DNA was quantified by UV−vis spectrometry. The synthesized nanoparticles were functionalized with DNA. For each sample, an excess of 3000 purified DNA per nanoparticles was added to 1 mL of a purified water solution of nanoparticles (∼2 nM), and the mixture incubated in an unbuffered solution for at least 12 h. Then, 0.1% w/v sodium dodecyl sulfate and 10 mM concentration of PB were added to the mixtures, and left for 1 h at room temperature. Afterward, the salt concentration was stepwise increased to 0.01 M of NaCl, and the samples were incubated overnight. The solutions were freed of excess DNA by two consecutive centrifugations at 7000 rpm for 15 min and supernatant exchange. The DNA-NPs were well dispersed in 10 mM of phosphate buffer, pH = 7.4, and 0.1 M NaCl, and remained stable for at least one month. Before the DNA detection method, the salt concentration of both solutions was increased up to 0.5 M NaCl. Detection Assay. DNA detection was carried out at by adding 0.09 nM of each probe solution and different target DNA concentrations from 0.005 to 1.5 nM in a final volume of 100 μL of buffer containing 10 mM phosphate buffer, 0.5 M NaCl, pH = 7.4. All the hybridization assays were performed after 5 min heating at 95 °C followed by 30 min of incubation at 65 °C (a discussion about the effect of temperature and incubation time is presented in the Supporting Information Figure S3). A 10 μL drop was deposited on the surface of a glass substrate for analysis. Three separate experiments were performed for each concentration (n = 3). Optical Setup. Two-color illumination is obtained by combining the 488 nm laser beam of a Sapphire 488LP (Coherent) with the 633 nm beam of a helium−neon laser (Melles Griot 25LHP991) using broadband 50/50 cube beamsplitters (Figure S4). The beams are focused by a 16×/NA 0.5 objective (Zeiss Plan Neofluar) into the 10 μL droplet containing the sample. The scattered light is collected by the same objective and focused on 20 μm confocal pinholes optically conjugated to the focus spot. The detection on each channel is performed by two avalanche photodiodes (PerkinElmer SPCM-AQR13) after a 10 nm bandpass filter centered on the laser line (Thorlabs). The time trace is recorded with a ALV6000 acquisition card (ALV
nanoparticles. The nanoparticles have been carefully chosen so that each nanoparticle probe predominantly scatters lights at its respective wavelength. The scattered signal for each wavelength is measured by a photodetector after passing through a confocal pinhole to filter the off-focus scattered light. This dual-color confocal configuration allows monitoring the temporal evolution of the scattering intensities stemming from individual nanoparticles and their aggregates within a small 5 fL probe volume. In the absence of target, the NPs are moving independently and thus their respective scattering signals are uncorrelated on the two detectors. Upon addition of target DNA, AgNPs and AuNRs will become linked to each other, forming an aggregate.24 Therefore, AgNPs and AuNRs will diffuse simultaneously across the analysis volume, giving rise to temporal coincidences between the scattered signals. The level of correlation between channels then allows specific quantification of the amount of target DNA. We demonstrate the efficiency of PhoCCS by detecting a specific DNA sequence of sesame, an allergenic food ingredient, for a range of concentration from 5 pM to 1.5 nM with a limit of detection of 1 pM and a specificity to single nucleotide deletion or mismatch. Food allergies are considered by the WHO among the five most important public health concerns,31 and sesame (Sesamum indicum) allergens have been associated with particularly severe reactions with a high risk of anaphylaxis.32 The use of DNA markers to detect the presence of allergenic ingredients in food is advantageous due to their higher thermal stability and lower susceptibility to seasonal and geographical impacts than proteins.33,34
■
MATERIALS AND METHODS
Metal Nanoparticles. Silver nanoparticles and gold nanorods have been selected,12 and their synthesis is described in the Supporting Information. The silver nanoparticles AgNPs have a spherical shape with a diameter of 44 nm ± 5 nm, while the gold nanorods AuNRs have an average length of 47 nm ± 4 nm and an aspect ratio of 2.2 (Figures 2A and S1). The scattering spectra for pure solutions of each NP show that AgNPs scatter predominantly blue light (λmax = 430 nm), while AuNRs scatter red light (λmax = 630 nm) with negligible crosstalk between the 488 and 633 nm detection channels (Figure 2B). The aspect ratio for the gold nanorods is chosen so as to maximize the response at 633 nm while minimizing the cross-talk at 488 nm. The C
DOI: 10.1021/acssensors.6b00737 ACS Sens. XXXX, XXX, XXX−XXX
Article
ACS Sensors
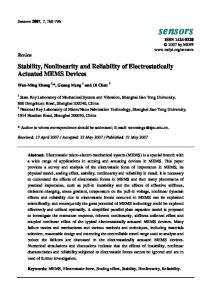
Figure 4. (A) Evolution of the measured coincidence parameter K (red dots) as a function of the target DNA concentration. All results are expressed as average ± standard deviation of 3 separated experiments (n = 3). (B) Determination of the limit of detection. The solid gray line indicates the level for the mean coincidence K in the absence of target DNA (K = 0.097), and the dashed line corresponds to this level plus 3 times the standard deviation (3 × 0.002 from n = 11 separated experiments). GmbH) with 40 ms binning time. The laser powers are set to get comparable signals on each channel; we use 200 nW at 488 nm and 700 nW at 633 nm. Coincidence Analysis. We define the coincidence parameter K as the ratio of the total number of simultaneous detection events on both channels to the total number of detection events (falling on either detector). As K is a ratio of the number of binary detection events, it is independent of the detected intensity and the size of the aggregate. With this definition, K is always between 0 and 1, and will be 1 for perfectly correlated signals and 0 for totally uncorrelated. The coincidence coefficient K is measured over a 200 s trace duration. We consider only the counts above about a threshold of 80 counts per ms to remove the background noise and the small crosstalk between channels.
The assembly between AgNPs and AuNRs upon mixing with target DNA is confirmed by three different independent methods, using scattering spectroscopy (Figure S5), scanning electron microscopy (Figure S6), and temporal crosscorrelation analysis (Figure S7). The signal loss when the temperature for DNA hybridization is elevated above 75 °C is another additional confirmation (Figure S3A). To quantify the amount of sesame DNA from the measured coincidence parameter, we perform a series of experiments with different known concentrations of target DNA from 5 pM to 1.5 nM (Figure 4). The measurements are taken after DNA hybridization at 65 °C for 30 min, which appeared to be optimum in our case (Figure S3). The temporal coincidence increased gradually with the DNA concentration (Figure 4A), empirically following a power law with 0.4 exponent in this concentration range. The limit of detection (LOD) is estimated by the intercept between this curve and the background level K = 0.097 plus three times the 0.002 standard deviation estimated from n = 11 separated experiments (dashed gray line in Figure 4B).36 We obtain a LOD of 1 pM for this work, and many parameters (NPs concentration, integration time) can be further optimized to reduce the LOD. Specificity of the DNA Detection. To examine the selectivity of the PhoCCS assay, we perform experiments using base-pairing defects targeting DNA:single base mismatches, single base deletions, and noncomplementary DNA sequences. Each single defect (mismatch and deletion) is located at the center of the specific recognition part of the target with probe A. The sequences of the targets are summarized in Table S2. 100 pM DNA is analyzed under the same conditions as above. Figure 5 compares the coincidence parameter K for each defect sequence with the results obtained for the control (no target) and for perfectly matched DNA. Without adding any supplementary preparation step, our data already show a clear decrease of the temporal coincidence when a single base defect is considered. The significant 8-fold drop of the standard deviation demonstrates the capability to detect single base mismatch or single base deletion. Additionally, noncomplementary DNA strands lead to K values similar to the control, since no hybridization to the probes occurred. As metal nanoparticles are used as scatterers, the optical signal in PhoCCS is bright and perfectly photostable, as opposed to fluorescence. Moreover, as we rely on coincidence events above a detection threshold, our approach is independent of the scattering intensity and the distance and orientation between nanoparticles. PhoCCS bears some
■
RESULTS AND DISCUSSION DNA Detection Assay. The concentration of NPs is set to 90 pM as evaluated by UV−visible spectrometry,35 to ensure that about 0.2 NPs are present in the detection volume on average. With this low number of particles inside the sampling volume, the scattering signal from individual NPs can be monitored as they cross the observation volume, giving rise to temporal bursts in the scattered intensity (Figure 2C). These traces again confirm that AgNPs respond predominantly in the blue detection channel, while AuNRs respond in the red channel. Importantly, the nearly negligible crosstalk (scattering of AgNPs into red channel and scattering of AuNRs into blue channel) can be totally suppressed after applying a threshold for burst detection, so that strictly no coincidence between channels is found for pure (AgNPs or AuNRs) samples. To validate the DNA detection assay, we focus on the detection of a specific fragment of sesame, an allergenic food ingredient. The sequences of the 68-mer ss-DNA target and 30mer ssDNA probes are given in the Supporting Information Table S1. Figure 3 shows representative intensity time traces recorded on both detection channels for a mixture of AgNPs and AuNRs, respectively, with no target (control), 0.1 nM and 1 nM of target. In the absence of target (control), the detected signals are only weakly correlated, with a residual coincidence parameter K = (9.7 ± 0.2) × 10−2 stemming from the spurious simultaneous presence of AgNPs and AuNRs in the confocal detection volume. The presence of the target allows the assembly of AgNPs and AuNRs through 25 base pairs hybridization between the recognition part of the probes and the target. The signals become correlated and the coincidence parameter K significantly increases above the background level. D
DOI: 10.1021/acssensors.6b00737 ACS Sens. XXXX, XXX, XXX−XXX
ACS Sensors
Article
■
CONCLUSION We have introduced a novel dual-color technique for one-step detection of specific DNA sequences in homogeneous assay, with a sensitivity of 1 pM and specificity to single nucleotide defects. The analysis of the light scattered by the solution is fast, quantitative, and simple to operate, making it valuable for bioapplications. The technique is straightforward to integrate toward point-of-care biosensors, and shows promising prospects for quantitative DNA detection and single nucleotide polymorphism analysis without requiring DNA amplification.
■
ASSOCIATED CONTENT
S Supporting Information *
Figure 5. Selectivity of the assay to single nucleotide mismatch or deletion: coincidence parameter K found for 100 pM of target with perfectly matched DNA target (sesame), with a single defect in the sesame sequence (one mismatched base, one deleted base) and with the noncomplementary part. The full sequences are given in Table S2. All results are expressed as average ± standard deviation of 3 separate experiments (n = 3).
The Supporting Information is available free of charge on the ACS Publications website at DOI: 10.1021/acssensors.6b00737. Nanoparticles synthesis, DNA sequences, scanning electron microscope images, UV−vis extinction spectra, influence of temperature and incubation time, scheme of the experimental setup, scattering spectra, temporal cross-correlation analysis (PDF)
■
conceptual similarity with fluorescence cross-correlation spectroscopy (FCCS),37−39 but with a much brighter and photostable signal enabling to improve both the signal-tonoise ratio and the sensitivity. The read-out is fast and can be done in a few seconds. Our detection is based only on the individual scattering responses of the NPs, and we have checked that the weak plasmonic coupling between the nanoparticles to shift the resonance has a negligible influence on our detection process (Figure S5). This is a strength of our method over LSPR or TPPL techniques as the readout is independent of the distance between nanoparticles. Additionally, the scattering spectra in Figure S5 show that the LOD for LSPR sensing using our constructs would be in the hundreds of picomolar. The use of two distinct color channels for illumination and detection and the confocal detection volume allows one to efficiently discriminate detection events to reach picomolar sensitivities even in the presence of a large number of nonaggregated NPs as an improvement over conventional DLS approach.24,29 Moreover, as we screen for the occurrence of temporal coincidence between bursts above a certain intensity threshold, our approach is not affected by the absolute scattered intensity and can accommodate a comparatively higher background and tolerance for size and shape dispersion among the nanoparticles. Importantly, the whole assay is performed in a single mixing step in solution phase. It does not require any washing or purification cycle. The readout can be performed immediately after DNA hybridization without further processing. Moreover, the hybridization is more efficient in the solution phase than on a planar surface. In addition, our approach works with very small sample volumes (10 μL used here). Much lower volumes can be used as the system is straightforward to integrate with microfluidic channels. This is a key advantage allowing reduction of the consumption of reagents and sample, which is highly valuable in the case of low and rare sample amounts. The detection can also be performed while a flux is applied to the solution so as to speed up the diffusion of the probes and accelerate the measurement acquisition time.
AUTHOR INFORMATION
Corresponding Author
*E-mail:
[email protected]. Phone: +33491288494. ORCID
Jérôme Wenger: 0000-0002-2145-5341 Notes
The authors declare no competing financial interest.
■
ACKNOWLEDGMENTS This project has received funding from the European Research Council (ERC) under the European Union’s Horizon 2020 research and innovation programme (grant agreement No 664738).
■
REFERENCES
(1) Wilhelm, J.; Pingoud, A. Real-Time Polymerase Chain Reaction. ChemBioChem 2003, 4, 1120−1128. (2) Liu, W.; Saint, D. A. A New Quantitative Method of Real Time Reverse Transcription Polymerase Chain Reaction Assay Based on Simulation of Polymerase Chain Reaction Kinetics. Anal. Biochem. 2002, 302, 52−59. (3) Dark, P. M.; Dean, P.; Warhurst, G. Bench-to-Bedside Review: The Promise of Rapid Infection Diagnosis during Sepsis Using Polymerase Chain Reaction-Based Pathogen Detection. Crit Care 2009, 13, 217. (4) Malorny, B.; Huehn, S.; Dieckmann, R.; Krämer, N.; Helmuth, R. Polymerase Chain Reaction for the Rapid Detection and Serovar Identification of Salmonella in Food and Feeding Stuff. Food Anal. Methods 2009, 2, 81−95. (5) Hu, R.; Liu, T.; Zhang, X. B.; Huan, S. Y.; Wu, C.; Fu, T.; Tan, W. Multicolor Fluorescent Biosensor for Multiplexed Detection of DNA. Anal. Chem. 2014, 86, 5009−5016. (6) Chao, J.; Li, Z.; Li, J.; Peng, H.; Su, S.; Li, Q.; Zhu, C.; Zuo, X.; Song, S.; Wang, L.; et al. Hybridization Chain Reaction Amplification for Highly Sensitive Fluorescence Detection of DNA with Dextran Coated Microarrays. Biosens. Bioelectron. 2016, 81, 92−96. (7) Zheng, J.; Yang, R.; Shi, M.; Wu, C.; Fang, X.; Li, Y.; Li, J.; Tan, W. Rationally Designed Molecular Beacons for Bioanalytical and Biomedical Applications. Chem. Soc. Rev. 2015, 44, 3036−3055.
E
DOI: 10.1021/acssensors.6b00737 ACS Sens. XXXX, XXX, XXX−XXX
Article
ACS Sensors (8) Dunbar, S. A. Applications of Luminex xMAP Technology for Rapid, High-Throughput Multiplexed Nucleic Acid Detection. Clin. Chim. Acta 2006, 363, 71−82. (9) Spindel, S.; Sapsford, K. E. Evaluation of Optical Detection Platforms for Multiplexed Detection of Proteins and the Need for Point-of-Care Biosensors for Clinical Use. Sensors 2014, 14, 22313− 22341. (10) Yguerabide, J.; Yguerabide, E. E. Light-Scattering Submicroscopic Particles as Highly Fluorescent Analogs and Their Use as Tracer Labels in Clinical and Biological Applications. Anal. Biochem. 1998, 262, 157−176. (11) Schultz, S.; Smith, D. R.; Mock, J. J.; Schultz, D. a. Single-Target Molecule Detection with Nonbleaching Multicolor Optical Immunolabels. Proc. Natl. Acad. Sci. U. S. A. 2000, 97, 996−1001. (12) Jain, P. K.; Huang, X.; El-Sayed, I. H.; El-Sayed, M. A. Review of Some Interesting Surface Plasmon Resonance-Enhanced Properties of Noble Metal Nanoparticles and Their Applications to Biosystems. Plasmonics 2007, 2, 107−118. (13) Zhu, S.; Yang, L.; Long, Y.; Gao, M.; Huang, T.; Hang, W.; Yan, X. Size Differentiation and Absolute Quantification of Gold Nanoparticles via Single Particle Detection with a Laboratory-Built HighSensitivity Flow Cytometer. J. Am. Chem. Soc. 2010, 132, 12176− 12178. (14) Elghanian, R.; Storhoff, J. J.; Mucic, R. C.; Letsinger, R. L.; Mirkin, C. A. Selective Colorimetric Detection of Polynucleotides Based on the Distance-Dependent Optical Properties of Gold Nanoparticles. Science 1997, 277, 1078−1081. (15) Storhoff, J. J.; Elghanian, R.; Mucic, R. C.; Mirkin, C. A.; Letsinger, R. L. One-Pot Colorimetric Differentiation of Polynucleotides with Single Base Imperfections Using Gold Nanoparticle Probes. J. Am. Chem. Soc. 1998, 120, 1959−1964. (16) Storhoff, J. J.; Lazarides, A. A.; Mucic, R. C.; Mirkin, C. A.; Letsinger, R. L.; Schatz, G. C. What Controls the Optical Properties of DNA-Linked Gold Nanoparticle Assemblies? J. Am. Chem. Soc. 2000, 122, 4640−4650. (17) Chen, J.; Wen, J.; Zhuang, L.; Zhou, S. An Enzyme-Free Catalytic DNA Circuit for Amplified Detection of Aflatoxin B1 Using Gold Nanoparticles as Colorimetric Indicators. Nanoscale 2016, 8, 9791−9797. (18) Yoo, S. M.; Lee, S. Y. Optical Biosensors for the Detection of Pathogenic Microorganisms. Trends Biotechnol. 2016, 34, 7−25. (19) Borghei, Y. S.; Hosseini, M.; Dadmehr, M.; Hosseinkhani, S.; Ganjali, M. R.; Sheikhnejad, R. Visual Detection of Cancer Cells by Colorimetric Aptasensor Based on Aggregation of Gold Nanoparticles Induced by DNA Hybridization. Anal. Chim. Acta 2016, 904, 92−97. (20) Du, B. A.; Li, Z. P.; Liu, C. H. One-Step Homogeneous Detection of DNA Hybridization with Gold Nanoparticle Probes by Using a Linear Light-Scattering Technique. Angew. Chem., Int. Ed. 2006, 45, 8022−8025. (21) Han, G.; Xing, Z.; Dong, Y.; Zhang, S.; Zhang, X. One-Step Homogeneous DNA Assay with Single-Nanoparticle Detection. Angew. Chem., Int. Ed. 2011, 50, 3462−3465. (22) Mayer, K. M.; Hafner, J. H. Localized Surface Plasmon Resonance Sensors. Chem. Rev. 2011, 111, 3828−3857. (23) Willets, K.; Van Duyne, R. Localized Surface Plasmon Resonance Spectroscopy and Sensing. Annu. Rev. Phys. Chem. 2007, 58, 267−297. (24) Dai, Q.; Liu, X.; Coutts, J.; Austin, L.; Huo, Q. A One-Step Highly Sensitive Method for DNA Detection Using Dynamic Light Scattering. J. Am. Chem. Soc. 2008, 130, 8138−8139. (25) Zheng, T.; Bott, S.; Huo, Q. Techniques for Accurate Sizing of Gold Nanoparticles Using Dynamic Light Scattering with Particular Application to Chemical and Biological Sensing Based on Aggregate Formation. ACS Appl. Mater. Interfaces 2016, 8, 21585−21594. (26) Yuan, P.; Ma, R.; Guan, Z.; Gao, N.; Xu, Q. H. Tuning TwoPhoton Photoluminescence of Gold Nanoparticle Aggregates with DNA and Its Application as Turn-on Photoluminescence Probe for DNA Sequence Detection. ACS Appl. Mater. Interfaces 2014, 6, 13149−13156.
(27) Gao, D.; Sheng, Z.; Han, H. An Ultrasensitive Method for the Detection of Gene Fragment from Transgenics Using Label-Free Gold Nanoparticle Probe and Dynamic Light Scattering. Anal. Chim. Acta 2011, 696, 1−5. (28) Miao, X. M.; Xiong, C.; Wang, W. W.; Ling, L. S.; Shuai, X. T. Dynamic-Light-Scattering-Based Sequence-Specific Recognition of Double-Stranded DNA with Oligonucleotide-Functionalized Gold Nanoparticles. Chem. - Eur. J. 2011, 17, 11230−11236. (29) Pylaev, T. E.; Khanadeev, V. A.; Khlebtsov, B. N.; Dykman, L. A.; Bogatyrev, V. A.; Khlebtsov, N. G. Colorimetric and Dynamic Light Scattering Detection of DNA Sequences by Using Positively Charged Gold Nanospheres: A Comparative Study with Gold Nanorods. Nanotechnology 2011, 22, 285501. (30) Seow, N.; Tan, Y. N.; Yung, L.-Y. L.; Su, X. DNA-Directed Assembly of Nanogold Dimers: A Unique Dynamic Light Scattering Sensing Probe for Transcription Factor Detection. Sci. Rep. 2015, 5, 18293. (31) Fæste, C. K.; Rønning, H. T.; Christians, U.; Granum, P. E. Liquid Chromatography and Mass Spectrometry in Food Allergen Detection. J. Food Prot. 2011, 74, 316−345. (32) EFSA Panel. Opinion of the Scientific Panel on Dietetic Products, Nutrition and Allergies on a Request from the Commission Relating to the Evaluation of Allergenic Foods for Labelling Purposes. EFSA J. 2004, 1−15. (33) Poms, R. E.; Klein, C. L.; Anklam, E. Methods for Allergen Analysis in Food: A Review. Food Addit. Contam. 2004, 21, 1. (34) Prado, M.; Ortea, I.; Vial, S.; Rivas, J.; Calo-Mata, P.; BarrosVelázquez, J. Advanced DNA- and Protein-Based Methods for the Detection and Investigation of Food Allergens. Crit. Rev. Food Sci. Nutr. 2016, 56, 2511. (35) Orendorff, C. J.; Murphy, C. J. Quantitation of Metal Content in the Silver-Assisted Growth of Gold Nanorods. J. Phys. Chem. B 2006, 110, 3990−3994. (36) Ma, W.; Kuang, H.; Xu, L.; Ding, L.; Xu, C.; Wang, L.; Kotov, N. A. Attomolar DNA Detection with Chiral Nanorod Assemblies. Nat. Commun. 2013, 4, 2689. (37) Koltermann, a; Kettling, U.; Bieschke, J.; Winkler, T.; Eigen, M. Rapid Assay Processing by Integration of Dual-Color Fluorescence Cross-Correlation Spectroscopy: High Throughput Screening for Enzyme Activity. Proc. Natl. Acad. Sci. U. S. A. 1998, 95, 1421−1426. (38) Winkler, T.; Kettling, U.; Koltermann, a; Eigen, M. Confocal Fluorescence Coincidence Analysis: An Approach to Ultra HighThroughput Screening. Proc. Natl. Acad. Sci. U. S. A. 1999, 96, 1375− 1378. (39) Wenger, J.; Gérard, D.; Lenne, P.-F.; Rigneault, H.; Dintinger, J.; Ebbesen, T. W.; Boned, A.; Conchonaud, F.; Marguet, D. Dual-Color Fluorescence Cross-Correlation Spectroscopy in a Single Nanoaperture: Towards Rapid Multicomponent Screening at High Concentrations. Opt. Express 2006, 14, 12206−12216.
F
DOI: 10.1021/acssensors.6b00737 ACS Sens. XXXX, XXX, XXX−XXX