2904 • The Journal of Neuroscience, February 18, 2015 • 35(7):2904 –2913
Behavioral/Cognitive
Vicarious Reinforcement Learning Signals When Instructing Others Matthew A.J. Apps,1,2,3 Elise Lesage,3,4 and Narender Ramnani3 1
Nuffield Department of Clinical Neuroscience, University of Oxford, Oxford OX1 9DU, United Kingdom, 2Department of Experimental Psychology, University of Oxford, Oxford OX1 2JD, United Kingdom, 3Department of Psychology, Royal Holloway, University of London, Surrey TW20 0EX, United Kingdom, and 4Neuroimaging Research Branch, Intramural Research Program, National Institute on Drug Abuse, National Institutes of Health, Baltimore, Maryland 21224
Reinforcement learning (RL) theory posits that learning is driven by discrepancies between the predicted and actual outcomes of actions (prediction errors [PEs]). In social environments, learning is often guided by similar RL mechanisms. For example, teachers monitor the actions of students and provide feedback to them. This feedback evokes PEs in students that guide their learning. We report the first study that investigates the neural mechanisms that underpin RL signals in the brain of a teacher. Neurons in the anterior cingulate cortex (ACC) signal PEs when learning from the outcomes of one’s own actions but also signal information when outcomes are received by others. Does a teacher’s ACC signal PEs when monitoring a student’s learning? Using fMRI, we studied brain activity in human subjects (teachers) as they taught a confederate (student) action–outcome associations by providingpositiveornegativefeedback.Weexaminedactivitytime-lockedtothestudents’responses,whenteachersinferstudentpredictionsandknow actual outcomes. We fitted a RL-based computational model to the behavior of the student to characterize their learning, and examined whether a teacher’sACCsignalswhenastudent’spredictionsarewrong.Inlinewithourhypothesis,activityintheteacher’sACCcovariedwiththePEvaluesinthe model. Additionally, activity in the teacher’s insula and ventromedial prefrontal cortex covaried with the predicted value according to the student. Our findings highlight that the ACC signals PEs vicariously for others’ erroneous predictions, when monitoring and instructing their learning. These results suggest that RL mechanisms, processed vicariously, may underpin and facilitate teaching behaviors. Key words: cingulate; fMRI; prediction error; reinforcement learning; social; teaching
Introduction In reinforcement learning (RL) theory, learning is driven by prediction errors (PEs) (Sutton and Barto, 1998), which occur when the outcome of an action is discrepant from that which is predicted. A wealth of research has found neurons that signal PEs when the outcomes of one’s own actions are unexpected (Rushworth et al., 2009). However, learning rarely occurs in a social vacuum. Often the learning of “students” is guided by feedback provided by a “teacher.” Such instructed learning is thought to be fundamental for the transmission of abstract, complex information between humans (Hoppitt et al., 2008). However, to date, there is no understanding of the neural or computational mechanisms that underpin teaching behaviors (Stanley and Adolphs, 2013; Garie´py et al., 2014; Ruff and Fehr,
Received Sept. 2, 2014; revised Dec. 17, 2014; accepted Dec. 27, 2014. Author contributions: M.A.J.A., E.L., and N.R. designed research; M.A.J.A. performed research; M.A.J.A. contributed unpublished reagents/analytic tools; M.A.J.A. and N.R. analyzed data; M.A.J.A., E.L., and N.R. wrote the paper. This work was supported by an ESRC 1⫹3 PhD Studentship to M.A.J.A., supervised by NR. We thank Ari Lingeswaran for help with MRI data collection; and Eden Hardmann and Arleta Woznica for acting as confederates. The authors declare no competing financial interests. This article is freely available online through the J Neurosci Author Open Choice option. Correspondence should be addressed to Dr. Matthew A.J. Apps, Nuffield Department of Clinical Neurosciences Level 6, West Wing,JohnRadcliffeHospital,OxfordOX39DU,UnitedKingdom.E-mail:
[email protected]. DOI:10.1523/JNEUROSCI.3669-14.2015 Copyright © 2015 Apps et al. This is an Open Access article distributed under the terms of the Creative Commons Attribution License (http://creativecommons.org/licenses/by/3.0), which permits unrestricted use, distribution and reproduction in any medium provided that the original work is properly attributed.
2014). Does the brain of a teacher process the learning of a student under the computational principles of RL theory? The anterior cingulate cortex (ACC) is well known for its role in social behavior (Singer et al., 2004; Ruff and Fehr, 2014). Lesions to the ACC disrupt the processing of social stimuli (Hadland et al., 2003; Rudebeck et al., 2006), neurons in the ACC are sensitive to rewarding stimuli that others will receive (Chang et al., 2013), and neuroimaging studies have shown that the ACC processes predictions about the value of others’ actions (Behrens et al., 2008; Jones et al., 2011; Zhu et al., 2012; Apps et al., 2013b; Boorman et al., 2013; Apps and Ramnani, 2014). In contrast, theories of ACC function suggest that it processes PEs relating to the outcomes of one’s own decisions, in a manner that conforms to RL principles (Amiez et al., 2005; Alexander and Brown, 2011; Hayden et al., 2011; Kennerley et al., 2011; Silvetti et al., 2014). How can these viewpoints be reconciled? It has been claimed that the ACC gyrus (ACCg) processes social information, but the computational principles that it instantiates parallel those of the adjacent ACC regions (Apps et al., 2013a). That is, the ACCg processes PEs about others’ actions. However, no previous study has examined whether PEs are processed in the ACCg when monitoring, understanding, and guiding the learning of others. Using fMRI, for the first time, we examine whether activity in the brain of a teacher can be characterized by the computational principles of RL theory when monitoring and guiding the trialand-error learning of a student. We examined activity in subjects
Apps et al. • Vicarious Reinforcement Learning Signals
J. Neurosci., February 18, 2015 • 35(7):2904 –2913 • 2905
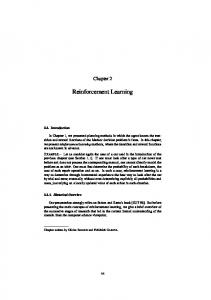
Figure 1. A, Trial structure. Participants performed trials as a teacher, guiding the associative learning of a student. Each trial began a with a green instruction cue (1 of 10 that the teacher had learnt the associations for during training), followed by the association cue informing the teacher of the correct response for the stimulus. This was displayed in the corner of the teacher’s screen. The corresponding corner of the student’s screen outside the scanner was covered, such that this cue was shown only to the teacher inside the scanner. Following this, the teacher saw the student’s response. They were required to indicate to the student whether this response was correct or incorrect. The teachers indicated their response on a keypad at the time of a screen where a pound coin (correct) or a crossed out pound coin (incorrect) was presented. Participants had to select the corresponding stimulus to deliver to the student. This stimulus was also presented in the corner of the screen, ensuring that the student could not see the teacher’s decision at that time. The chosen feedback was delivered to the student at the time of the outcome stimulus. B, Example model data. Plot of the data of the example output from the R-W model. In this example, the learning rate was set to 1 for clarity.
(“teacher”) whose role was to teach action– outcome contingencies to a confederate (“student”) by monitoring their responses and providing positive and negative feedback. Teachers had prelearnt the correct associations and therefore knew the actual value of each action. In addition, they could also model and simulate the students’ prediction of each outcome. Thus, the teachers could process a PE at the time of students’ actions. We fitted a RL-based computational model to student’s behavior and tested the hypothesis that activity in the ACCg of teachers would covary with PEs from the model at the time of students’ actions.
Materials and Methods Subjects. Sixteen healthy right-handed participants were screened for neurological, psychiatric, and psychological disorders (ages 18 –32 years; 10 female). One subject failed to complete the whole scanning session and was excluded from the analyses. Each subject was paired with one of three confederate participants, who they believed were a naive participant. All participants gave written informed consent. The studies were approved by the Royal Holloway, University of London Psychology Department Ethics Committee and conformed to the regulations set out in the CUBIC MRI Rules of Operation. The subjects were not paid for their participation but were given the incentive of receiving a picture of their brain for taking part. The subjects were informed that the other participant performing the task with them (the confederate) was being paid £5 for their participation because they were not being scanned, but that this payment was unrelated to task performance. Task design. Subjects performed a task in which they acted as a “teacher” providing a “student” (confederate) with positive or negative feedback. The student learned the associations between a set of 10 arbitrary instruction cues and one of four responses on a keypad. The teacher had prelearnt the same associations 1 d before scanning and was there-
fore able to determine whether an action chosen for a particular visual cue was correct or incorrect. The teacher’s task was to determine whether the student’s actions were correct or incorrect and then use a keypad of their own to deliver this feedback to the student. During the training, the teacher was required to learn the arbitrary stimulus–response associations between 10 instruction cues (colored shapes that gave no indication of which response was correct) and one of four motor responses by trial and error (Fig. 1). That is, there was only one correct response for each instruction cue ensuring that learning the correct association for one instruction cue was not informative as to the correct associations for any other instruction cue. There were 100 trials in total, with 10 presentations of each instruction cue. The instruction cues were presented in two blocks: five instruction cues in the first 50 trials and five in the last 50 trials. The cues were pseudorandomly presented in a predefined sequence (Fig. 1). A correct response was indicated by the presence of a picture of a one pound coin at time of the feedback screen and an incorrect response by a crossed out one pound coin. If the subjects did not respond within 750 ms of the trigger cue, feedback was displayed as “missed.” During the scanning session, the teacher monitored the student’s responses and provided them with feedback. The student learnt exactly the same associations as the teacher had learnt during the training session, with trials presented in the same order. The teachers were also informed of the identical nature of the trial structure. To maintain experimental control, we deceived teachers as to the nature of the student. Although the teachers believed they were performing the task with another genuine participant, the responses they saw were computer-generated and modeled on the behavior of a participant in the pilot training session. The students were drawn from one of three confederates. This approach was necessary to maintain control over the performance of the third person, such that the behavior of the other person was consistent across participants.
Apps et al. • Vicarious Reinforcement Learning Signals
2906 • J. Neurosci., February 18, 2015 • 35(7):2904 –2913
During the teaching task, the teachers saw two sets of information that were not presented to the student. First, on one screen, the teachers were reminded of the correct association on each trial before the student made a response (Fig. 1). This eliminated the possibility that trials would be lost or that the student’s learning would be compromised by poor performance of the teacher, as a result of the teacher’s failing to recall the correct association for each stimulus that they had learned in the previous session. It also ensured that participants were able to register the discrepancy between the student’s prediction and the actual value of their action, which is key to testing our a main hypothesis. Procedure: training session. Teachers were trained in two phases 1 d before scanning. In the first phase, the teacher was seated in front of a monitor, with a response keypad. This first phase of the training was designed to ensure that all teachers had learnt all the stimulus–response associations through trial and error. All teachers made at least two consecutive correct responses for the last two presentations of each instruction cue. All teachers had therefore learnt the correct associations for each stimulus. This enabled them to act effectively as a teacher during the scanning session. In the second part of the training session, the teacher was required to become familiar with their role as a teacher, and therefore, the task that they would perform in the scanner. During this session, the participant lay supine within a mock MRI scanner and provided positive and negative feedback to the experimenter outside the mock scanner. They practiced this role with the experimenter (see scanning session below) such that they became familiar with the task they would perform during the scanning session but were not teaching the student any information about associations that the student would need to learn in the scanning session (i.e., they learnt how to teach a student, without teaching the same student the same stimulus–response associations that would be later used during scanning). In this part of the training, exactly the same setup was used as during scanning, but with the experimenter taking the place of the student and only a reduced number of trials (20) were used. It is important to note that, given the requirement to maintain control of responses of the experimenter across subjects, the actions of the experimenter, as with the actual student, were actually a set of preprogrammed computer-controlled responses. Scanning session. Before the teacher entered the scanner, they were shown the student sitting in the MRI control room, in front of the monitor with a response keypad. The corner of the student’s screen was covered, allowing information to be presented to the teacher inside the scanner that the student was not presented with (see trial structure below for more details). Crucially, the teacher was made aware that they would have access to information in the corner of the screen that was not able to be seen by the student. By obscuring that corner of only the student’s screen (and not the teacher’s screen), it was also possible to present the teacher’s trigger cue and response to them without the student being able to observe this information. Hence, the teacher was also aware that the only feedback displayed to the student was that of a pound coin or a pound coin with a cross through it at the time of the final feedback. If the teacher failed to accurately indicate whether the response of the student was correct or incorrect, then the words “no feedback” were presented on the screen to the teacher and the student. This strategy ensured that teachers believed that the student was learning from the feedback that they were providing and ensured that they performed the task accurately. The teacher believed that the student was responding to the trials in real time, but indeed the trials were computer-controlled, and the profile of responses were based on those of a participant during a previous pilot experiment. This participant was chosen due to a fast learning rate (see behavioral modeling below) and also as they missed only three trials. These trials were also shown to the teacher, thus ensuring that the preprogrammed behavior of the student seemed genuine to the teacher. At the end of the scanning session, the participants were asked standard debriefing questions, as used in previous studies (Apps et al., 2012, 2013b; Apps and Ramnani, 2014), to ensure that they had maintained a full belief in the deception throughout the experiment. Specifically, we asked four yes/no questions after subjects had been debriefed: (1) Are you surprised to read that you were deceived on the task (yes/no)? (2) Did you believe that the
responses that you were observing were those of the other person (yes/ no)? (3) Did you believe the other person was learning the correct responses from your feedback (yes/no)? (4) Did you believe that the other person was learning the correct responses for the different shapes for the first time? (yes/no). A “no” response on question 1 or a “yes” response on questions 2– 4 would have led to exclusion from the experiment. Trial structure. The teachers’ trials consisted of an instruction cue (1 of the 10 that they had learnt associations for during training), immediately followed by the cue indicating the correct button (which reminded the teacher only, and not the student, of the correct association for that instruction cue), a student trigger cue and response (indicating to the teacher which response the student had made), a teacher trigger cue (to which the teacher pressed one button on a keypad for a correct student response and another for an incorrect student response, cued by the presence of a pound or coin or a crossed out pound coin switching pseudorandomly from left to right across trials) and then the feedback (indicating to the student whether the response was correct or incorrect) (Fig. 1). Computational modeling: behavioral modeling. The behavior of the student was modeled using a simple Rescorla-Wagner (R-W)-based reinforcement learning algorithm (Rescorla and Wagner, 1972), which has been extensively used to examine the behavioral and neural basis of arbitrary visuomotor associations (Dayan and Balleine, 2002; Schultz, 2006; Brovelli et al., 2008; Dayan and Daw, 2008). This model also bears considerable similarity to recent, influential models of ACC function (Alexander and Brown, 2011; Silvetti et al., 2014). As the aim of this study was to examine brain activity in teachers, we maintained experimental control by ensuring that all subjects observed the same learning behavior exhibited by the student. This requirement did not allow us to make comparisons between different computational models of behavior, as model comparison cannot be meaningfully applied to a single subject’s data. However, given the extensive use of the R-W model for associative learning tasks similar to that used here (Dayan and Daw, 2008), and the fact that most recent computational models of ACC function that we know of are underpinned by the same principles as an R-W model (Silvetti et al., 2014), this approach was more than sufficient for meeting the aims of this study. The R-W model assumes that the associative value of an action (or stimulus) changes once new information reveals that the actual outcome of a decision is different from the predicted outcome (Rescorla and Wagner, 1972). Thus, on each trial, an action has a predicted associative value that is updated by a PE signal when the outcome reveals that this prediction is erroneous. The evolution of the associative values for each action are given by the following:
V a 共 n⫹1 兲 ⫽ V a 共 n 兲 ⫹ x ␦
(1)
␦ ⫽ a ⫺ V a共n兲
(2)
Where:
In both Equations 1 and 2, n is the trial number, a ⫽ 1 ….k with k representing the available actions and is the learning rate. The asymptotic value () of a correct action is ⬎0 but is a free parameter that is estimated, and is 0 for an incorrect response. A PE is therefore the student’s prediction of its associative value 共Va 共 n 兲 兲 subtracted from the actual value of the action () known by the teacher. We instructed the students (and teachers on the first day) that one of the four finger movements could be correct for each instruction cue stimulus. Importantly, this also ensured that learning the correct association for one instruction cue was not informative as to the correct associations for any other instruction cue. Thus, the associative values of actions for one instruction cue were not informative as to the value of an action for another instruction cue. The initial associative strength of each action for each stimulus was set to /4, given the equiprobability of each of the four actions being correct. Model estimation. To model the action selection process of the student, we transformed the associative values into probabilities using the softmax equation. This method is a standard approach used in reinforcement learning theory (Sutton and Barto, 1981). The probability of the action chosen by a subject is given by the following:
Apps et al. • Vicarious Reinforcement Learning Signals
P a共 n 兲 ⫽
exp 共  V a 共 n 兲兲
冘
a
exp共Va 共n兲兲
J. Neurosci., February 18, 2015 • 35(7):2904 –2913 • 2907
(3)
This equation converts the associative values of the action chosen by a subject to a probability 共Pa 共n兲兲. The coefficient  represents the stochasticity (or temperature) of the student’s behavior (i.e., the sensitivity to the value of each option). A high  (⬎1) causes all actions to be nearly equiprobable, with a low  amplifying the differences in associative values. These two algorithms were used to model action selection by the student over time. The associative value the student placed on the chosen action (Va 共n兲) was then updated in the R-W model, based on the feedback. Crucially, in this study, the feedback was provided by a teacher (the subject being scanned). As the teacher had expert knowledge of all the associations and was informed of the correct action on each trial, they knew the asymptotic value () of each action chosen by the student. In this experiment, an aim was to examine whether the teacher modeled the learning of the student. It was therefore assumed that, to instruct the student, the teacher would have to calculate the discrepancy between the student’s prediction of the outcome 共Va共 n 兲 兲 and the asymptotic value () of the action chosen by the student. This asymptotic value would be known only by the teacher while the student would still be learning. Only when the student has learnt the correct stimulus–response associations for each cue would there be no discrepancy between the asymptotic value known by the teacher and the prediction made by the student. The aim of the teacher was therefore to provide the student with appropriate feedback to minimize the discrepancy between their own expert knowledge and predictions made by the student. Within the R-W model and the softmax algorithm, there are free parameters that need to be estimated. To identify the optimal set of free parameters for the student’s behavior (given the teacher’s feedback), the learning rate, the stochasticity parameter , and the asymptotic value were varied. The output of the softmax algorithm is a series of probabilities, based on the values of each of these parameters and the actions chosen by the student. By varying the parameters, the probabilities output by the softmax algorithm differ. To select the parameters that best fitted the student’s behavioral data (given the teacher’s feedback), a maximum likelihood approach was used. By using a maximum likelihood algorithm, it was possible to maximize the probabilities of the actions chosen by the student and identify the values of each of the parameters that produced them. The learning rate was varied between 0 and 1 in steps of 0.05,  between 0 and 5 in steps of 0.1, and between 0 and 5 in steps of 0.1. The likelihood of the chosen actions was found using the following:
L⫽
冘 n
In Pa 共n兲
(4)
where the likelihood of each set of parameters (L) is determined by the log of probability of the performed action (Pa 共n兲) of the student at trial n, according to the model. If the model perfectly predicts the actions, the probability of every chosen action would be 1 and L would be 0. As the probabilities become ⬍1, the log-likelihood L assumes negative values. The best fitting parameters were then selected using the following:
⬘ ⫽ arg max 共L兲
(5)
This identified the set of parameters for which L was closest to 0 (i.e., the best fitting parameter set), where is the parameter set and L is the log-likelihood. Importantly, in this study, the student’s data were computer-controlled; thus, every teacher observed the same responses of the student. Variations in these parameters could therefore only be explained by changes in the feedback (i.e., if the teacher failed to give the student feedback on a particular trial). If this happened, then those trials were removed from the modeling and, likewise, data at the time of the student’s response on those trials were removed from the fMRI analysis. The maximum likelihood approach revealed that, for the behavior of the student, the best fitting parameters were a of 1, a learning rate of 0.95, and a  value ranging from 2.3 to 2.7, reflecting the apparent differences in stochasticity of the behavior given the teacher’s feedback (Fig. 1).
Importantly, we used the behavior of a participant from a pilot experiment as the “student” behavior. This student had a high learning rate (0.95); thus, this ensured that any effects we observed in the ACCg could not be accounted for by teachers learning the learning rate of the student, as in Behrens et al. (2008). Apparatus. Subjects lay supine in an MRI scanner (3T Siemens Trio, CUBIC, Royal Holloway, University of London) with the fingers of the right hand positioned on an MRI-compatible response box. Stimuli were projected onto a screen behind the subject and viewed in a mirror positioned above the subject’s face. Presentation software (Neurobehavioral Systems) was used for experimental control (stimulus presentation and response collection). A custom-built parallel port interface connected to the Presentation PC received transistor-transistor logic pulse inputs from the response keypad. It also received transistor-transistor logic pulses from the MRI scanner at the onset of each volume acquisition, allowing events in the experiment to become precisely synchronized with the onset of each scan. The timings of all events in the experiment were sampled accurately, continuously, and simultaneously (independently of presentation) at a frequency of 1 kHz using an A/D 1401 unit (Cambridge Electronic Design). Spike2 software was used to create a temporal record of these events. Reaction times were calculated off-line, and event timings were prepared for subsequent GLM analysis of fMRI data (see Event definition and modeling). Functional imaging and analysis: data acquisition. Scans were acquired on a Siemens Trio 3T scanner. T1-weighted structural images were acquired at a resolution of 1 ⫻ 1 ⫻ 1 mm using an MPRAGE sequence. A total of 1016 EPI scans were acquired from each participant; 38 slices were acquired in an ascending manner, at an oblique angle (⬇30°) to the AC-PC line to decrease the impact of susceptibility artifact in subgenual cortex (Deichmann et al., 2003). A voxel size of 3 ⫻ 3 ⫻ 3 mm (20% slice gap, 0.6 mm) was used; TR ⫽ 3 s, TE ⫽ 32, flip angle ⫽ 85°. The functional sequence lasted 51 min. Immediately following the functional sequence, phase and magnitude maps were collected using a GRE field map sequence (TE1 ⫽ 5.19 ms, TE2 ⫽ 7.65 ms). Image preprocessing. Scans were preprocessed using SPM8 (www.fil. ion.ucl.ac.uk/spm). The EPI images from each subject were corrected for distortions caused by susceptibility-induced field inhomogeneities using the FieldMap toolbox (Andersson et al., 2001). This approach corrects for both static distortions and changes in these distortions attributable to head motion (Hutton et al., 2002). The static distortions were calculated using the phase and magnitude field maps acquired after the EPI sequence. The EPI images were then realigned and coregistered to the subject’s own anatomical image. The structural image was processed using a unified segmentation procedure combining segmentation, bias correction, and spatial normalization to the MNI template (Ashburner and Friston, 2005); the same normalization parameters were then used to normalize the EPI images. Last, a Gaussian kernel of 8 mm FWHM was applied to spatially smooth the images to conform to the assumptions of the GLM implemented in SPM8. Event definition and modeling (student response). Multiple GLM analyses were performed to investigate activity time-locked to the teacher’s observation of the student’s response. These were performed to ensure that activations identified could only be accounted for by the uniquely explained variance of a parameter in the R-W model. Although each of the GLMs differed from the others, they shared several common properties. Each GLM contained regressors modeling the instruction cue, the student response cue, the teacher trigger cue, and the feedback cue. Regressors were constructed for each of these events by convolving the event timings with the canonical hemodynamic response function. The effects of head motion were modeled in the analysis by including the six parameters of head motion acquired during preprocessing as covariates of no interest. In addition to these regressors defined for the event types, each GLM also contained regressors that were first-order parametric modulations of the student response cue event. These modulators scaled the amplitude of the hemodynamic response function in line with the a, Va, or ␦ parameters from the Rescorla-Wagner algorithm. The values of these parameters corresponded to the teacher’s valuation (a, the actual value of the action), the student’s prediction (Va, the student’s prediction of the value), and the PE (␦, the discrepancy between the student’s pre-
Apps et al. • Vicarious Reinforcement Learning Signals
2908 • J. Neurosci., February 18, 2015 • 35(7):2904 –2913
diction and the actual value), respectively. The PE could of course only be coded by the teacher at the time of the student’s action, as the student would not have known the actual value of the action when they are learning. When a trial was missed by the student or when teachers delivered erroneous feedback or failed to respond, these parameters were all assigned a value of 0. Two sets of analyses were conducted in this study to examine responses at the time of the student’s response: (1) Nine separate GLMs were created in which the values of one of , Va, and ␦ were used as first-order parametric modulators of the student response cues. These models enabled areas of the brain in which the BOLD response varied in the manner predicted by one of the parameters to be identified (see paragraph below). However, because of correlations between the values of these parameters in the R-W model and correlations due to these parameters being time-locked to the same event on each trial, additional analyses were required. To examine activity that covaried with the PE parameter, we created three GLMs. The first contained only the values of the ␦ parameter as a parametric modulation of the student response cues. The second contained as a parametric modulator, with the values of the ␦ parametric modulator orthogonalized with respect to the values . The third contained Va as a parametric modulator, with the values of the ␦ parametric modulator orthogonalized with respect to the values of the Va parameter. Voxels were only considered if they were significant in an F-contrast in all three of these GLMs. This approach was then repeated for the and Va parameters. Thus, nine GLMs were constructed to examine activity, which varied with the values from the parameters of the R-W model. It is important to note that typically one would orthogonalize the parameter of interest with respect to both of the other parameters, in one GLM. However, this was not possible in the present study because the PE parameter is a product of the other two parameters in the R-W model. Thus, orthogonalizing the PE (␦) parameter with respect to both of the other parameters in this model would have removed most of the variance that could be explained. The approach we have used provides a statistically conservative way to ensure that any variance that could be explained by the PE parameter is not due to its correlations with the student’s prediction parameter or the actual value (the teacher’s valuation). (2) To control for other possible responses in the ACC at the time of the student’s response, we created a GLM that contained alternative control parameters that varied with other plausible responses that were not components of the R-W model. The hypothesis of this study was that the ACC would signal a PE at the time of another’s action. In the R-W model, these PEs are “signed,” such that during learning a negative outcome results in a negative PE signal and a positive outcome results in a positive PE. However, it is notable that there is empirical data, and models of the ACC that suggest, that neurons in the ACC signal both signed and unsigned PEs (Matsumoto et al., 2007; Alexander and Brown, 2011; Kennerley et al., 2011). It was therefore crucial that we test the possibility that PEs in the ACC reflect not classical PE signals, as found in dopamine neurons in the midbrain but may reflect “unsigned” PEs that simply code for the magnitude of a PE and not whether it is positive or negative. We therefore created an unsigned PE parameter that covaried with the magnitude of ␦ but was always positive. Classical error detection accounts of the ACC suggest that the region has a generalized role in processing errors in information processing (Carter et al., 1998; Bush et al., 2000; Holroyd et al., 2004; Yeung and Nieuwenhuis, 2009), including the processing of errors that are elicited by the actions of others (Somerville et al., 2006; Shane et al., 2008; Yoshida et al., 2012). It is therefore possible that the ACC might have exhibited an unsigned and uniform magnitude signal whenever the student performed an incorrect action. To test this possibility, we created a parameter that took on a value of 1 whenever the student performed an incorrect action and 0 when there was no error. The error detection and unsigned PE parameters were fitted to the responses of the student and included in a GLM. In this GLM, the parameters were not orthogonalized with respect to each other, allowing them to compete to explain variance. This allowed us to determine which parameter best explained activity in the ACCg at the time of the student’s response. t tests were then conducted between them to test which parameter best explained activity in a given voxel.
Outcome event. In addition to the main analysis, we examined activity at the time of the outcome event. We used the same strategy as that used to examine activity at the time of the student’s response, namely, to fit the parameters from the model to the time of the outcome events. Examining activity at the time of the teacher’s response. While our design enabled us to examine activity at the time of the teacher’s response, it was suboptimal for asking questions about differences in how one’s own compared with others actions are processed in the brain. Thus, we did not compare activity between the student and teacher motor events nor examine covariations with the BOLD response with parameter from the RW model at the time of the teacher’s response. However, other studies have used tasks specifically designed to tackle such issues, which have nicely characterized responses in the brain comparing performing or observing actions (Ramnani and Miall, 2004; Burke et al., 2010). Second-level analysis. Random-effects analyses (full-factorial ANOVA) were applied to determine voxels significantly different at the group level. SPM {t}-images from all subjects at the first level were entered into second-level full-factorial design matrices. T-contrasts and F-contrasts were conducted in each of the GLMs. These contrasts identified voxels in which activity varied parametrically in the manner predicted by the parameters in the R-W model. Separate corrections for multiple comparison were used for the ACCg and the whole brain. To examine activity across the whole brain, FDR correction was applied. In contrast, activity in the ACCg was corrected for by using an 80% probability mask of the ACCg (see Anatomical localization). For the second set of analyses examining alternative models of ACC activity, the T-contrasts between the PE parameter and the control parameters were examined at a lower threshold. This was necessary because of the high covariance between each of these parameters. For these contrasts, a threshold of p ⬍ 0.01, uncorrected for multiple comparisons, was used. Individual differences in the brain of a teacher. It was possible that there may be individual differences in activity at the time of the student’s response, based on teacher’s own learning history. To test this, we input the learning rates from the R-W model, which were estimated on the choices of the teacher in the initial training session, as covariates of interest at the time of student’s response. Anatomical localization. To test our hypothesis, we used an 80% probability anatomical masks of the ACCg. To create each mask, subjectspecific masks of the ACCg were constructed in FSL (http://www.fMRIb. ox.ac.uk/fsl/). Although the cytoarchitectonic boundaries of the ACC have no corresponding gross anatomical landmarks, we defined the anatomical boundaries based on the location of these boundaries in previous literature investigating cingulate cytoarchitecture (Vogt et al., 1995). To define the posterior border of the midcingulate cortex, we used a boundary defined by a plane perpendicular to the AC-PC line that lay 22 mm posterior to the anterior commissure (Vogt et al., 1995). We included all voxels that lay within the ACCg extending anterior to this border, including subgenual cingulate cortex. The final ACCg mask included only voxels that were within the ACCg in 80% of our subjects. Importantly, this mask was of the ACCg only and did not extend into the adjacent sulcus.
Results Behavioral results The teacher’s task was to monitor the student’s responses, determine whether the response was correct or incorrect, and deliver this as feedback to the student. The student’s responses, unbeknown to the teachers, were computer-controlled replays of a real subject’s responses during a pilot experiment and included trials in which the student missed three trials (included such that the student’s responses seemed realistic); thus, teachers were required to respond on 97 trials. Teachers correctly gave feedback to the student on 95.2% (SD ⫾ 2.9; range: 91%–99%) of trials, indicating that all teachers understood the correct association for each stimulus and also understood whether the student’s responses were correct or incorrect. In addition, responses to a standardized set of questions revealed that none of the partici-
Apps et al. • Vicarious Reinforcement Learning Signals
J. Neurosci., February 18, 2015 • 35(7):2904 –2913 • 2909
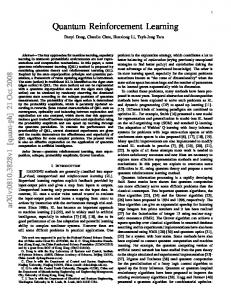
Figure 2. Student PEs in the brain of a teacher. A, Activity shown in the ACC time-locked to the student’s response in which activity covaried with the PE parameter from the R-W model on the mean anatomical image. B, Parameter estimates in the peak ACC voxel. Activity in this region correlated only with the PE parameter and not with the student’s prediction or the actual value of the outcome. Activity in this region also did not significantly covary with the unsigned PE parameter or a parameter that simply coded for student erroneous responses. Error bars indicate SEM. C, Peristimulus time histogram (PSTH) of activity time-locked to the student’s action in the brain of the teacher. Activity plotted for when the student’s prediction was erroneously positive (light green triangles) or erroneously negative (dark green circles). The values of the PE were taken from the R-W computational model. Error bars indicate SEM.
pants was aware of the nature of the deception. Thus, participants believed they were instructing another participants, and they were highly accurate at doing so. Imaging results: Student PEs in the brain of the teacher The main aim of this experiment was to examine activity in the brain of a teacher when they monitor the responses of a student. We tested the hypothesis that the ACCg would signal the discrepancy between a student’s prediction and the actual outcome known by a teacher: a student PE. In line with the hypothesis, activity was found in the ACCg (Fig. 2), putatively in midcingulate area 24a⬘/24b⬘, which varied significantly with the PE (␦) parameter of the R-W model (MNI coordinates (x, y, z) 2, 30, 12; Z ⫽ 3.17; p ⬍ 0.005 svc). Activity in this area was also better explained by the signed R-W PE parameter than by an unsigned PE parameter, or by a parameter in which simple response errors (see Materials and Methods) were modeled ( p ⬎ 0.01 uncorrected). No other region in the ACC, even at a reduced threshold, showed a significant covariation with the PE parameter ( p ⬎ 0.01 uncorrected). No portion of the ACC showed a significant effect of either the unsigned parameter or the parameter that modeled every erroneous response of the student, even at a reduced threshold ( p ⬎ 0.01). No region of the ACC showed a significant effect of the student prediction parameter or the actual value known by the teacher ( p ⬎ 0.01). No other brain area significantly varied with the PE parameter when correcting for multiple comparisons ( p ⬍ 0.05 FDR). At a reduced threshold, activity in an area consistent with the location of the ventral tegmental area (VTA) and the head of the caudate nucleus covaried with the PE parameter from the R-W model ( p ⬍ 0.005 uncorrected). Simulating the student prediction At the time of the student’s response, the predicted value according to the student could be modeled by the teacher. We examined whether activity in the brain of the teacher time-locked to the student’s action covaried with the student’s prediction parameter (Va(n)). Activity that varied significantly with this parameter was found in a portion of the ventromedial prefrontal cortex (VmPFC; ⫺14, 32, ⫺10, Z ⫽ 5.06, p ⬍ 0.05 FDR, putatively BA
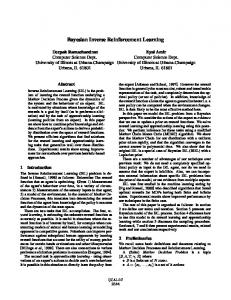
32) and in the right short insular gyrus (48, ⫺4, ⫺2, Z ⫽ 4.08 FDR, putatively area Idg; Fig. 3). These were the only regions in which the unique variance could be accounted for significantly by the predicted value according to the student. The teacher’s valuation At the time of the student’s action, the teacher knew the actual value of the student’s choice. We examined activity time-locked to the student’s choice that covaried with the actual value of the chosen action. Activity that varied statistically with this parameter was found in the superior frontal sulcus bordering BAs 8, 9, and 9/46 (⫺20, 32, 46; Z ⫽ 5.06, p ⬍ 0.05 FDR) and posterior cingulate cortex (⫺14, ⫺52, 32; Z ⫽ 5.57, p ⬍ 0.05 FDR) putatively in BA23. These were the only regions in which the variance could be uniquely and significantly accounted for by the actual value of the action known by the teacher. Individual differences in the brains of teachers To test whether activity at the time of the student’s response varied depending on the teacher’s own learning history, we examined whether activity covaried with the learning rates of the teachers in the initial training session. No areas of the brain covaried significantly when correcting for multiple comparisons. However, at a reduced threshold ( p ⬍ 0.001 uncorrected), we found activity in the three regions, including regions that also responded to the teacher’s valuation in bilateral superior frontal sulcus (MNI 26, 0, 42; Z ⫽ 4.4; ⫺34, ⫺2, 40; Z ⫽ 3.87), and in the posterior cingulate cortex (MNI ⫺14, ⫺22, 34; Z ⫽ 3.59), as well as in the intraparietal sulcus (MNI ⫺44, ⫺38, 50; Z ⫽ 4.05). However, these results should be interpreted with caution, given the low sample size for exploring individual differences and that the results are reported at an uncorrected threshold. Outcome events In addition to the main analysis, we also examined activity timelocked to the outcome event. Activity was not found to covary with any of the parameters from the model at the time of the outcome when correcting for multiple comparisons. However, activity was found to covary with PE parameter from the model in
2910 • J. Neurosci., February 18, 2015 • 35(7):2904 –2913
Apps et al. • Vicarious Reinforcement Learning Signals
Figure 3. Simulating the student prediction. Activity shown in the ventromedial prefrontal cortex (A) and the right short insula gyrus (B) covarying with the predicted value according to the student, taken from the R-W model. Plots of the parameter estimates from the peak voxel in the VmPFC (C) and the insula (D) for the PE, the student predicted value, and the actual value of the outcome known by the teacher. Parameter estimates for the predicted value parameter are for the unique variance explained by the regressor once orthogonalized with respect to the actual outcome parameter. Parameter estimates for the PE parameter and the actual outcome parameter are from regressors that have not been orthogonalized. Error bars indicate SEM. Peristimulus time histogram (PSTH) plots from the VmPFC (E) and the insula (F ) time-locked to the student’s prediction. Activity in these regions is broken down into low (⬍0.5) predicted value (light red triangles) versus high (⬎0.5) predicted value (dark red circles) according to the model. Error bars indicate SEM.
several areas, cerebellar lobule VI (MNI ⫺20, ⫺38, 34, Z ⫽ 4.05), VmPFC (MNI 10, 54, 12, Z ⫽ 3.92), the hippocampus (MNI 36, ⫺12, ⫺20), and the left temporal pole (MNI ⫺56, ⫺10, ⫺24; Z ⫽ 3.58), but only at a reduced threshold ( p ⬍ 0.001 uncorrected).
Discussion This study investigated activity in the brain of a teacher when monitoring a student’s responses, as the student learnt from feedback provided by the teacher. In line with our hypothesis, activity in a portion of the ACCg varied with PE values in a RL-based computational model. Activity in insula cortex and in the VmPFC varied with the predicted value of the action according to the student. These results suggest that the ACCg plays a specific role in signaling information about how erroneous another’s predictions about their actions are. In addition, we found that areas that are monosynaptically interconnected with the ACCg also play important roles in the processing of information about other people’s learning. Anatomical evidence supports the notion that the ACCg is sensitive to information that guides reinforcement learning. The ACCg receives direct input from dopaminergic neurons in the VTA (Williams and Goldman-Rakic, 1998). It has been well established that the firing properties of dopamine neurons in the VTA conform to the principles of RL. Specifically, they show an
increased spike frequency to unexpectedly positive outcomes, a decreased spike frequency to unexpectedly negative outcomes, and no activity change to predictable outcomes (Schultz and Dickinson, 2000; Schultz, 2006). As such, the VTA is thought to signal PEs in a manner that drives one’s own learning of rewarding outcomes. Interestingly, we found that the BOLD signal in the ACCg showed similar response characteristics. However, although it is well known that dopamine neurons signal this information for one’s predictions about the outcomes of one’s own decisions, we have shown that the ACCg processes, such as PE signals, when they pertain to others’ predictions and the outcomes of others’ actions as well. Anatomical evidence also supports the notion that the ACC processes social information. The portion of the ACCg that was activated in this study (in the gyral, midcingulate cortex) has strong connections to the posterior portions of the superior temporal sulcus, the temporal poles (Markowitsch et al., 1985; Seltzer and Pandya, 1989; Barbas et al., 1999), and the paracingulate cortex (Pandya et al., 1981; Vogt and Pandya, 1987; Petrides and Pandya, 2007). These three regions are thought to form a core circuit that is engaged when processing information about the mental states of others (Ramnani and Miall, 2004; Frith and Frith, 2006; Hampton et al., 2008). In addition, the ACCg has mono-
Apps et al. • Vicarious Reinforcement Learning Signals
synaptic connections to the portions of the insula and the VmPFC that were found to covary with the student’s prediction in this study (Mesulam and Mufson, 1982; Mufson and Mesulam, 1982; Morecraft et al., 1992; Cavada et al., 2000). Previous studies have shown that activity in the VmPFC, the insula, the posterior portions of the superior temporal sulcus, the paracingulate cortex, and the temporal poles covaries with parameters from RL-based computational models during other forms of social interactions (Ramnani and Miall, 2004; Behrens et al., 2008; Hampton et al., 2008; Baumgartner et al., 2009; Klucharev et al., 2009; Cooper et al., 2014; Garie´py et al., 2014). Thus, input from areas that appear to process information in a manner that conforms to the principles of RL during social interactions and the input from midbrain dopaminergic nuclei both highlight the ACCg as a candidate for processing PE signals relating to the behavior of others. Moreover, these results suggest that the ACCg may process information in concert with the VmPFC and the insula to vicariously process information about the predictions other people make when learning. Functional evidence also supports the claim that an overarching functional property of the ACCg is that it processes information about rewards during social interactions (Apps et al., 2013a). Lesions to the ACCg in monkeys disrupt the processing of social stimuli (Hadland et al., 2003; Rudebeck et al., 2006) by reducing the typical delay present when reaching for a rewarding stimulus in the presence of another monkey. In addition, single-unit recording studies have shown that a large proportion of neurons in the ACCg code for a reward that a conspecific will receive. Crucially, these neurons do not change their firing rate when an identical reward is to be received by oneself (Chang et al., 2013). Imaging studies have also shown that the ACCg signals the net value of rewards that others will receive (Apps and Ramnani, 2014), signals the unpredictibility of the relationship between another’s advice and the outcomes of another’s choices (Behrens et al., 2008) signals information about others during economic games, and signals when the outcomes of another’s actions are unexpected (Apps et al., 2013b). These results all support the view that the ACCg signals information relating to reward-based decisions during social interactions. However, the new contribution that our study makes is to show that the ACCg processes information at the time of others’ actions and does so when a subject’s behavior is aimed at guiding another’s learning. It has been argued that there are two major social frames of reference within which brain areas process social information. Although some areas process information when inferring the intentions and mental states of other people (“other” reference frame), other regions process information when updating one’s own behavior based on other’s intentions or behavior (“self” reference frame) (Hunt and Behrens, 2011; Ba´ez-Mendoza and Schultz, 2013; Ba´ez-Mendoza et al., 2013; Chang, 2013; Chang et al., 2013). Understanding the reference frames present in a task is therefore important for understanding the frame of reference within which a region, in this case the ACCg, processes social information. In this task, subjects were monitoring the learning of others to provide them with feedback. Importantly, the design of the task ensured that participants were not processing information about the relationship between their own actions and the reward they would receive themselves. Rather, they were processing information about the erroneous predictions of another. Interestingly, this supports recent claims that the ACCg (areas 24a⬘/ 24b⬘) may indeed act as a nexus between these two frames of reference (Hunt and Behrens, 2011; Apps et al., 2013a). Specifically, it has been claimed that the area is engaged when processing
J. Neurosci., February 18, 2015 • 35(7):2904 –2913 • 2911
information about (1) the rewards that others will receive, based on one’s own or others’ actions, and (2) others’ predictions about rewards, when others’ predictions can be used to guide one’s own behavior (Apps et al., 2013a). Our results support this claim by showing that the ACCg processes the erroneous predictions of others (i.e., inferring information about others), in order that a subject can provide them with feedback (i.e., updating one’s own behavior based on another’s intentions). Thus, the ACCg appears to process information in a way that acts as a nexus between the two major social reference frames. The functional and computational properties of the whole ACC are still under considerable debate; however, one common feature of several recent accounts of the ACC is that they are underpinned by similar computational principles to those of RL theory (Yeung and Nieuwenhuis, 2009; Silvetti et al., 2014). Several theories of ACC function have recently been developed that account for a diverse range of single-unit recording, EEG and fMRI data. The Silvetti et al. (2014) reward-value and prediction model and Alexander and Brown’s (2011) predicted-response outcome model both argue that the ACC acts as a “critic,” learning the value of stimuli or actions through PE signals. Similarly, Shenhav et al.’s (2013) expected value of control model is based around the notion that the ACC signals the value of the amount of cognitive control that will be required and updates this valuation when an outcome suggests this is required. Each of these models relies upon PE signals updating predictions. These models are largely supported by empirical evidence reporting from activity in areas 24c⬘/32⬘, which lie in the sulcus of the ACC, a different region of the ACC from that found of this study. The area we identified was in the ACCg in areas 24a⬘/24b⬘. Thus, in line with other recent studies (Apps et al., 2013b; Boorman et al., 2013), our research has shown that this region may also process PEs, a key component of RL-based models and also of computational accounts of other ACC regions. Whether this PE is signaled by neurons that also signal fictive PEs (PEs for the outcomes of unchosen actions) that have been found in the ACC (Hayden et al., 2009) is yet to be determined. However, our results suggest that, although the ACCg may have a degree of specialization for social information processing, the computational principles that govern its operation are similar to those of other regions of the ACC. In conclusion, this study provides the first characterization of the neural and computational processes that may operate in the brain of a teacher as they deliver reinforcement to a student. Our findings highlight a novel PE processed in the ACCg of a teacher that may play a key role in signaling the degree to which students’ predictions are erroneous. Furthermore, our findings suggest that areas previously implicated in RL for oneself may also be important for vicariously processing and understanding the learning of others.
References Alexander WH, Brown JW (2011) Medial prefrontal cortex as an action– outcome predictor. Nat Neurosci 14:1338 –1344. CrossRef Medline Amiez C, Joseph JP, Procyk E (2005) Anterior cingulate error-related activity is modulated by predicted reward. Eur J Neurosci 21:3447–3452. CrossRef Medline Andersson JL, Hutton C, Ashburner J, Turner R, Friston K (2001) Modeling geometric deformations in EPI time series. Neuroimage 13:903–919. CrossRef Medline Apps MA, Ramnani N (2014) The anterior cingulate gyrus signals the net value of others’ rewards. J Neurosci 34:6190 – 6200. CrossRef Medline Apps MA, Balsters JH, Ramnani N (2012) The anterior cingulate cortex: monitoring the outcomes of others’ decisions. Soc Neurosci 7:424 – 435. CrossRef Medline
2912 • J. Neurosci., February 18, 2015 • 35(7):2904 –2913 Apps MA, Lockwood PL, Balsters JH (2013a) The role of the midcingulate cortex in monitoring others’ decisions. Front Neurosci 7:251. CrossRef Medline Apps MA, Green R, Ramnani N (2013b) Reinforcement learning signals in the anterior cingulate cortex code for others’ false beliefs. Neuroimage 64:1–9. CrossRef Medline Ashburner J, Friston KJ (2005) Unified segmentation. Neuroimage 26:839 – 851. CrossRef Medline Ba´ez-Mendoza R, Schultz W (2013) The role of the striatum in social behavior. Front Neurosci 7:233. CrossRef Medline Ba´ez-Mendoza R, Harris CJ, Schultz W (2013) Activity of striatal neurons reflects social action and own reward. Proc Natl Acad Sci U S A 110: 16634 –16639. CrossRef Medline Barbas H, Ghashghaei H, Dombrowski SM, Rempel-Clower NL (1999) Medial prefrontal cortices are unified by common connections with superior temporal cortices and distinguished by input from memory-related areas in the rhesus monkey. J Comp Neurol 410:343–367. CrossRef Medline Baumgartner T, Fischbacher U, Feierabend A, Lutz K, Fehr E (2009) The neural circuitry of a broken promise. Neuron 64:756 –770. CrossRef Medline Behrens TE, Hunt LT, Woolrich MW, Rushworth MF (2008) Associative learning of social value. Nature 456:245–249. CrossRef Medline Boorman ED, O’Doherty JP, Adolphs R, Rangel A (2013) The behavioral and neural mechanisms underlying the tracking of expertise. Neuron 80:1558 –1571. CrossRef Medline Brovelli A, Laksiri N, Nazarian B, Meunier M, Boussaoud D (2008) Understanding the neural computations of arbitrary visuomotor learning through fMRI and associative learning theory. Cereb Cortex 18:1485– 1495. CrossRef Medline Burke CJ, Tobler PN, Baddeley M, Schultz W (2010) Neural mechanisms of observational learning. Proc Natl Acad Sci U S A 107:14431–14436. CrossRef Medline Bush G, Luu P, Posner MI (2000) Cognitive and emotional influences in anterior cingulate cortex. Trends Cogn Sci 4:215–222. CrossRef Medline Carter CS, Braver TS, Barch DM, Botvinick MM, Noll D, Cohen JD (1998) Anterior cingulate cortex, error detection, and the online monitoring of performance. Science 280:747–749. CrossRef Medline Cavada C, Compan˜y T, Tejedor J, Cruz-Rizzolo RJ, Reinoso-Sua´rez F (2000) The anatomical connections of the macaque monkey orbitofrontal cortex: a review. Cereb Cortex 10:220 –242. CrossRef Medline Chang SW (2013) Coordinate transformation approach to social interactions. Front Neurosci 7:147. CrossRef Medline Chang SW, Garie´py JF, Platt ML (2013) Neuronal reference frames for social decisions in primate frontal cortex. Nat Neurosci 16:243–250. CrossRef Medline Cooper JC, Dunne S, Furey T, O’Doherty JP (2014) The role of the posterior temporal and medial prefrontal cortices in mediating learning from romantic interest and rejection. Cereb Cortex 24:2502–2511. CrossRef Medline Dayan P, Balleine BW (2002) Reward, motivation, and reinforcement learning. Neuron 36:285–298. CrossRef Medline Dayan P, Daw ND (2008) Decision theory, reinforcement learning, and the brain. Cogn Affect Behav Neurosci 8:429 – 453. CrossRef Medline Deichmann R, Gottfried JA, Hutton C, Turner R (2003) Optimized EPI for fMRI studies of the orbitofrontal cortex. Neuroimage 19:430 – 441. CrossRef Medline Frith CD, Frith U (2006) The neural basis of mentalizing. Neuron 50:531– 534. CrossRef Medline Gabay AS, Radua J, Kempton MJ, Mehta MA (2014) The Ultimatum Game and the brain: A meta-analysis of neuroimaging studies. Neurosci Biobehav Rev 47:549 –558. CrossRef Medline Garie´py JF, Watson KK, Du E, Xie DL, Erb J, Amasino D, Platt ML (2014) Social learning in humans and other animals. Front Neurosci 8:58. CrossRef Medline Hadland KA, Rushworth MF, Gaffan D, Passingham RE (2003) The effect of cingulate lesions on social behaviour and emotion. Neuropsychologia 41:919 –931. CrossRef Medline Hampton AN, Bossaerts P, O’Doherty JP (2008) Neural correlates of mentalizing-related computations during strategic interactions in humans. Proc Natl Acad Sci U S A 105:6741– 6746. CrossRef Medline Hayden BY, Heilbronner SR, Pearson JM, Platt ML (2011) Surprise signals in anterior cingulate cortex: neuronal encoding of unsigned reward pre-
Apps et al. • Vicarious Reinforcement Learning Signals diction errors driving adjustment in behavior. J Neurosci 31:4178 – 4187. CrossRef Medline Hayden BY, Pearson JM, Platt ML (2009) Fictive reward signals in the anterior cingulate cortex. Science 324:948 –950. CrossRef Medline Holroyd CB, Nieuwenhuis S, Yeung N, Nystrom L, Mars RB, Coles MG, Cohen JD (2004) Dorsal anterior cingulate cortex shows fMRI response to internal and external error signals. Nat Neurosci 7:497– 498. CrossRef Medline Hoppitt WJ, Brown GR, Kendal R, Rendell L, Thornton A, Webster MM, Laland KN (2008) Lessons from animal teaching. Trends Ecol Evol 23: 486 – 493. CrossRef Medline Hunt LT, Behrens TEJ (2011) Frames of reference in human social decision making: neural basis of motivational and cognitive control. 409 – 424. MIT Press; Massuchusetts Hutton C, Bork A, Josephs O, Deichmann R, Ashburner J, Turner R (2002) Image distortion correction in fMRI: a quantitative evaluation. Neuroimage 16:217–240. CrossRef Medline Jones RM, Somerville LH, Li J, Ruberry EJ, Libby V, Glover G, Voss HU, Ballon DJ, Casey BJ (2011) Behavioral and neural properties of social reinforcement learning. J Neurosci 31:13039 –13045. CrossRef Medline Kennerley SW, Behrens TE, Wallis JD (2011) Double dissociation of value computations in orbitofrontal and anterior cingulate neurons. Nat Neurosci 14:1581–1589. CrossRef Medline Klucharev V, Hyto¨nen K, Rijpkema M, Smidts A, Ferna´ndez G (2009) Reinforcement learning signal predicts social conformity. Neuron 61:140 – 151. CrossRef Medline Markowitsch HJ, Emmans D, Irle E, Streicher M, Preilowski B (1985) cortical and subcortical afferent connections of the primates temporal pole: a study of rhesus-monkeys, squirrel-monkeys, and marmosets. J Comp Neurol 242:425– 458. CrossRef Medline Matsumoto M, Matsumoto K, Abe H, Tanaka K (2007) Medial prefrontal cell activity signaling prediction errors of action values. Nat Neurosci 10:647– 656. CrossRef Medline Mesulam MM, Mufson EJ (1982) Insula of the old-world monkey: 3. Efferent cortical output and comments on function. J Comp Neurol 212:38 –52. CrossRef Medline Morecraft RJ, Geula C, Mesulam MM (1992) Cytoarchitecture and neural afferents of orbitofrontal cortex in the brain of the monkey. J Comp Neurol 323:341–358. CrossRef Medline Mufson EJ, Mesulam MM (1982) Insula of the old-world monkey: 2. Afferent cortical input and comments on the claustrum. J Comp Neurol 212: 23–37. CrossRef Medline Pandya DN, Van Hoesen GW, Mesulam MM (1981) Efferent connections of the cingulate gyrus in the rhesus-monkey. Exp Brain Res 42:319 –330. Medline Petrides M, Pandya DN (2007) Efferent association pathways from the rostral prefrontal cortex in the macaque monkey. J Neurosci 27:11573– 11586. CrossRef Medline Ramnani N, Miall RC (2004) A system in the human brain for predicting the actions of others. Nat Neurosci 7:85–90. CrossRef Medline Rescorla RA, Wagner AR (1972) Classical conditioning: II. Current research and theory, pp 64 –99. New York: Appleton-Century Crofts. Rudebeck PH, Buckley MJ, Walton ME, Rushworth MF (2006) A role for the macaque anterior cingulate gyrus in social valuation. Science 313: 1310 –1312. CrossRef Medline Ruff CC, Fehr E (2014) The neurobiology of rewards and values in social decision making. Nat Rev Neurosci 15:549 –562. CrossRef Medline Rushworth MF, Mars RB, Summerfield C (2009) General mechanisms for making decisions? Curr Opin Neurobiol 19:75– 83. CrossRef Medline Schultz W (2006) Behavioral theories and the neurophysiology of reward. Annu Rev Psychol 57:87–115. CrossRef Medline Schultz W, Dickinson A (2000) Neuronal coding of prediction errors. Annu Rev Neurosci 23:473–500. CrossRef Medline Seltzer B, Pandya DN (1989) Frontal-lobe connections of the superior temporal sulcus in the rhesus-monkey. J Comp Neurol 281:97–113. CrossRef Medline Shane MS, Stevens M, Harenski CL, Kiehl KA (2008) Neural correlates of the processing of another’s mistakes: a possible underpinning for social and observational learning. Neuroimage 42:450 – 459. CrossRef Medline Shenhav A, Botvinick MM, Cohen JD (2013) The expected value of control: an integrative theory of anterior cingulate cortex function. Neuron 79: 217–240. CrossRef Medline
Apps et al. • Vicarious Reinforcement Learning Signals Silvetti M, Alexander W, Verguts T, Brown JW (2014) From conflict management to reward-based decision making: actors and critics in primate medial frontal cortex. Neurosci Biobehav Rev 46P1:44 –57. CrossRef Medline Singer T, Seymour B, O’Doherty J, Kaube H, Dolan RJ, Frith CD (2004) Empathy for pain involves the affective but not sensory components of pain. Science 303:1157–1162. CrossRef Medline Somerville LH, Heatherton TF, Kelley WM (2006) Anterior cingulate cortex responds differentially to expectancy violation and social rejection. Nat Neurosci 9:1007–1008. CrossRef Medline Stanley DA, Adolphs R (2013) Toward a neural basis for social behavior. Neuron 80:816 – 826. CrossRef Medline Sutton RS, Barto AG (1981) Toward a modern theory of adaptive networks: expectation and prediction. Psychol Rev 88:135–170. CrossRef Medline Sutton RS, Barto AG (1998) Reinforcement learning: an introduction. Cambridge, MA: Massachusetts Institute of Technology.
J. Neurosci., February 18, 2015 • 35(7):2904 –2913 • 2913 Vogt BA, Pandya DN (1987) Cingulate cortex of the rhesus-monkey: 2. Cortical afferents. J Comp Neurol 262:271–289. CrossRef Medline Vogt BA, Nimchinsky EA, Vogt LJ, Hof PR (1995) Human cingulate cortex: surface-features, flat maps, and cytoarchitecture. J Comp Neurol 359: 490 –506. CrossRef Medline Williams SM, Goldman-Rakic PS (1998) Widespread origin of the primate mesofrontal dopamine system. Cereb Cortex 8:321–345. CrossRef Medline Yeung N, Nieuwenhuis S (2009) Dissociating response conflict and error likelihood in anterior cingulate cortex. J Neurosci 29:14506 –14510. CrossRef Medline Yoshida K, Saito N, Iriki A, Isoda M (2012) Social error monitoring in macaque frontal cortex. Nat Neurosci 15:1307–1312. CrossRef Medline Zhu L, Mathewson KE, Hsu M (2012) Dissociable neural representations of reinforcement and belief prediction errors underlie strategic learning. Proc Natl Acad Sci U S A 109:1419 –1424. CrossRef Medline