Jane Brooks Zurn, Member, IEEE, Xianhua Jiang, and Yuichi Motai, Member, IEEE ... Y. Motai is with the Department of Electrical and Computer Engineering,.
2804
IEEE TRANSACTIONS ON INSTRUMENTATION AND MEASUREMENT, VOL. 56, NO. 6, DECEMBER 2007
Video-Based Tracking and Incremental Learning Applied to Rodent Behavioral Activity Under Near-Infrared Illumination Jane Brooks Zurn, Member, IEEE, Xianhua Jiang, and Yuichi Motai, Member, IEEE
Abstract—This paper describes a noninvasive video tracking system for measurement of rodent behavioral activity under near-infrared (NIR) illumination, where the rodent is of a similar color to the background. This novel method allows position tracking in the dark, when rodents are generally most active, or under visible light. It also improves current video tracking methods under low-contrast conditions. We also manually extracted rodent features and classified three common behaviors (sitting, walking, and rearing) using an inductive algorithm—a decision tree (ID3). In addition, we proposed the use of a time–spatial incremental decision tree (ID5R), with which new behavior instances can be used to update the existing decision tree in an online manner. These were implemented using incremental tree induction. Open-field locomotor activity was investigated under “visible” (460.5−561.1 nm), 880- and 940-nm wavelengths of NIR, as well as a “dark” condition consisting of a very small level of NIR illumination. A widely used NIR crossbeam-based tracking system (Activity Monitor, MED Associates, Inc., Georgia, VT) was used to record simultaneous position data for validation of the video tracking system. The classification accuracy for the set of new test data was 81.3%. Index Terms—Behavioral science, biomedical equipment, biomedical image processing, decision trees, image classification, infrared tracking.
I. I NTRODUCTION
V
IDEO-BASED observation of rodent behavior is a useful and increasingly utilized method for elucidating behavior in various psychological experiments such as monitoring the effects of drugs of addiction, novel disease treatments, and genetic mutations. These experimental factors can have a variety of effects on rodent behavior (i.e., [1]), and therefore, it is highly desirable to identify many different behaviors during observation, such as walking, sitting, and rearing (a list of behaviors are described in [2]). Therefore, video tracking and Manuscript received August 22, 2006; revised July 3, 2007. The work of X. Jiang was supported by the Vermont Experimental Program to Stimulate Competitive Research Program under Grant EPS-0236976. J. B. Zurn is with the Department of Electrical and Computer Engineering, University of Vermont, Burlington, VT 05405 USA, and also with MED Associates, Inc., Georgia, VT 05478, USA. X. Jiang was with the Intelligent Media Laboratory, Department of Electrical and Computer Engineering, University of Vermont, Burlington, VT 05405 USA. She is now with the Department of Electrical and Computer Engineering, University of Minnesota, Minneapolis, MN 55455 USA. Y. Motai is with the Department of Electrical and Computer Engineering, University of Vermont, Burlington, VT 05405 USA. Color versions of one or more of the figures in this paper are available online at http://ieeexplore.ieee.org. Digital Object Identifier 10.1109/TIM.2007.908277
analysis is advantageous due to its ability to show very specific behaviors; it also allows the opportunity to record the video for future analysis with respect to as-yet-undefined behaviors. Examples of systems developed for video monitoring of rodents are the commercial products Activity Monitor 5 (MED Associates, Inc.), EthoVision (Noldus Information Technology) [3], and the PhenoScan series (CleverSys, Inc.), as well as systems developed in the academic sector including [4]–[7]. Other notable examples in the literature, not specifically for rodent tracking, are [8], which relies on shape differences for identifying object differences, and [9], which demonstrates a method for tracking multiple interacting objects. However, most of these systems are not configured for dark environment tracking. Rodents tend to be most active at night (e.g., [10]), so the difficulty of video tracking in both light and dark conditions increases the complexity of capturing a large and possibly useful volume of data. Recent research has shown the similarity of rodent behavior in the dark and under 940-nm infrared (IR) illumination for rats [11] or between dark conditions and 589-nm yellow light for mice [12]; therefore, the use of such illumination would have little influence on the rodent’s dark cycle behavior and is therefore noninvasive. Nearinfrared (NIR) illumination presents more difficulties for tracking because it can distort color intensity information (due to objects having different NIR reflectances than under visible light). In addition, when the focal length of an optical lens is set for NIR use, it is not optimal for wavelengths of light in the 350–600-nm range. The former often results in objects having different color characteristics than would normally be seen, and the latter produces a tendency toward blurred edges when the light source is switched without refocusing the lens. Although [3] has recently been updated for use with NIR [13], it works best with constant round-the-clock NIR illumination in addition to visible light, which wastes energy and can produce unwanted heat in the rodent housing system. We have further developed a practical and inexpensive method for video tracking in near darkness, when the rodent is of low contrast to the background (for an example, see Fig. 1). The overall contribution of this paper is the validation of video-based rodent behavioral measurement in an open-field chamber, which is illuminated by either NIR or visible light. Open-field activity monitoring involves placement of the rodent into a chamber devoid of any contents and recording motion and other activities of interest (i.e., wall hugging, which is referred to as thigmotaxic behavior—a potential indicator of
0018-9456/$25.00 © 2007 IEEE
ZURN et al.: VIDEO-BASED TRACKING AND APPLIED TO RODENT BEHAVIORAL ACTIVITY UNDER NIR ILLUMINATION
2805
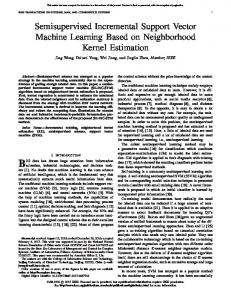
Fig. 1. Video tracker output for dark cycle tracking of a rat with no overhead illumination. Small white dots indicate previous locations of the rodent. Large white dots on the sides are the NIR LEDs of the beam-crossing array for Activity Monitor. Fig. 2. Diagram of the Activity Monitoring System for rodents.
anxiety). The wavelength response of the camera is about 300 nm [ultraviolet (UV)] to 1100 nm (NIR) when no IR filter is present. The validity of this measurement technique is demonstrated by correlation with results from beam breaks in a NIR light-emitting diode (LED) array. This system for tracking and behavior identification under IR illumination contributes to both the fields of computer vision-based measurement and behavioral learning research by providing a novel online method for 1) activity measurement in the dark that improves the work of [11] and 2) behavioral classification using an incremental decision tree that improves the work of [14]. This paper is organized as follows. Section II describes our proposed system architecture. Section III describes our tracking algorithm, and Section IV describes a proposed incremental online decision tree for behavior learning. Section V shows some interesting experiment results for the corresponding methods of Sections III and IV to demonstrate the performance. Finally, concluding remarks are given in Section VI.
II. P ROPOSED M EASUREMENT S YSTEM A RCHITECTURE A. Measurement Hardware Configuration An off-the-shell charge-coupled device camera is interfaced via the IEEE 1394 to a computer, with an adjustable array of visible and NIR LEDs fixed above the rodent chamber. The maximum wavelength response of the camera is about 300 nm (UV) to 1100 nm (NIR) when no IR filter has been installed. The results in a potential illumination range from 750 to 1100 nm. The camera used here is the DBK 21F04 (The Imaging Source, Bremen, Germany) and conforms to the DCAM standard, transmitting an image stream to the computer via an IEEE 1394a bus. The DBK 21F04 responds to a wavelength range from 400 to 1000 nm. NIR LEDs for recording beam crossing (used for validating the results) are affixed to the lower perimeter of the system. A system block diagram is shown in Fig. 2.
Fig. 3. Video-based Activity Monitoring System, which is shown with mouse and bedding.
This array can be switched between white light and NIR illumination for the light and dark monitoring, respectively. Overhead illumination conditions consisted of visible light, 880-nm NIR, 940-nm NIR, and “no light” (consisting of an extremely low level of 940 nm NIR). A photo of the system is shown in Fig. 3. To turn on specific illumination strips at a given time, the control system MED-PC was used (MED Associates, Inc.). MED-PC consists of a personal computer (PC)-based run-time system (MED-PC IV), which allows for PC-based control of data acquisition and output control for up to 80 separate inputs and 80 outputs. The on–off procedure for the illumination array was programmed using the language MedState Notation. Using the Trans IV program, the code was then translated and compiled for use by MED-PV IV. The PC was connected to the LEDs via a PCI Interface Connection Package (MED Associates, Inc. DIG-700P2) through a SmartCtrl Connection Panel (SG-716). The LED strips were powered by 5 VDC at appropriate current levels using a voltage converter between the 28 VDC supplied by the SmartCtrl panel and the LED arrays.
2806
IEEE TRANSACTIONS ON INSTRUMENTATION AND MEASUREMENT, VOL. 56, NO. 6, DECEMBER 2007
The activity was quantitatively measured for distance traveled, average velocity, and time spent resting for both video tracking and the NIR crossbeam system. B. Placement of NIR Illumination LEDs Evenly spaced overhead illumination strips are all that is required to provide an even and adequate illumination for this tracking method. Although the open-field chamber may contain bedding such as sawdust or corncobs, a hard floor surface is needed for the chamber when the crossbeams are used. In this scenario, glare becomes an issue for image quality [Fig. 4(a) and (b)]. Glare does not impair the tracking algorithms described in Section III; even so, there are several approaches for LED placement that can be used to alleviate this issue. The LEDs can be installed at angles to maximize illumination coverage [Fig. 4(c) and (d)], or a diffuser can be placed between the LEDs and the open-field chamber [Fig. 4(e) and (f)]. For our system, we found that the diffuser panel needed to be placed some distance away from the LEDs to have an effect, which made it necessary to cut a hole in the center of the diffuser large enough to view the chamber floor [Fig. 4(f)]. It is important for this configuration to avoid placing the LED strips above the removed area of the diffuser. C. NIR Illumination Effects for Monitoring Two commonly available LEDs—880 and 940 nm—are tested for suitability for building the proposed measurement hardware. Because video tracking requires illumination, it is necessary to examine the visual range of the rodents to ensure the illumination is outside that range. This serves to emphasize the importance of not overlooking the potential effects of NIR illumination on rodent behavior. Rodent vision extends into the UV range (wavelengths < 390 nm) [15], but it has generally been assumed that rodents cannot see in the NIR range (> 750 nm wavelength) due to the drop-off in visual sensitivity. However, some research has found retinal sensitivity and visual-evoked brain potentials to 936-nm light [16]. Therefore, if NIR illumination is to be used, it is necessary to examine its effects on individual rodent behaviors. Fig. 5 shows a maximum spectral output of LED arrays at test height (approximately 50 cm, depending on bedding distribution) (from [11]). The x-axis represents light wavelength (350–1025 nm), and the y-axis is a relative intensity measurement. The emitted wavelengths of the illumination LEDs were measured using a photospectrometer (OceanOptics model USB2000, Dunedin, FL). The spectral outputs of these are shown in Fig. 5, with the characteristics of the white LEDs. The peak wavelengths measured and their corresponding standard deviations are in Table I. To test the effects of NIR on rodent locomotion, trials were run using six experimentally naive Sprague–Dawley rats (Harlan International), each approximately 60–90 days old and housed in a reversed 12-h light–dark cycle. Trials were run in the daytime, during the rats’ dark cycle. Each trial consisted of 30 min spent in a standard open-field activity monitoring chamber (MED Associates, Inc.). The activity was quantitatively
evaluated for distance traveled. Visual qualitative observation of the trials revealed that the rodents in the white light condition generally suppressed locomotor activity after several minutes, whereas the other rats would ambulate for the entire time period. The experimental procedure consisted of 30 min of placement in an open-field chamber under the light prescribed by the experimental condition. The floor of the chamber was white and did not contain any bedding. The position of the rats was determined by the blocking of the horizontal NIR beams. From [11], the mean difference in rodent travel velocity between the NIR and white illumination conditions was not significant, and the resting time was significantly larger for the white light (Tukey post-hoc test, p < 0.027 for each condition). As shown in Table II, quantitative investigation of IR illumination effects yielded a significant difference in rodent distance traveled between the visible white light and the dark and 940-nm IR conditions (least significant difference post-hoc test, p < 0.023 and 0.033, respectively). As a summary of this hardware evaluation, it appears that the difference between the means for 880 nm light and white light would reach significance with an increased rodent sample size. From these data, it appeared advisable to use the 940-nm illumination for the dark cycle to increase the strength of the illumination difference between the light and dark cycles. These data support the hypotheses that there is a significant difference between locomotor in the dark and during light and that NIR illumination results in locomotor activity that is not significantly different from dark cycle behavior. III. T RACKING A LGORITHM The tracking algorithm utilizes traditional threshold and image subtraction-based algorithms. The main module for the tracking algorithm is the segmentation of the rodent from the captured images. Fig. 6 illustrates the process flow. A. Step 1. Hypothesis Using Subtraction Between Frames To develop the hypothesis for the rodent position, image subtraction is used to determine the location of the rodent. The pixel color intensities of the current frame are subtracted from the previous frame, and the center of the area of change is noted. We use image subtraction at this point because, even in the “dark” case, there is an extremely small level of illumination. Since the rodent is nearly the same color as the floor of the chamber, subtraction reveals areas where changes are occurring in the image. Subtraction from the previous frame takes into account any changes over time in the rodent chamber, such as the addition of fecal pellets. Fig. 1 shows rodent position over time as dots superimposed on the image, with the crosshair as the marked center position of the rodent in the current frame. 1) Step 1 for Rodent Segmentation: 1) Subtract the current pixel intensity from corresponding pixel in the previous frame. 2) If the difference is smaller than the threshold, then mark the pixel location. Otherwise, do nothing. 3) Get the next pixel in the current frame.
ZURN et al.: VIDEO-BASED TRACKING AND APPLIED TO RODENT BEHAVIORAL ACTIVITY UNDER NIR ILLUMINATION
2807
Fig. 4. Configurations of overhead illumination LEDs. White arrows show the angle of the LEDs in the illumination array. (a) Image when the LEDs face directly down onto (b) a reflective chamber floor. The “spot” glare is reduced (c) by angling the individual LED strips, as shown in (d). (e) Individual spot glare can be nearly eliminated by using (f) a diffuser, which must be placed at a sufficient distance from the LEDs. For this configuration, the strips must be placed outside the cutout area to avoid glare.
Fig. 5. Maximum spectral output of LED arrays at test height (approximately 50 cm, depending on bedding distribution). The x-axis represents light wavelength (350–1025 nm), and the y-axis is a relative intensity measurement.
2808
IEEE TRANSACTIONS ON INSTRUMENTATION AND MEASUREMENT, VOL. 56, NO. 6, DECEMBER 2007
TABLE I PEAK NOMINAL AND MEASURED WAVELENGTH
TABLE II MEAN AMBULATORY DISTANCE TRAVELED (IN ARBITRARY UNITS)
Fig. 6. Steps for rodent segmentation from background images.
B. Step 2. Verification Using Intensity The color intensity of the area marked in Step 1 is verified by comparison to the intensity of the previously marked rodent location. If the difference in pixel intensity is less than the number of levels set in the calibration phase (25 pixels for 940-nm illumination), the new location is marked as the current location of the rodent. This is effective under uneven illumination because the velocity of the rodent is slow enough with respect to the frame speed that the pixel intensity does not change more than the calibration level between frames. Because of the monochromatic light used for the NIR illumination, Red Green Blue (RGB) information transmitted by the camera is ignored, and the intensity of each pixel can be used for the minimum color threshold for the rodent regardless of the color. To reduce noise, the surrounding area of the pixel is also examined. If the average value of the adjacent pixels is also less than the threshold, the pixel is marked. The new location is compared to the expected values using a goodness-of-fit ratio. Goodness of fit is determined, as in [19], by calculating the ratio of each pixel color to its expected value. If the goodness of fit is within the preset limits, the location was marked. The new position is calculated by adding one-eighth of the change in position to the old position. Incrementally updating the position in this way is fast enough to track the rodent at the frame rates used (7.5 and 30 frames/s) and reduces the impact of extraneous noise readings.
1) Step 2 for Rodent Segmentation: 1) Check the center of motion. 2) If the pixel intensity of the center is above the threshold, throw out the point. 3) Otherwise, check the adjacent pixels. a) If the intensity of these pixels is smaller than the threshold, then mark pixel location. b) Otherwise, throw out the point. C. Step 3. Region-Based Segmentation Using Target Intensity in Each Frame To segment the body of the rodent from the background for position analysis, the location is determined, as in Step 2. Vertical and horizontal dimensions of the rodent location are determined by counting the number of continuous pixels in the same row and column that conformed to the location pixel intensity (for example, ±10% of the intensity of the previous location, depending on the contrast and illumination levels of the input video). If a pixel is encountered that does not fit in these limits, the line is sampled past that pixel to a maximum of five pixels before it ceases searching. The minimum limit of the rodent area is set to the minimum visible area of the rodent during rearing, the maximum length to 105% of the rodent’s length from nose to rump when stretched out. If the line is within minimum and maximum limits, it is drawn on the screen, with the end result being a solid color blob designating the location of the mouse. A crosshair marker is also drawn to indicate the location sent to the tracking program. Establishing minimum limits reduces noise, and using maximum limits reduces the chance of the chamber sides being erroneously marked. 1) Step 3 for Rodent Segmentation: 1) Take the marked pixel location. 2) If the surrounding pixel intensity is within the range of threshold, then do the following. a) Get next pixel in that direction. b) If less than 105% of maximum rodent size, recursively check the next surround pixel. c) Otherwise, mark as edge of the rodent. 1) Otherwise, check the following five pixels. a) If these pixels are within range, go to Step 2a. b) Otherwise, mark as edge of the rodent. IV. B EHAVIOR C LASSIFICATION A LGORITHM Behaviors are divided into categories of sitting, rearing, and walking, as shown in Fig. 7. These behaviors are usually manually identified for the training phase, using human observation. Such observation is often unrealistic since exhaustive behavior labeling requires expensive human resources—many experiments may involve huge data sets (for example, a 30-min video at 7.5 frames/s results in 13 500 individual frames). To automate the task of behavior identification, we propose an incremental decision tree methodology. For constructing such a feature space, we need to specify the features a priori so that the computer can calculate several parameters, as described in the following section.
ZURN et al.: VIDEO-BASED TRACKING AND APPLIED TO RODENT BEHAVIORAL ACTIVITY UNDER NIR ILLUMINATION
Fig. 7.
2809
Typical rodent behaviors (video screen captures). (a) Sitting. (b) Walking. (c) Rearing.
c) If Si is empty, then attach a leaf node with the most common class. d) Otherwise, attach the node with a subtree, whose sample set is Si ; attribute list is the original attribute list minus the test attribute.
A. Feature Extraction Features are used here for classifying rodent behavior. To determine these features, we have extracted frame geometry and time sequence parameter values a priori. Geometrical attribute parameters are 1) area; 2) center of mass; 3) distance traveled in one frame; 4) perimeter; 5) position of a box bounding the rodent within the field of interest; 6) height, width, and hypotenuse of the bounding box; 7) center of box; 8) offset of box center with respect to center of mass; 9) area of box; 10) major and minor axis lengths of an ellipse corresponding to the rodent body; 11) area of the ellipse; 12) difference in area of ellipse and measured area of rodent; 13) circularity of the perimeter; 14) shape complexity of the perimeter; 15) diameter of a circle enclosing the rodent (Feret’s Diameter); and 16) difference between Feret’s Diameter and box hypotenuse length. These attributes were extracted using the program ImageJ version 1.34n that is available from the National Institutes of Health [17]. The rodent shape was also manually segmented from each frame due to difficulties with segmenting portions of the rodent perimeter that were exactly the same color as the background. B. Traditional Decision Tree Algorithm To classify the rodent behavior, a decision tree was built as a typical and reliable inductive training method. We use a wellknown decision tree ID3 [18] as our offline traditional method. Its fundamental strategy is shown in Algorithm 1. The selection of test attribution is very important when building the decision tree. We use the information gain [19] to measure the goodness of the selected attribute. The attribute with the highest information gain is chosen as the test attribute for the current node. Such an approach minimizes the expected number of tests needed to classify an object and guarantees that a simple tree is established. Algorithm 1. ID3 Decision Tree [18] 1) Create a single node representing the training samples. 2) If the samples are all of the same class, then the node becomes a leaf and is labeled with that class. 3) If attribute list is empty, then set the node as a leaf node and label it with the most common class. 4) Otherwise, select test attribute A, and label the node with attribute A. 5) For each value of ai ∈ A, do the following. a) Grow a branch with the test attribute = ai . b) Set Si the sample set whose test attribute = ai .
Suppose our data set is S, which has a quantity s of sample data. These data belong to n different classes Ci (i = 1, . . . , n). The data set of each class is Si (Si ⊂ S). Each of the data has m distinct attributes. The expected information required to classify the data set is I(S1 , S2 , . . . , Sn ) = −
n �
pi log2 pi
(1)
i=1
where pi is the probability that an arbitrary sample belongs to class Ci and is calculated by si /s. Let attribute A have q different values {a1 , a2 , . . . , aq }; therefore, we will have q branches {b1 , b2 , . . . , bq } if attribute A is used to partition the data set. For each branch bj (j = 1, 2, . . . , q), there are sji data belonging to class Ci . The entropy, or expected information based on the partitioning into subsets by A, is given by q � � sj1 + sj2 + · · · + sjn � j j I S1 , S2 , . . . , Snj E(A) = s j=1
(2)
where n � � � pji log2 pji I S1j , S2j , . . . , Snj = − i=1
pji =
sji sj1
+
sj2
+ · · · + sjn
.
(3)
A smaller entropy value indicates a greater purity of the subset partitions and an increase in information. The expected reduction in entropy caused by attribute A is defined as Gain(A) = I(S1 , S2, . . . Sn ) − E(A).
(4)
After computing the information gain of each attribute, the attribute with the highest information gain is chosen as the test attribute. The node is then labeled with the test attribute, and the samples are accordingly partitioned. In the training phase as an offline decision tree, samples of frame data were labeled sitting, rearing, or walking by
2810
IEEE TRANSACTIONS ON INSTRUMENTATION AND MEASUREMENT, VOL. 56, NO. 6, DECEMBER 2007
human observation. The resulting tree produced using the ID3 algorithm is illustrated in the Appendix.
is transposed to place the old test attribute at the root of each immediate subtree. ii) Update the test attribute for each subtree, except for the one that will be updated in Step 3d. d) Recursively update the subtrees along the branch of the current decision node. Grow the branch if necessary.
C. Online Incremental Decision Tree Algorithm We have proposed an online incremental method for training such rodent behaviors. Our contribution to the learning phase was to develop dynamic learning methodologies, in which the training behaviors were incrementally executed in an online manner. For offline learning tasks, ID3 is often a good choice for building a classification rule because it is simple and efficient. However, constructing an offline tree requires extensive human input for labeling the behaviors; for example, for the Appendix, 318 frames of data were labeled and identified. We want to automate this task and minimize the need for human input. To develop an incremental online learning method, we focus on adding instances incrementally using the computer, without the need to build an entirely new decision tree each time. The incremental decision tree method for our algorithm applies the incremental tree induction (ITI) implementation [20] of the ID5R method proposed by Utgoff [14]. This algorithm can produce a decision tree for a given set of training instances, without the expense of building a new decision tree after each new training instance. C code for this method can be found at [21]. ID5R shows its advantage in updating the test attribute of each node. Instead of throwing away all the subtrees produced by the old test attribute, ID5R pulls the indicated attribute up to the root node of the tree or subtree, therefore maintaining consistency with the old training instances. It allows recalculation of the sample number for each class during the tree manipulations without reexamination of the training instances. Therefore, we are now able to add new unlabeled training instances to our incremental decision tree while maintaining reasonable feature dimensions. Algorithm 2. ID5R Decision Tree [20] 1) If the tree is empty, then define it as the unexpanded form, create a leaf node, label it with its class name, and put the instance into the empty sample set. 2) If the tree is not empty but in unexpanded form, and the new instance is from the same class, then add the instance to the sample set of the node. 3) Otherwise, do the following. a) If the tree is in unexpanded form, then expand it one level, arbitrarily choosing the test attribute for the root. b) For the test attribute and all nontest attributes at the current node, update the count of positive or negative instances for the value of that attribute in the training instance. c) If the current node contains an attribute test that does not have the highest information gain, then do the following. i) Update the tree so that the root has the highest information gain with the new test attribute. This is achieved by first recursively pulling the new attribute to the root of the current node. Then, any unexpanded trees are converted to expanded form and the tree
Let us define an unexpanded tree as a tree that solely branches to leaf nodes; otherwise, it is defined as an expanded tree. The instances at a node are described only by the attribute–value pairs that have not been previously addressed by tests above the node. The basic ID5R algorithm is shown in Algorithm 2 [20]. More specifically, we reformalize our newly proposed incremental decision framework by extending the traditional decision tree described in Section IV-B. When the new instance is added, the information gain needs to be recalculated. Suppose the new instance belongs to class Ck . The expected information required to classify the new data set is I � (S1 , S2 , . . . , Sk� , . . . Sn ) n � � � si si s s = − log2 + k log2 k s + 1 s + 1 s + 1 s +1 i=1
(5)
i�=k
where s�k = sk + 1. If we are using the current test attribute A to classify the new data set, it belongs to branch bi . The new entropy based on the partitioning of A is given by E � (A) =
q � � sj1 + sj2 + · · · + sjn � j j I S1 , S2 , . . . , Snj s+1 j=1 j�=l
+
� sl1 + sl2 + · · · s�lk + · · · sln l l I S1 , S2 , . . . , Sk�l , . . . , Snl s+1
(6)
where s�lk = slk + 1 n � �
I S1l , S2l , . . . , Sk�l , . . . , Snl = − p�li log2 p�li
(7)
i=1
p�li(i�=k) = p�lk =
sl1 sl1
+
sl2
sli + · · · s�lk + · · · sln
+
sl2
s�lk . + · · · s�lk + · · · sln (8)
The new information gain of attribute A is Gain� (A) = I � (S1 , S2 , . . . , Sk� , . . . , Sn ) − E � (A).
(9)
The resulting ID5R tree produced by the ITI program [20] for our training and incrementing data sets is the same as for ID3 (shown in the Appendix).
ZURN et al.: VIDEO-BASED TRACKING AND APPLIED TO RODENT BEHAVIORAL ACTIVITY UNDER NIR ILLUMINATION
Fig. 8.
2811
Activity Monitor beam output for (a) dark cycle tracking with NIR (940 nm) overhead illumination and (b) light cycle tracking with white illumination.
V. E XPERIMENT AND E VALUATION R ESULTS We have evaluated the two experiments: 1) tracking performance in Section V-A and 2) behavior identification performance in Section V-B. A. Tracking Results for Dark and Light Cycle Illumination To test the performance of the tracking algorithms, the rodent behavior for the aforementioned lighting conditions was also run with horizontal IR crossbeams (880 nm) 2 cm above the floor of the chamber to record movement. The tracking results of crossbeams were used for ground truth. Since these crossbeams were widely used for tracking and had only 48 LEDs (the overhead illumination used 144 LEDs), it was assumed that the influence of the overhead NIR LEDs would be much greater than those of the crossbeams. The rats were maintained on a 12-h reversed light/dark cycle (12 h of light starting at 7 P. M .) and were tested during their dark cycle. The levels of light in the housing room were a maximum of 26 lx of red light during the dark cycle, and a maximum of 100 lx of white florescent light during the light cycle. The coordinates from the IR crossbeams and the video tracking were both transmitted to an existing rodent tracking analysis program (Activity Monitor 5, MED Associates, Inc.). A screen capture from the video program is shown in Fig. 8 for the NIR and white light illumination conditions, with a picture of the Activity Monitor screen for the same lighting condition using the output of the NIR crossbeams (from [22]). The rodent was tracked using our video-based method described in Section III [22] and evaluated by beam-break output. The mean distance reported by the two programs was not significantly different (paired samples t-test, t = 0.089, p = 0.937). Fig. 9 shows an example of the superimposed output of the beam-break system and our method; a portion of the “error” encountered is due to the increased spatial resolution of the video method in comparison to the beams. B. Behavior Learning Performance Using ID3 and ID5R The incremental decision tree shown in the Appendix represents the model used for classifying rodent behaviors. This
Fig. 9. Sample of tracking results under 880-nm illumination. Solid line shows the rodent travel distance over time, as measured using Activity Monitor. Dotted line shows travel distance for the same time period using the video tracking system in this paper.
model was derived using (1)–(9), and the classification performances of the proposed ID3 and ID5R approaches were validated by testing video data of rodent behavior. In these experiments, the results were compared to human observation. A “ground truth” set of training data was acquired by manually recording behaviors during a video test sequence (which consisted of overhead video of a rat in an “open field” under NIR illumination). A series of time-stamped behaviors was recorded (sitting, walking, and rearing) and analyzed. Behaviors were marked at the start of the behavior, and video sequences were captured for each behavior instance. The length of each sequence was truncated to seven frames to maintain statistical sample size consistency. The monitored instances consist of 318 video frames for training and 75 video frames for testing. We evaluated the decision tree training performance for classifying unlabeled instances using two subexperiments—testing the tree 1) on a subset of the data used for training (pretraining set) and 2) on the untrained data (new testing set). For the incrementally updated decision tree (ID5R), the training data (318 frames)
2812
IEEE TRANSACTIONS ON INSTRUMENTATION AND MEASUREMENT, VOL. 56, NO. 6, DECEMBER 2007
TABLE III CLASSSIFICATION PERFORMANCE
was divided into two groups—1) data for the initial tree (239 frames) and 2) data for updating the tree (79 frames). The results are shown in Table III. When using unpruned decision trees, obviously, the accuracy of the tree for classifying the pretraining set was 100%, because all the factors necessary to identify each behavior are included in the tree. The accuracy dropped over 8%, with a decrease of less than 2% of computing time when a pruned tree was used for classification. Using unpruned trees, the best accuracy for the testing set was 81.333% for ID3 and ID5R. This result indicated that the classification performances for ID3 and ID5R were not significantly different from each other, although ID5R was able to easily add data from additional video frames for incremental training instances. That is, our proposed incremental decision tree framework could be applied well to rodent behavioral activity. These accuracy results are on par with other methods for rat behavior analysis; with neural networks, [7] had 82.1% accuracy for untrained data, and [2] showed 76.53%. The results for the method used in [23] for “exploring” (which would encompass walking and rearing as examined in this paper) are 74%. In that example, some other behaviors not examined here had identification accuracies as high as 89% (for sleeping behavior); however, their measurement conditions are completely different from ours in that they are examining a side view of the rodent.
After the training instances of the captured video were inductively trained, the resulting multiple variable tree was built to identify rodent behaviors from the test set of video data. Although the decision tree is a standard and reliable inductive learning method, traditionally, these trees were constructed offline. Our online incremental decision tree based on ID5R was capable of being sequentially updated with new data without the need for human input, is comparable in accuracy to existing methods, and allows for the reduction of human input into the system. In this proposed framework, we did not need to separate the procedures for learning and testing; we can also add the testing instances as an incremental instance after they are classified. The experiment results demonstrated the feasibility and merits of motion analysis for tracking rodent position, and the use of decision tree algorithms for examination of rodent behavior. As a remaining issue, the online classification performance using the incremental decision tree described in this paper needs to be evaluated through further long-term training. The data set used was somewhat small in comparison to other research, but the results are comparable to those found by other methods and may improve with increased training data and improved feature choices for classification.
VI. S UMMARY
A PPENDIX
We have developed a new monitoring system, using IR illumination for video-based measurement of rodent, and extended the method to examine the rodent behaviors during the rodent dark cycle, which has not been previously attempted. The combination of color thresholding and motion analysis proved to be a fast and effective method for position tracking under both daylight and dark cycle conditions. The use of ID3 and ID5R decision trees resulted in behavior identification improved over most previous research, and the tree demonstrates which attributes of the image are the most important for behavior analysis. The area and perimeter of the rodent appear to be the two most important factors for behavior analysis in an open field, as well as location of the rodent with proximity to the walls of the open field.
The decision tree constructed using ITI (pruned) is shown at the top of the next page. ACKNOWLEDGMENT The authors would like to thank MED Associates, Inc. and K. Zurn for the equipment donations, D. Hohmann and R. Wood for software support with the video portion of the experiment, G. Bamberger for assistance with MED-PC IV, Dr. S. I. Dworkin and S. Babalonis of the University of North Carolina, Wilmington, for generous use of laboratory space and assistance with experimental design and implementation, and the anonymous reviewers for their helpful comments.
ZURN et al.: VIDEO-BASED TRACKING AND APPLIED TO RODENT BEHAVIORAL ACTIVITY UNDER NIR ILLUMINATION
R EFERENCES [1] C. Del Seppia, L. Mezzasalma, E. Choleris, P. Luschi, and S. Ghione, “Effects of magnetic field exposure on open field behavior and nociceptive responses in mice,” Behav. Brain Res., vol. 144, no. 1/2, pp. 1–9, Sep. 2003. [2] J. B. I. Rousseau, P. B. A. Van Lochem, W. H. Gispen, and B. M. Spruijt, “Classification of rat behavior with an image-processing method and a neural network,” Behav. Res. Meth. Instrum. Comput., vol. 32, no. 1, pp. 63–71, Feb. 2000. [3] L. P. J. J. Noldus, A. J. Spink, and R. A. J. Tegelenbosch, “Ethovision: A versatile video tracking system for automation of behavioral experiments,” Behav. Res. Meth. Instrum. Comput., vol. 33, no. 3, pp. 398–414, Aug. 2001. [4] K. Branson, V. Rabaud, and S. Belongie, “Three brown mice: See how they run,” in Proc. VS-PETS, 2003, pp. 78–85. [5] K. Branson and S. Belongie, “Tracking multiple mouse contours (without too many samples),” in Proc. IEEE Int. Conf. CVPR, San Diego, CA, 2005, pp. 1039–1046. [6] C. J. Twining, C. J. Taylor, and P. Courtney, “Robust tracking and posture description for laboratory rodents using active shape models,” Behav. Res. Meth. Instrum. Comput., vol. 33, no. 3, pp. 381–391, Aug. 2001. [7] D. J. Heeren and A. R. Cools, “Classifying postures of freely moving rodents with the help of Fourier descriptors and a neural network,” Behav. Res. Meth. Instrum. Comput., vol. 32, no. 1, pp. 56–62, 2000. [8] D. Magee and R. D. Boyle, “Detecting lameness in livestock using resampling condensation and multi-stream cyclic hidden Markov models,” Image Vis. Comput., vol. 20, pp. 581–594, 2002. [9] Z. Khan, T. Balch, and F. Dellaert, “MCMC-based particle filtering for tracking a variable number of interacting targets,” IEEE Trans. Pattern Anal. Machine Intell., vol. 27, no. 11, pp. 1805–1819, Nov. 2005. [10] N. Mrosovsky, R. G. Foster, and P. Salmon, “Thresholds for masking responses to light in three strains of retinally degenerate mice,” J. Comp. Physiol., A Sens. Neural Behav. Physiol., vol. 184, no. 4, pp. 423–428, Apr. 1999. [11] J. B. Zurn, D. Hohmann, S. I. Dworkin, and Y. Motai, “A real-time rodent tracking system for both light and dark cycle behavior analysis,” in Proc. IEEE WACV, Breckenridge, CO, Jan. 5–7, 2005, pp. 87–92. [12] I. S. McLennan and J. Taylor-Jeffs, “The use of sodium lamps to brightly illuminate mouse houses during their dark phases,” Lab. Anim., vol. 38, no. 4, pp. 384–392, Oct. 2004. [13] L. de Visser, R. van den Bos, and B. M. Spruijt, “Automated home cage observations as a tool to measure the effects of wheel running on cage floor locomotion,” Behav. Brain Res., vol. 160, no. 2, pp. 382–388, 2005. [14] P. E. Utgoff, “Incremental induction of decision trees,” Mach. Learn., vol. 4, no. 2, pp. 161–186, Nov. 1989. [15] G. H. Jacobs, J. A. Fenwick, and G. A. Williams, “Cone-based vision of rats for ultraviolet and visible lights,” J. Exp. Biol., vol. 204, pp. 2439– 2446, 2001. [16] M. T. Pardue, S. L. Ball, J. R. Hetling, V. Y. Chow, A. Y. Chow, and N. S. Peachey, “Visual evoked potentials to infrared stimulation in normal cats and rats,” Doc. Opthamol., vol. 103, no. 2, pp. 155–162, Sep. 2001. [17] W. Rasband, ImageJ. Retrieved July 7, 2005. [Online]. Available: http://rsb.info.nih.gov/ij/ [18] J. R. Quinlan, “Induction of decision trees,” Mach. Learn., vol. 1, no. 1, pp. 81–106, 1986. [19] J. R Quinlan, C4.5: Programs for Machine Learning, 1st ed. San Francisco, CA: Morgan Kaufmann, 1993. [20] P. E. Utgoff, N. C. Berkman, and J. A. Clouse, “Decision tree induction based on efficient tree restructuring,” Mach. Learn., vol. 29, no. 1, pp. 5–44, Oct. 1997.
2813
[21] P. E. Utgoff, Incremental Decision Tree Induction. Retrieved June 2005. [Online]. Available: http://www-lrn.cs.umass.edu/iti/ [22] J. B. Zurn, X. Jiang, and Y. Motai, “Video-based rodent activity measurement using near-infrared illumination,” in Proc. IEEE IMTC, May 17–19, 2005, pp. 1928–1931. [23] S. Belongie, K. Branson, P. Dollar, and V. Rabaud, “Monitoring animal behavior in the smart vivarium,” in Proc. Measuring Behavior, Wageningen, The Netherlands, 2005, pp. 70–72.
Jane Brooks Zurn (M’02) received the B.S. degree in electrical engineering with a biomedical concentration and the M.S. degree from the University of Vermont, Burlington, in 2003 and 2005, respectively, where she is currently working toward the Ph.D. degree in electrical and computer engineering with the Department of Electrical and Computer Engineering. She is currently a Research and Development Engineer with MED Associates, Inc., Georgia, VT. She was awarded grants from NSF and Vermont NASA-EPSCoR. Her research interests include biomedical instrumentation, computer vision, pattern recognition, supervised and semisupervised learning, and systems engineering. Ms. Zurn is a member of the Society for Neuroscience, Tau Beta Pi, and Society of Women Engineers, among others.
Xianhua Jiang received the B.S. and M.S. degrees in automation from Zhejiang University, Hangzhou, China, in 2001 and 2004, respectively. She is currently working toward the Ph.D. degree in electrical and computer engineering with the Department of Electrical and Computer Engineering, University of Minnesota, Minneapolis. From 2004 to 2006, she was with the Intelligent Media Laboratory, Department of Electrical and Computer Engineering, University of Vermont, Burlington. She has been awarded grants from the Sigma Xi Scientific Research Society and Vermont NASA-EPSCoR. Her research interests include system theory, signal analysis, and classification algorithms.
Yuichi Motai (M’01) received the B.Eng. degree in instrumentation engineering from Keio University, Minato, Japan, in 1991, the M.Eng. degree in applied systems science from Kyoto University, Kyoto, Japan, in 1993, and the Ph.D. degree in electrical and computer engineering from Purdue University, West Lafayette, IN, in 2002. He is currently an Assistant Professor of electrical and computer engineering with the Department of Electrical and Computer Engineering, University of Vermont, Burlington. He was a tenured Research Scientist with the Secom Intelligent Systems Laboratory, Tokyo, Japan, from 1993 to 1997. His research interests include the broad area of computational intelligence; particularly of computer vision, human–computer interaction, ubiquitous computing, sensor-based robotics, and mixed reality.