Ciani et al. Cost Eff Resour Alloc (2018) 16:15 https://doi.org/10.1186/s12962-018-0098-7
Cost Effectiveness and Resource Allocation Open Access
RESEARCH
Decision uncertainty and value of further research: a case‑study in fenestrated endovascular aneurysm repair for complex abdominal aortic aneurysms Oriana Ciani1,2* , David Epstein3,4, Claire Rothery3, Rod S. Taylor1 and Mark Sculpher3
Abstract Background: Fenestrated endovascular aneurysm repair (fEVAR) is a new approach for complex abdominal aortic aneurysms, limited to a few specialist centers, with limited evidence base. We developed a cost-effectiveness decision model of fEVAR compared to open surgical repair (OSR) to investigate the likely direction of costs and benefits and inform further research projects on this technology. Methods: A systematic review with meta-analysis and a four-state Markov model were used to estimate the costeffectiveness of fEVAR versus OSR. We used a recent coverage with evidence development framework to characterize the main sources of uncertainty and inform decisions about the type of further research that would be most worthwhile and feasible. Results: Seven observational comparative studies were identified, of which four presented odds ratios adjusted for confounders. The odds ratios for operative mortality varied widely between studies. Assuming a central estimate of the odds ratio of 0.54 (95% CI 0.05–6.24), the decision model estimated that the incremental cost per quality adjusted life year (QALY) was £74,580/QALY with a probability of 9 and 16% of being cost-effective at standard cost-effectiveness thresholds of £20,000/QALY and £30,000/QALY, respectively. The Expected Value of Perfect Information over 10 years at a threshold of £20,000/QALY was £11.2 million. Operative mortality contributed to most of the uncertainty in the decision model. Conclusions: In the case of “maturing technologies”, decision modelling indicates the likely direction of costs and benefits and guides the development of further research projects. In our analysis of fEVAR versus OSR, decision uncertainty, particularly around operative mortality, might be effectively resolved by a short-term RCT, or possibly a well-conducted comparative observational study. Decision makers may consider that a conditional coverage decision is warranted with assessments required to make this type of recommendation depending on local priorities and circumstances. Keywords: Cost-effectiveness, Coverage with evidence development, Medical devices, Value of information Background Health technology assessment (HTA) agencies are charged with providing guidance to practitioners and *Correspondence:
[email protected] 1 Evidence Synthesis and Modeling for Health Improvement, Institute of Health Research, University of Exeter Medical School, South Cloisters, St Luke’s Campus, Exeter EX1 2LU, UK Full list of author information is available at the end of the article
patients based on a systematic and comprehensive assessment of the clinical and cost-effectiveness profile of health technologies. Assessing medical devices (MDs), in particular, raises several challenges which require careful consideration [1]. For a range of reasons, evidence on costs and effects relating to medical devices may be limited [2]. This situation, usually but not exclusively associated to MD evaluation, leads to a dilemma that typically
© The Author(s) 2018. This article is distributed under the terms of the Creative Commons Attribution 4.0 International License (http://creativecommons.org/licenses/by/4.0/), which permits unrestricted use, distribution, and reproduction in any medium, provided you give appropriate credit to the original author(s) and the source, provide a link to the Creative Commons license, and indicate if changes were made. The Creative Commons Public Domain Dedication waiver (http://creativecommons.org/ publicdomain/zero/1.0/) applies to the data made available in this article, unless otherwise stated.
Ciani et al. Cost Eff Resour Alloc (2018) 16:15
has proved challenging for HTA and policy makers. Making an early decision based on poor evidence carries a high risk of error that may be difficult to reverse, but delaying a decision until more evidence becomes available may leave current patients without effective treatment or health systems with inefficient technology. Fenestrated endovascular repair fEVAR is an example of such dilemma. Fenestrated EVAR might be considered a maturing innovation in the typology of Sculpher et al. [3], that is a technology early in its life cycle, usually limited to a few specialist centers, with an evidence base comprising case series and small RCTs. Decision modelling in these situations is unlikely to provide a definitive statement about whether a technology is cost-effective, but rather indicate the likely direction of costs and benefits, the circumstances under which the new technology might represent good value for money, and to guide the development of further research projects [3]. The aim of the study is to illustrate this approach through the clinical and cost-effectiveness evaluation of fEVAR compared to open surgical repair and to estimate the value of further research for the same decision problem. Abdominal aortic aneurysms (AAAs) occur when the main artery in the body develops a balloon-like bulge of diameter exceeding 3 cm. The prevalence of AAAs in the UK has been estimated at between 1.2 and 7.6% in those over 50 years [4]. The benefits of endovascular aneurysm repair (EVAR) compared to open surgical repair (OSR) of AAAs are well established by large multicenter randomized trials assessing all-cause or aneurysm related mortality and postoperative complications [5–7]. However, about 15% of AAAs are considered “complex” (cAAAs), i.e. aneurysms involving renal or visceral arteries or ‘juxta-renal AAAs’ [8]. Surgical treatment options for cAAAs include OSR, usually requiring suprarenal aortic cross-clamping, or fEVAR [8–10]. In fEVAR the stent-graft fabric extends over the renal arteries, but perfusion to these arteries is preserved via accurately placed windows (fenestrations) within the stent-graft fabric. The fEVAR procedure is more challenging than standard EVAR as graft positioning requires both longitudinal and rotational alignment of the fenestrations with the target vessels [11]. Although a small number of systematic reviews have sought to compare efficacy and safety outcomes of fEVAR compared to OSR, their conclusions have been limited by lack of available robust evidence [12–14]. In particular, these reviews noted that there were no randomised controlled trials (RCTs), but there were several registries and case series, some of which were large and long-running. This study evaluates the effectiveness, safety and costeffectiveness of fEVAR versus OSR for elective repair of
Page 2 of 14
cAAA in patients suitable for either procedure. Another solution for more complicated aneurysms is branched EVAR (bEVAR). The term ‘branched’ refers to the need to bridge the gap, created by increased diameter of aorta, between the main body of aortic stent graft and target vessels and not to any actual branch from the graft itself [11]. Based on the distinction between bEVAR and fEVAR in accordance with the Society of Vascular Surgery reporting standards on thoracic endovascular aortic repair [10], branched cAAAs endovascular procedures were excluded from this analysis.
Methods Systematic review and meta‑analysis
This updated systematic review was conducted and reported according to the Meta-analysis of Observational Studies in Epidemiology (MOOSE) reporting guidelines [17]. Data sources and search strategy
MEDLINE (via Ovid) was searched for previous systematic reviews or meta-analyses of fEVAR for the treatment of cAAAs. We also sought new primary studies published since the end date of the literature searches of the most recently undertaken systematic review (i.e. October 2013) [18] and up to 14th January 2015. A copy of the search strategy is available as an Additional file 1: Appendix S1. As this recent review found no RCTs, this updated study also includes observational evidence. Two reviewers (OC, RST) independently examined titles and abstracts of primary studies. Study selection
Relevant articles were obtained in full, and assessed against the inclusion/exclusion criteria described in Additional file 1: Table S1. Any disagreement was resolved through discussion. Data extraction and risk of bias assessment
Details were extracted for each study including: year and country of publication, sample size, age and gender distribution, duration of follow up, anatomical location of aneurysms, and details of implant used. Outcomes of interest were: operative mortality, late mortality, complications, re-interventions, and resource use during the primary admission (i.e. length of stay, operative time, blood, and intensive care). Study quality was assessed using a modified list of criteria developed for case series [19] and the addition of three criteria for comparative studies. Data extraction and risk of bias assessment was undertaken by one author (OC) and verified by another (RST).
Ciani et al. Cost Eff Resour Alloc (2018) 16:15
Page 3 of 14
Data analysis
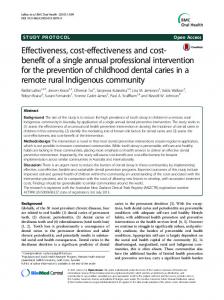
A decision analytic model was developed in E xcel®2012 (Microsoft Corporation, US) to estimate the lifetime cost and QALY of each procedure. The structure of the model was adapted from a previously published economic evaluation of conventional EVAR for AAA repair, using essentially the same structure, with parameters estimated from the systematic review [22]. The model consists of a lead-in period lasting 6 months, during which the cAAA repair is undertaken with fEVAR or OSR (Fig. 1). Perioperative survivors then enter a long-term three state Markov model, which extrapolates costs and outcomes over a lifetime horizon using 6-monthly cycles. During each cycle, patients may die of cAAA-related causes, such as rupture of the aneurysm, or die of other causes. Patients undergo surveillance with an outpatient visit and ultrasound every year after endovascular repair and every 5 years after open repair [23]. Survivors have an ongoing risk of re-intervention, e.g. to correct complications of the device such as endoleaks which might be detected by surveillance. Patients can have only one re-intervention per cycle, but can have more than one re-intervention over their lifetime. The risk of re-intervention depends Model structure
Where outcome data were consistently reported, results were pooled across studies using Der Simonian and Laird random-effects meta-analyses [20]. For operative mortality, we considered that treatment effects should only be pooled where authors made statistical adjustment for relevant confounding factors. For resource use, we considered that unadjusted differences were adequate as these variables are relatively less influenced by factors such as body mass index, leukocyte count or other biomarkers. Moreover, no studies reported between-groups adjusted comparison of these measures. Recommendations from the Cochrane Handbook for systematic reviews of interventions were followed to deal with missing data [20]. Heterogeneity was quantified using the I2 statistic and results displayed in a forest plot. All statistical analyses were performed using STATA® 13.1 StataCorp US. Cost‑effectiveness model
This economic evaluation was undertaken and reported according to the Consolidated Health Economic Evaluation Reporting Standards (CHEERS) statement [21].
Initial cAAA repair
Survival after cAAA repaira
Aneurysm-
Other cause
related deathb
death
cAAA = complex abdominal aortic aneurysms a
patients are at risk of re-intervention in each cycle, with hospital cost and diminished health-related
quality of life b
includes deaths related to aneurysm rupture, complications of the grafts, and re-interventions.
Fig. 1 Decision analytic model structure. cAAA complex abdominal aortic aneurysms. Patients are at risk of re-intervention in each cycle, with hospital cost and diminished health-related quality of life. Includes deaths related to aneurysm rupture, complications of the grafts, and re-interventions
Ciani et al. Cost Eff Resour Alloc (2018) 16:15
Page 4 of 14
on initial procedure (OSR or fEVAR) and time from initial cAAA repair, but is assumed independent between cycles. Re-interventions reduce health-related quality of life (HRQOL) and incur a hospital cost. Mortality risks related to re-intervention are captured in the estimate of aneurysm-related deaths. Perspective of the decision model and inputs required
Health outcomes were expressed in terms of qualityadjusted life years (QALYs). The perspective adopted was that of a publicly funded health system using an explicit cost-effectiveness threshold for decision making. The UK National Health Service (NHS) [24] is used here as an example, using thresholds in the range £20,000-£30,000 per QALY. The price year was 2016/17, and costs and benefits were discounted at an annual rate of 3.5% [24]. Table 1 summarises the main input variables required by the decision model and their distributions used to represent uncertainty. Parameter estimates for the model were obtained from the updated systematic literature
review, personal communication with the device manufacturer, and routine UK National Health Service (NHS) sources. Where specific estimates for fEVAR were unavailable, the literature on conventional EVAR was considered. The mean age at which cAAAs repair is undertaken was 73 years [25]. Mortality risks for non-AAA cause deaths were based on UK male population life tables [26]. Expected value of perfect information
Fenestrated EVAR is a relatively novel technology and the evidence relating to its costs and benefits is limited. In this regard, further research might be worthwhile if it reduces uncertainty and avoids the consequences of making a wrong decision about the use of the intervention. The expected value of perfect information (EVPI) estimates an upper bound for the value of a new study, if it could eliminate all uncertainty about which treatment was more cost-effective at the given cost-perQALY threshold. Partial EVPI (EVPPI) is also calculated using web-based emulator software [27]. EVPPI enables
Table 1 Mortality, re-intervention and HRQoL in the cost-effectiveness decision model Mean value used in the Distribution used in the model model
Source
Probability of AAA-related mortality, fEVAR, 0–6 m
Pr = 0.026
Beta (43,1627)
Additional file 1
Log-odds ratio, fEVAR vs OSR
− 0.61
N (Mean − 0.61, SE 1.22)
Meta-analysis of 4 studies (adjusted for case-mix)
Late mortality rate > 6 months–4 years, fEVAR
0.004
Gamma (6, 1/1558)
Additional file 1
Late mortality rate > 4–8 years, fEVAR
0.006
1.5 × 6 months–4 years
EVAR-1
Late mortality rate > 8 years, fEVAR
0.008
2 × 6 months-4 years
EVAR-1
Log Hazard ratio > 6 months-4 years, fEVAR vs OSR
0.38
N (0.38, 0.48)
EVAR-1
Log Hazard ratio > 4–8 years, fEVAR vs OSR
1.13
N (1.13, 0.57)
EVAR-1
Log Hazard ratio > 8 years, fEVAR vs OSR
1.76
N (1.76, 0.63)
EVAR-1
Probability, fEVAR
0.068
Beta (81, 1117)
Additional file 1
Log odds ratio, fEVAR vs OSR
− 0.87
N (− 0.87, 0.24)
Meta-analysis of 3 studies (unadjusted for case-mix)
0.087
Gamma (132, 1/1507)
Additional file 1
As > 6 months–4 years
Assumption
Early mortality
Late AAA mortality
Re-interventions 0–6 months
Re-interventions > 6 months Re-intervention rate > 6 months-4 years, fEVAR Re-intervention rate > 4–8 years, fEVAR
As > 6 months–4 years
Assumption
Log Hazard ratio > 6 months–4 years, fEVAR vs OSR
Re-intervention rate > 8 years, fEVAR 1.84
N (1.84, 0.35)
Additional file 1
Log Hazard ratio > 4–8 years, fEVAR vs OSR
0.47
N (0.47, 0.34)
EVAR-1
Log Hazard ratio > 8 years, fEVAR vs OSR
0.47
N (0.47, 0.34)
EVAR-1
After AAA repair, baseline
0.804
N (0.804, 0.021)
EVAR-1
Decrement after OSR 0-6 m
− 0.060
N (− 0.060, 0.017)
EVAR-1
N (− 0.060, 0.026)
EVAR-1
− 0.149
N (− 0.149, 0.017)
EVAR-1
Health related quality of life, EQ-5D index
Decrement in the 6 months following a re-intervention Decrement in the 6 months before death
− 0.060
AAA Abdominal aortic aneurysms; OSR Open surgical repair; m months; yr years
Ciani et al. Cost Eff Resour Alloc (2018) 16:15
identification of those parameters that contribute particularly highly to decision uncertainty. A decision timeframe of 10 years is used, to allow for obsolescence and product innovation by competing technologies. We assume that 1782 cAAA patients would be eligible for repair each year in the UK, based on German health insurance data [25] adjusted for UK population size. Net population benefit was calculated at cost-effectiveness thresholds used in the UK. Decision uncertainty was estimated through probabilistic sensitivity analysis using 1000 Monte-Carlo simulations of the model [28]. Decision making and the value of further research
We used a recently developed framework to characterize the sources of uncertainty and to identify the most appropriate decision option for fEVAR given the available evidence [15, 29]. Four decision options were considered: accept fEVAR for immediate and general use in the national heath service in indicated patients (accept fEVAR), reject fEVAR (i.e. accept OSR), accept fEVAR provisionally but conditioned upon the collection of further evidence (accept with research, AWR), or reject fEVAR for general use until further evidence becomes available (only in research, OIR).
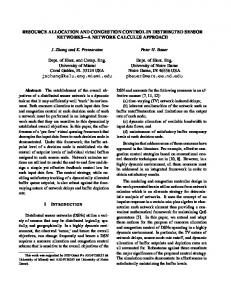
Fig. 2 Flow diagram—study selection process
Page 5 of 14
Results Systematic review and meta‑analysis
The updated systematic review study selection process is illustrated in Fig. 2. A total of 22 studies involving 1641 fEVAR patients were included (see Additional file 1: Appendix S2 for list of included studies). Whilst we did not find any randomised trials comparing fEVAR and OSR, we did include seven comparative observational studies, reporting outcomes for both fEVAR and OSR patients [30–36]. Study characteristics
A summary of the study and patient population characteristics and the interventions is reported in Additional file 1: Table S2. Study sample sizes were small, with a median of 78 fEVAR treated patients, a median patient age of 74 years and a median follow-up of 18.4 months. All studies showed high to moderate risk of bias as reported in Additional file 1: Table S3. Relative risk of operative mortality
Seven observational studies compared perioperative [30, 36] or 30-day [31–35] mortality between fEVAR and OSR (Additional file 1: Table S4). The pooled odds ratio for mortality across all seven studies was 0.60 (95% CI 0.23– 1.60, p = 0.014) (Additional file 1: Figure S1). However,
Ciani et al. Cost Eff Resour Alloc (2018) 16:15
there was a high degree of heterogeneity between studies (I2 statistic: 62.6%, p = 0.014). Risk of bias for estimate of relative risk of operative mortality
In a context of poor available evidence, it is even more important to explore the heterogeneity and evaluate the risk of bias in order to reliably use the information for decision-making purposes. One source of heterogeneity was the method used by the study to account for possible confounding. Three studies did not make any adjustment for confounding variables [31–33]. Of the four that took account of confounding variables in some way, one used multivariate regression [35], one used propensity score matching [34], and two used a published risk score [37] to estimate what operative mortality hypothetically would have been in the fEVAR patients had they had undergone open repair [30, 36]. More on the risk of bias assessment performed for estimate of relative risk of operative mortality is reported in Additional file 1: Appendix S3. Relative risk of operative mortality stratified by study methodology
To further explore the heterogeneity, we stratified the pooled estimate of effect size according to the
Fig. 3 Pooled odds ratio of adjusted operative mortality fEVAR vs OSR
Page 6 of 14
methodology in the study employed to adjust for confounders. The Raux study [34] (propensity score matching) found an OR of 5.1 (95% CI 1.1–24). The Tsilimparis study [35] (multivariate regression) found an OR of 0.19 (95% CI 0.04–0.83). The two studies that used the V-POSSUM risk score 26,32 found a pooled OR of 0.37 (95% CI 0.20–0.69). The remaining studies that did not adjust for confounders found a pooled OR of 0.98 (95% CI 0.26–3.7). Relative risk of operative mortality used as input to the decision model
The pooled estimate of the odds ratio over the four studies that performed some form of risk adjustment is 0.54 (95% CI 0.16–1.88) (Fig. 3). The decision model uses the OR estimate of 0.54 as the base-case (log(OR) = μ = − 0.61, SE(μ) = 0.644). However, this SE from random-effects meta-analysis does not take account of the full distribution of effect sizes across the heterogeneous studies [38]. In order to make predictions about the likely effect size that might occur in a future new study or in the general practice use, we considered the estimate of τ2 from the four adjusted studies in the random-effects meta-analysis [30, 34–36] (τ2 = 1.15). This
Ciani et al. Cost Eff Resour Alloc (2018) 16:15
suggests a mean and confidence interval for a prediction for a new study of 0.54 (95% CI 0.05–6.24). Baseline risk of operative mortality used as input to the decision model
Twenty-two studies reported operative mortality after fEVAR, with 43 deaths in 1670 patients (mean rate 2.6%) [30–36, 39–53]. However, there was considerable heterogeneity, with operative mortality varying from 0% to 9.5% (Additional file 1: Table S5). Analysis of UK national hospital episode statistics indicates the mean operative mortality after OSR in clinical practice, as opposed to selected case series in specialist centres, is 14%, with considerable heterogeneity [54]. In the model, we use the mean operative mortality after fEVAR from the systematic review as the probability of AAA death during the first model cycle in the base-case and vary this from 0.5% to 9.5% in sensitivity analyses, assuming the baseline rate and the relative risk are independent. Late aneurysm‑related mortality
One study included in the review compared late aneurysm related mortality with about 1 year of follow-up between fEVAR and OSR [31] and found no late AAArelated deaths in either group. Thirteen studies [31, 32, 36, 39–42, 44–46, 49, 51, 52] reported late AAA mortality after fEVAR. The overall rate of late AAA mortality was 6 deaths in 1558 patientyears (i.e. an average of 0.004 late AAA deaths per person-year) although 10 studies [36, 39–47] reported no late AAA-related deaths (Additional file 1: Table S5). The decision model assumes this 0.004 rate of late AAA mortality after fEVAR from > 6 months to 4 years (as found by this review), but that this rate would increase by 50% between 4 years and 8 years and doubles after 8 years (as found after conventional EVAR by the EVAR-1 trial [22]). Furthermore, the base-case model assumes relative risk of late AAA mortality would be greater after fEVAR compared with OSR (as found by the EVAR-1 trial [22]). Sensitivity analyses explore a scenario where the rate of late AAA mortality does not increase over time and is the same as OSR (as found by Chisci et al. [31] study at 1 year) over the patient’s lifetime. Early and late re‑interventions
Eleven studies reported a total of 81 early re-interventions (in-hospital or 30-day) in 1198 patients after fEVAR, an average probability of 0.07 [30, 31, 34, 39, 42, 43, 47, 50, 52]. Three studies compared the risk of early (in-hospital or 30-day) re-interventions for fEVAR compared to open repair [30, 31, 35]. All found more re-interventions after open repair with a pooled OR across the three trials of 0.42 (95% CI 0.26–0.68) (Additional file 1: Figure S4).
Page 7 of 14
These results were not adjusted for case-mix. Eleven studies reported a total of 132 late re-interventions in 1507 patient-years of follow-up after fEVAR, an average rate of 8.8 per 100 patient-years. No trial reported late reinterventions after open repair [32, 36, 41, 47, 48, 51, 52]. As the studies did not provide sufficient information on how the re-interventions rate might change over time, the decision model uses the rates of early re-interventions from the literature review, and the relative risk of late re-intervention (fEVAR vs OSR) from the EVAR-1 RCT [22] that compared EVAR versus open repair for conventional AAA, which was 6.29 (95% CI 3.09–12.78) from 6 months to 4 years, 1.60 (95% CI 0.81–3.15) from 4 to 8 years, and 1.51 (1.71–3.19) after 8 years [55]. Resource consumption
Five studies provided comparative information on one or more healthcare resource use outcomes (Table 2, Table 3) [30–33, 35]. There was considerable heterogeneity across most of the resource use data. The decision model uses the average estimates of procedure resource use (i.e. length of stay, operating theatre, blood units and Intensive Care Unit stay) costed at UK prices in 2016/17 [55, 56]. The list price of the fEVAR device was £16,500 including extra stent parts and accessories (personal communication with Cook Medical, at 2015 prices). Sensitivity analyses were conducted by varying the price of the stent to reflect possible discounts. A reduction in cost might also be achieved if use of fEVAR was associated with lower length of stay or less use of other hospital resources, or if surveillance and re-interventions could be accurately targeted at patients with higher risk of complications. Other unit costs associated with the index procedure are given in Table 3. The cost of a AAA-related re-intervention was taken as £8670 (SE 831) [55]. Health‑related quality of life
No study reported health related quality of life (HRQOL) after fEVAR or OSR. The EVAR-1 trial found that HRQOL was better after conventional EVAR than OSR for the first 6 months (mean difference in EQ-5D-3L 0.060, SE(0.017)) but there was no difference by 1 year [22]. HRQOL is considerably diminished in the 6 months after a re-intervention and in the 6 months preceding death [57]. Complications
Peri-operative complications were poorly and heterogeneously reported, especially after open repair. The studies did not give a clear indication of the seriousness of the complication or its duration. Therefore complications were not explicitly costed or associated with QALYs in the model. However, some measure of their impact is
Ciani et al. Cost Eff Resour Alloc (2018) 16:15
Page 8 of 14
Table 2 Resource consumption in fEVAR and OSR patients fEVAR
OSR
Pooled WMD (95% CI)
N
Mean (SD)
N
Mean (SD)
16
14.8 (17.3)
29
13 (8.0)
Length of stay (days) Moore 2006 Donas 2012
29
3.5 (1.1)
31
7.2 (3.2)
Canavati 2013c
53
7.0 (3.3)
54
12 (9.6)
Tsilimparis 2013
246
3.0 (4.3)
1091
10 (9.6)
16
268 (113.0)
29
205 (196.0)
− 4.83 (− 7.33 to − 2.32) I2 = 87.4% p