implementation, our algorithm can balance host utilization .... a single rack, all physical machines are connected to a top- ... Receive. Send. (c) Traffic rate matrix. 10. 20. 30. 40. 10. 20. 30. 40. 0. 50. 100. 0. 10 .... Finding the Best VM to Migrate.
Virtual Machine Migration in an Over-committed Cloud
∗
Xiangliang Zhang∗ , Zon-Yin Shae† , Shuai Zheng∗ , and Hani Jamjoom† King Abdullah University of Science and Technology (KAUST), Saudi Arabia † IBM T. J. Watson Research Center, Hawthorne, NY
Abstract—While early emphasis of Infrastructure as a Service (IaaS) clouds was on providing resource elasticity to end users, providers are increasingly interested in over-committing their resources to maximize the utilization and returns of their capital investments. In principle, over-committing resources hedges that users—on average—only need a small portion of their leased resources. When such hedge fails (i.e., resource demand far exceeds available physical capacity), providers must mitigate this provider-induced overload, typically by migrating virtual machines (VMs) to underutilized physical machines. Recent works on VM placement and migration assume the availability of target physical machines [1], [2]. However, in an over-committed cloud data center, this is not the case. VM migration can even trigger cascading overloads if performed haphazardly. In this paper, we design a new VM migration algorithm (called Scattered) that minimizes VM migrations in over-committed data centers. Compared to a traditional implementation, our algorithm can balance host utilization across all time epochs. Using real-world data traces from an enterprise cloud, we show that our migration algorithm reduces the risk of overload, minimizes the number of needed migrations, and has minimal impact on communication cost between VMs.
I. I NTRODUCTION Infrastructure as a Service (IaaS) is changing how computing resources are being managed, delivered, and consumed. Cloud providers are able to benefit from economies of scale by pooling large amounts of computing resources and running the underlying infrastructure at higher utilization levels than traditional—non-cloud—data centers. Providers also have the opportunity to over-commit their resources, relying on natural fluctuations—peaks and valleys—in computing demands across individual users. Over-commitment of resources is not a new concept. It is widely used in the airline industry, for example, to maximize seat utilization in departing flights. An airline can sell a number of extra tickets for any particular flight, hedging that—on average—a greater number of passengers miss their flight. On (supposedly) rare occasions, this hedge can fail; in such case, the airline must shift some passengers to different flights. Similarly, over-commitment in IaaS clouds allows providers to sell more resources than they actually have. A physical machine with 8 CPUs, for example, can be sold to 16 users, each being offered 1 CPU per virtual machine (VM). In such case, the physical machine has an over-commit ratio of 2. The provider is then hedging that—
on average—each user only needs half of the requested resources. While a high over-commit ratio increases the average utilization of the underlying resources, it also increases the risk of provider-induced overload. This type of overload occurs when (over-committed) users demand enough of their resources such that—in combination—they exhaust all available physical capacity. In the example above, if two users demand 100% of their leased CPU resource, while the rest remain exactly at 50%, then some users will not get their fair share. Depending on the scheduling policy, some users (possibly all) will experience provider-induced overload. In the case of memory, provider-induced overload can trigger dramatic drop in application performance [3]. In general, this problem can be solved by migrating certain VMs on the overloaded machine to other—relatively under-loaded— machines. The difficulty arises when the entire data center is over-committed. Deciding on which VMs to move and where to move them is important because migration should mitigate the overload without raising the risk of further overloads on the destination machines. It should also avoid negatively impacting the underlying network. In this paper, we introduce Scattered, an online migration algorithm that targets over-committed cloud environments. The distinguishing characteristics of our algorithm include (1) accounts for over-committed resources across all physical machines, (2) identifies target VMs for migration based on the degree of correlation in their workloads, (3) considers exchanging (or swapping) of VMs across physical machines to achieve its targets, and (4) accounts for network topology to minimize the impact of migration on VM communication cost. Using extensive simulations based on real workload traces from a production cloud environment, we show that our algorithm is able to (1) maximize the number of overcommitted VMs, while using fewer resources, (2) reduce the risk of cascading overloads, and (3) minimize the impact on the communication cost among VMs. The remainder of this paper is organized as follows. Section II surveys related work. Section III introduces the data center and network model used for capturing the impact of migration on VM communication. Section IV describes our proposed migration algorithm, Scattered. Section V evaluates the efficacy of Scattered. Finally, Section VI concludes and gives our perspectives on future research.
c 2012 IEEE 978-1-4673-0269-2/12/$31.00 ⃝
196
II. R ELATED W ORK VM migration has been widely studied in recent years [1], [4], [5], [6], [2]. Sandpiper [1], a VM migration system, introduced two algorithms: one for deciding when to migrate and the other for determining what and where to migrate. It uses a greedy heuristic to move VMs from the most overloaded host to the least-overloaded host. Shrivastava et al. focused on minimizing network traffic while considered both inter-VM dependencies and the underlying network topology when making migration decisions [2]. Entropy [7] proposed an approach to migrate tasks within a cluster based on constraint programming. In [4], the authors outline a scheme for distributing resources among VMs on the same physical server. They consider the relative priorities of different VMs and their inter-dependencies while allocating resources to them. Zhao and Figueiredo estimated migration costs based on the configurations and running states of the migrated VMs; they used their estimates for preparing resource reservation [8]. The work in [9] considers the load on the communication paths that connect servers to shared network storage. Wood et al. used live migration in addition to a sharing-aware VM placement system for optimizing VM placement as workloads change [10]. None of these works considers the combined effects of VM migration in highly over-committed environments. III. C LOUD DATA C ENTER M ODEL We consider a relatively standard data center architecture (Figure 1) that consists of a series of connected racks. Within a single rack, all physical machines are connected to a topof-rack switch. While there are numerous ways to connect racks together, we assume that the data center uses VL2 architecture [11] or one of its derivatives. Briefly, VL2 is a 3-tier architecture that uses Valiant Load Balancing to spread traffic uniformly across network paths. This architecture provides close to fixed communication cost across all racks. From a migration perspective, this architecture has a significant influence on the performance of deployed applications. An application typically consists of multiple communicating VMs (e.g., three-tier Web application, Hadoop, ERP). The pairwise traffic rates between VMs vary across applications, workloads, time-of-day, etc. Clearly, placing VM pairs with heavy communication on host machines with low network cost can increase network scalability and reduce traffic latency. The consumption of network resources has been considered as one optimization objective when placing VMs [12], [2]. In this paper, we build on their model to derive a more suitable migration strategy in highly overcommitted environments. Estimating network consumption involves two components. One is the communication cost, which depends on the underlying network architecture within a data center. The other is the traffic rate between any VM pair. For example, when 𝑉 𝑀𝑥 is moved from host 𝐴 to host 𝐵, the traffic rate
Figure 1.
General architecture of cloud data centers.
between 𝑉 𝑀𝑥 and other VMs will not change. However, the communication cost between 𝑉 𝑀𝑥 and other VMs on host 𝐴 will probably increase, while the communication cost between 𝑉 𝑀𝑥 and VMs on host 𝐵 will decrease. In order to evaluate whether the migration of VMs will raise consumption of network resources, we use a criterion for measuring the aggregate traffic rates perceived by every switch as introduced by Meng et al. in [12]. It is defined by ∑∑ 𝑇𝑖𝑗 𝐶𝑖𝑗 , (1) 𝑆= 𝑖
𝑗
where 𝑇𝑖𝑗 is the traffic rate from 𝑉 𝑀𝑖 to 𝑉 𝑀𝑗 , and 𝐶𝑖𝑗 is the communication cost between 𝑉 𝑀𝑖 to 𝑉 𝑀𝑗 . The communication cost matrix can be analytically expressed according to the network architecture. Basically, VMs located on the same physical machine have lower communication cost than the ones on different machines. We define the resulting communication cost matrix as: 𝐶𝑖𝑗
⎧ 0, ⎨ 1, = 3, ⎩7,
if if if if
𝑖 = 𝑗; 𝑖 and 𝑗 are hosted by the same machine; 𝑖 and 𝑗 are hosted by the same rack (switch); 𝑖 and 𝑗 are hosted by different racks. (2)
The traffic rate matrix expresses how often VMs communicate with each other. We use two traffic models for characterizing different VMs communication modes, global traffic model and partitioned traffic model. Global traffic model assumes that VMs communicate with each other at a constant rate, following a Gaussian distribution given as: { 𝑇𝑖𝑗 =
0, if 𝑖 = 𝑗; 𝑟 ∼ 𝑁 (𝜇, 𝜎 2 ),
if 𝑖 ∕= 𝑗.
(3)
In this paper, we set 𝜇 = 1, and 𝜎 2 = 0.25.
2012 IEEE Network Operations and Management Symposium (NOMS)
197
600 400
100
200
50
0
0
10 20 30 40 (a) Aggregation outgoing rate Receive
0
50
IV. C ONSTRAINED VM M IGRATION 0 10
20
20
In this section, we first describe a general framework for VM migration. We then introduce Scattered, a new algorithm for virtual machine migration when physical resources are over-committed.
30
30
A. General Framework for Migration
40
40
Send
10
50 10 20 30 40 500 0 (c) Traffic rate matrix (b) Aggregation incoming rate
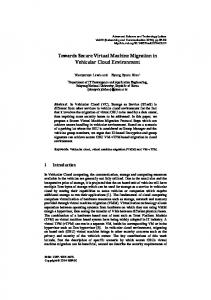
Figure 2. Traffic rate matrix (c) generated by partitioned traffic model based on aggregation outgoing rate (a) and incoming rate (b).
The partitioned traffic model allows uneven traffic rates among VMs. From our observation of a real-world enterprise cloud data center, some VMs can have much higher outgoing or incoming traffic volume than other. For example, Figures 2 (a) and (b) show the outgoing and incoming aggregate traffic rates from 48 randomly selected VMs, respectively. VM 33 has outgoing and incoming traffic rate more than 400 MBytes/min, which is much higher than the others. Our monitoring infrastructure (which is typical of most data centers) collect information on individual VMs. It collects measurements (at a 15-min granularity, averaged across each time epoch) for the usual resource metrics, such as CPU utilization, paging, network traffic (in bound and out bound), etc. The monitoring data, thus, does not collect network traffic between any two VMs. Nonetheless, we derive the uneven traffic rate matrix from the aggregation of outgoing and incoming rates by: ⎧ ⎨0, if 𝑖 = 𝑗; 𝑂𝑖 𝐼 𝑗 (4) 𝑇𝑖𝑗 = 1 ∑ ⎩ ∑ , if 𝑖 ∕= 𝑗, 𝑄 𝑘 𝑂𝑘 𝑘 𝐼 𝑘 where 𝑂𝑖 and 𝐼𝑖 are the aggregate outgoing and incoming rates of 𝑉 𝑀𝑖 , and 𝑄 is a normalization scalar for making E(𝑇𝑖𝑗 ) = 1 as we assumed in global traffic model in Equation 3. Figure 2 (c) shows the traffic rate matrix derived from Figures 2 (a) and (b). The sum of matrix by columns and by rows approximates the aggregation of outgoing and incoming rate. We see several VM pairs communicate in high rates as shown in red color. When evaluating the impact on network consumption, we will use the traffic rate 𝑇 defined by either Equation 3 or Equation 4, and communication cost 𝐶 defined by Equation 2
198
to compute the observation value 𝑆 given in Equation 1. Value 𝑆 computed during the migration process that causes changes on 𝐶 will be compared with baseline 𝑆 obtained with 𝐶 that is defined based on random VM placement.
When resources of a physical machine are aggressively over-committed, all hosted VMs are under a higher risk for experiencing provider-induced overload. As mentioned earlier, provider-induced overload occurs when a VM requires more resources than what it needs, but less resources than what it leased. Ideally, an effective cloud resource management system should have the following abilities: 1) Estimates the risk of overload; 2) Identifies the best VM(s) to migrate; 3) Identifies the most appropriate target physical machine to migrate to; 4) Minimizes the impact on the underlying infrastructure (e.g., minimize the number of migrations). In this paper, we focus on the last three abilities and investigate how provider-induced overload (due to overcommitment) can be effectively mitigated in a highlyconstrained environments. While we do not directly study the first ability (in the list above), we believe that successful validation of migration strategies will directly benefit any future study that focuses on overload estimation. Before introducing the general framework of our migration algorithm, we formalize some notations. Assuming the cloud environment in Section III, the hosting of VMs is represented by a mapping function 𝜃 : [1, ..., 𝑁𝑣𝑚 ] → [1, ..., 𝑁𝑝𝑚 ]. 𝜃(𝑖) = ℎ means that VM 𝑖 is located on physical machine ℎ. Machine ℎ located on rack 𝑟 is noted by 𝛿(ℎ) = 𝑟. We use 𝑢𝑡𝑖−ℎ to refer to the number of processors used by VM 𝑖 hosted by machine ℎ monitored at time 𝑡. It is important to note that, in this paper, we only consider two types of resources: CPU and network. The former is used to capture resource requirements within a single VM. The latter is used to capture resource requirements across VMs. Our approach can be easily generalized to other resources (namely, memory and disk). To maintain simplicity, we chose to omit them from our discussion. Given the above assumption, Algorithm 1 captures the generic approach to overload mitigation through VM migration. On each machine, the total utilization of its hosted VMs is monitored. If the placed VMs use more resources than their physical capacity, the corresponding host machine will be tagged as being overloaded. Without loss of generality, we assume that all physical machines have the same capacity.
2012 IEEE Network Operations and Management Symposium (NOMS)
Algorithm 1: VM migration through online monitoring 𝑢𝑡𝑖−ℎ ,
Input: Utilization online monitored where 𝑖 = 1...𝑁𝑣𝑚 and ℎ = 1...𝑁𝑝𝑚 ; Capacity of physical machine 𝑃 ; Assignment of VMs 𝜃 : [1, ..., 𝑁𝑣𝑚 ] → [1, ..., 𝑁𝑝𝑚 ]; Location of hosts on racks 𝛿 : [1, ..., 𝑁𝑝𝑚 ] → [1, ..., 𝑁𝑟𝑎𝑐𝑘 ]; Initialization: 𝜃, randomly assign a equivalent number of VMs to each physical machine; 𝛿, define rack location of VMs according the position of their host machine; 𝑂𝑣𝑒𝑟𝐿𝑖𝑠𝑡 = {}; Observing over-commitment and Migrating VMs: while 𝑡 > 1 do for ℎ = ∑1 to 𝑁𝑝𝑚 do if 𝑎𝑙𝑙 𝑘,𝜃(𝑘)=ℎ 𝑢𝑡𝑘−>ℎ > 𝑃 then report machine ℎ has over-commitment problem; 𝑂𝑣𝑒𝑟𝐿𝑖𝑠𝑡 = 𝑂𝑣𝑒𝑟𝐿𝑖𝑠𝑡 ∪ ℎ; if OverList ∕= ∅ then Migrating VMs by Naive − migration(𝑂𝑣𝑒𝑟𝐿𝑖𝑠𝑡, 𝜃, 𝛿, 𝑢𝑡𝑖−ℎ , 𝑃 ); or by Scattered − migration(𝑂𝑣𝑒𝑟𝐿𝑖𝑠𝑡, 𝜃, 𝛿, 𝑢𝑡𝑖−ℎ , 𝑃 );
Overloaded hosts in the 𝑂𝑣𝑒𝑟𝐿𝑖𝑠𝑡 will be processed by the core migration algorithm (LVF or Scattered, described in the following sections). The ultimate goal of migration is clearly to mitigate the overload problem. Mitigation can be achieved in two manners: (i) move one or more VMs from an overloaded machine to relatively under-loaded machines; (ii) exchanging one VM at an overloaded machine with a VM at another machine. As expected, to minimize the impact on running applications, the number of moves and exchanges should be minimized. B. Largest VM First Migration Algorithm The most natural choice to mitigating overload is to move overloaded VMs with the largest amount of resource requirements. We call this Largest VM First (LVF). The intuition is that moving the larger VMs will reduce the number of needed migrations. This technique broadly captures many existing techniques [1], [2]. The pseudo-code of LVF migration algorithm is shown in Algorithm 2. We use LVF as a baseline for comparison against our proposed technique. It also serves as the basis for our enhanced (Scattered) algorithm. Counting Free Capacity. At Step 1, we collect U as a vector representing the utilization of all VMs hosted at the overloaded host ℎ𝑜 . 𝑂 is then computed as the amount of free capacity at ℎ𝑜 . It is obviously negative at the start. Steps 3 and 4 check the free capacity of all machines. Migration
Algorithm 2: LVF migration algorithm Function Naive − migration(𝑂𝑣𝑒𝑟𝐿𝑖𝑠𝑡, 𝜃, 𝛿, 𝑢𝑡𝑖−ℎ , 𝑃 ) for each ℎ𝑜 ∈ 𝑂𝑣𝑒𝑟𝐿𝑖𝑠𝑡 do 1. U = [𝑢𝑡𝑘−ℎ𝑜 ], 𝑘 ∈ {𝑘∣𝜃(𝑘) = ℎ𝑜 } ∑ 2. 𝑂 = 𝑃 − U 3. for ℎ = 1 to 𝑁𝑝𝑚 do∑ 4. 𝐹 𝑟𝑒𝑒(ℎ) = 𝑃 − 𝑎𝑙𝑙 𝑘,𝜃(𝑘)=ℎ 𝑢𝑡𝑘−ℎ 5. 𝑀 = {} 6. while (𝑂 < 0) & (U ∕= ∅) do 7. 𝑘∗ = closest(−𝑂, U, ’greater’) 8. if 𝑘∗ = ∅ then 9. 𝑘∗ = closest(−𝑂, U, ’smaller’) 10. 𝐻 = {ℎ∣𝛿(ℎ) = 𝛿(ℎ𝑜 ), 𝑢𝑡𝑘∗ −ℎ𝑜 < 𝐹 𝑟𝑒𝑒(ℎ)} 11. if 𝐻 = ∅ then 12. 𝐻 = {ℎ∣𝑢𝑡𝑘∗ −ℎ𝑜 < 𝐹 𝑟𝑒𝑒(ℎ)} 13. if 𝐻 ∕= ∅ then 14. ℎ∗ = argmax(𝐹 𝑟𝑒𝑒(ℎ𝑡𝑜 ∈ 𝐻)) 15. 16. 17. 18.
ℎ𝑡𝑜
𝑀 = 𝑀 ∪ (𝑘∗ , ℎ∗ ) 𝐹 𝑟𝑒𝑒(ℎ∗ ) = 𝐹 𝑟𝑒𝑒(ℎ∗ ) − 𝑢𝑡𝑘∗ −ℎ𝑜 𝑂 = 𝑂 + 𝑢𝑡𝑘∗ −ℎ𝑜 U = U∖𝑢𝑡𝑘∗ −ℎ𝑜
19. if ∣𝑀 ∣ > 2 then 20. 𝑋 = exchange(ℎ𝑜 , 𝜃, 𝑢𝑡𝑖−ℎ ) 21. if 𝑋 ∕= ∅ then 22. 𝑀 = 𝑋 23. else if 𝑂 < 0 then 24. 𝑋 = exchange(ℎ𝑜 , 𝜃, 𝑢𝑡𝑖−ℎ , 𝑂, 𝐹 𝑟𝑒𝑒, 𝑀 ) 25. 𝑀 = 𝑀 ∪ 𝑋 26. for each (𝑘∗ , ℎ∗ ) ∈ 𝑀 do 27. 𝜃(𝑘∗ ) = ℎ∗
pairs will be saved in set 𝑀 , which is initialized to be empty at Step 5. The algorithm continues to search for VMs to move and their corresponding destination hosts until free capacity 𝑂 is positive or all VMs are moved out. Finding the Best VM to Migrate. At Step 7, the candidate VM to move is first selected by function closest, described in Algorithm 3. The selected VM 𝑘 ∗ has the closest utilization value that is larger than −𝑂. This selection criterion ensures that moving out 𝑘 ∗ immediately turns 𝑂 positive and the new total utilization contributed by rest VMs is the closest one to capacity 𝑃 . In other words, after moving out 𝑘 ∗ , machine ℎ𝑜 will be safe and its resources are used to the greatest extent possible. If Step 7 fails (when no VM has larger utilization than −𝑂), Step 9 chooses VM 𝑘 ∗ that has the closest utilization value but smaller than −𝑂. When all VM utilizations are smaller than −𝑂, in this case, 𝑘 ∗ has the largest utilization at ℎ𝑜 .
2012 IEEE Network Operations and Management Symposium (NOMS)
199
Algorithm 3: Function of closest Function 𝑘 = closest(𝑂, U, ’para’) Find an element in U who has the closest value to 𝑂 1. if para is greater then 2. 𝑘 = argmin(U(𝑡)∣U(𝑡) > 𝑂) 𝑡
3. else if para is smaller then 4. 𝑘 = argmax(U(𝑡)∣U(𝑡) < 𝑂) 𝑡
Finding the Target Host to Accept Migrated VM. Once a VM 𝑘 ∗ is selected to be moved, its new host ℎ∗ is decided in Steps 10 to 14. ℎ∗ is the host with largest free capacity, not only than utilization of 𝑘 ∗ , but also than all other nonoverloaded hosts. The candidate of new host is firstly sought among hosts in the same rack as ℎ𝑜 (𝛿(ℎ) = 𝛿(ℎ𝑜 )). If no host is available inside the rack, candidates are searched in other racks. A pair of (𝑘 ∗ , ℎ∗ ) is then added to migration set 𝑀 . The free capacity and utilization vector are then updated at Steps 16 to 18. When to Exchange VMs. There is a scenario where too many VMs have to be moved because ℎ𝑜 has a large enough VM that cannot be accepted by any host. It can occur at Step 12, where 𝐻 is empty because utilization of candidate 𝑘 ∗ is not less than any free capacity of non-overloaded hosts. Therefore, many VMs with small utilization are moved out for making 𝑂 positive. In order to keep the number of migrations small, host ℎ𝑜 can exchange this VM 𝑘 ∗ with a VM locating at another host. Another scenario is that overload cannot be mitigated by going through Steps 6 to 18. Free capacity 𝑂 remains negative after moving out 1 or 2 VMs. The remaining VMs at ℎ𝑜 cannot be moved out because their utilization is so large that no host can accept them. Exchanging VMs can solve the problem by moving one of the VMs from ℎ𝑜 to ℎ and taking one VM from ℎ to ℎ𝑜 . In Algorithm 2, we check the first scenario at Step 19 by seeing if the number of migration pairs is more than a threshold, which is set to 2 because one exchange involves two VM moves. Function exchange (Algorithm 4) is then used to find the most appropriate pair of VMs to exchange. If the returned exchange set 𝑋 is not empty, the migration set is changed to be 𝑋 and moving pairs suggested before are dismissed. The second scenario is checked at Step 23. Function exchange is used with three more parameters for finding VMs to exchange in addition to the moving set 𝑀 . Exchanging VMs. Function exchange can find exchange candidates either among all VMs on overloaded host ℎ𝑜 (Step 1 to 6), or among the remaining VMs on ℎ𝑜 after moving (Step 7 to 8). The latter takes 𝑂, 𝐹 𝑟𝑒𝑒 and 𝑀 from function arguments with values after moving, while the former recomputes 𝑂, 𝐹 𝑟𝑒𝑒 and 𝑀 regardless of the
200
Algorithm 4: Function of exchange Function 𝑋 = exchange(ℎ𝑜 , 𝜃, 𝑢𝑡𝑖−ℎ , 𝑂, 𝐹 𝑟𝑒𝑒, 𝑀 ) Find two VMs at different hosts to exchange 1. if number of input arguments = 3 then 2. U = [𝑢𝑡𝑘−ℎ𝑜 ], 𝑘 ∈ {𝑘∣𝜃(𝑘) = ℎ𝑜 } ∑ 3. 𝑂 = 𝑃 − U 4. for ℎ = 1 to 𝑁𝑝𝑚 do∑ 5. 𝐹 𝑟𝑒𝑒(ℎ) = 𝑃 − 𝑎𝑙𝑙 𝑘,𝜃(𝑘)=ℎ 𝑢𝑡𝑘−ℎ 6. 𝑀 = {} 7. else 8. U = [𝑢𝑡𝑘−ℎ𝑜 ], 𝑘 ∈ /𝑀 9. 𝐵𝑒𝑠𝑡 = 0 10. 𝐻 = {ℎ∣𝛿(ℎ) = 𝛿(ℎ𝑜 ), 0 < 𝐹 𝑟𝑒𝑒(ℎ)} 11. if 𝐻 = ∅ then 12. 𝐻 = {ℎ∣0 < 𝐹 𝑟𝑒𝑒(ℎ)} 13. for each 𝑢𝑡𝑘−ℎ𝑜 ∈ U do 14. for each ℎ𝑡𝑜 ∈ 𝐻 do 15. Uto = [𝑢𝑡𝑘−ℎ𝑡𝑜 ], 𝑘 ∈ {𝑘∣𝜃(𝑘) = ℎ𝑡𝑜 } 16. 𝑘∗ = closest(𝑂 + 𝑢𝑡𝑘−ℎ𝑜 , Uto , ’smaller’) 17. 𝑂𝑛𝑒𝑤 = 𝑂 + 𝑢𝑡𝑘−ℎ𝑜 − 𝑢𝑡𝑘∗ −ℎ𝑡𝑜 18. 𝐹 𝑟𝑒𝑒𝑛𝑒𝑤 = 𝐹 𝑟𝑒𝑒(ℎ𝑡𝑜 ) + 𝑢𝑡𝑘∗ −ℎ𝑡𝑜 − 𝑢𝑡𝑘−ℎ𝑜 𝑡𝑜 𝑛𝑒𝑤 19. if (𝐹 𝑟𝑒𝑒𝑡𝑜 > 0) & (𝑂𝑛𝑒𝑤 > 𝐵𝑒𝑠𝑡) then 20. 𝑋 = (𝑘, ℎ𝑡𝑜 ) ∪ (𝑘∗ , ℎ𝑜 ) 21. 𝐵𝑒𝑠𝑡 = 𝑂𝑛𝑒𝑤
suggested moves. U defined at Steps 2 or 8 is a vector of utilization of candidate VMs for exchange. For each VM included in U, we search the most suitable VM to exchange from all non-overloaded hosts 𝐻. Hosts in the same rack as ℎ𝑜 , checked at Step 10, have a higher priority than the others. At an non-overloaded host ℎ𝑡𝑜 , Step 15 gives the utilization vector of its hosted VMs. The closest function is used to find VM 𝑘 ∗ at ℎ𝑡𝑜 to exchange with VM 𝑘 at ℎ𝑜 . 𝑘 ∗ is the best VM at ℎ𝑡𝑜 to fit ℎ𝑜 if 𝑘 is moved out, because it has the closest utilization value but smaller than 𝑂 + 𝑢𝑡𝑘−ℎ𝑜 , which is the free capacity of ℎ𝑜 after moving out VM 𝑘. Steps 17 and 18 update free capacity of ℎ𝑜 and ℎ𝑡𝑜 when 𝑘 and 𝑘 ∗ are exchanged. If ℎ𝑡𝑜 can host 𝑘 (𝐹 𝑟𝑒𝑒𝑛𝑒𝑤 > 0) and ℎ𝑜 reaches the largest free 𝑡𝑜 capacity so far (𝑂𝑛𝑒𝑤 > 𝐵𝑒𝑠𝑡), exchanged set 𝑋 is set to two pairs of migration (𝑘, ℎ𝑡𝑜 ) and (𝑘 ∗ , ℎ𝑜 ) at Step 20. Finally, when exchange set is determined, LVF updates the VM assignment 𝜃 at Step 25 of Algorithm 2 by checking each migration pair in 𝑀 . In the worst case, when all VMs have to be migrated, the complexity of LVF is 𝑂(𝑁𝑣𝑚 ). C. Scattered Migration Algorithm The Scattered migration algorithm differs from the LVF algorithm on how to decide VMs and hosts to migrate. Intuitively, VMs with strong utilization correlation should be scattered onto different machines for reducing the risk of
2012 IEEE Network Operations and Management Symposium (NOMS)
future overload. The measure of correlation between VMs is based on their utilization during a predefined time period (e.g., one day). At Step 1 of Algorithm 5, we collect U𝑘 , an utilization vector for each VM 𝑘 on an overloaded host ℎ𝑜 since 𝑡 − 𝑤 until now. {U𝑘 } will be further used to compute correlation coefficients and variances of VMs. Variable 𝑂, 𝐹 𝑟𝑒𝑒 and 𝑀 are the same as those in LVF algorithm. Steps 6 to 8 find candidate set 𝐾 for moving out from host ℎ𝑜 . 𝐾 is the intersection of 𝑅 and 𝑉 , where 𝑅 contains VMs having strong correlation with each other at ℎ𝑜 , and 𝑉 is a set of VMs whose utilization has large variance during time 𝑤. VMs in 𝐾 are significantly correlated and have unstable utilization They are the source of overload and, therefore, should be scattered across hosts whose VMs they are less correlated with. Steps 11 to 19 seek the destination of each VM in 𝐾 to move. Hosts on the same rack as ℎ𝑜 are preferred, considering that correlated VMs may have high traffic rate and should locate closely. Firstly on each non-overloaded host ℎ, we compute the number of VMs that are significantly correlated to the candidate 𝑘 in 𝐾 at Step 15. The best destination to move 𝑘 is ℎ∗ who has a small value on both the number of correlated VMs (𝑁 (ℎ)) and the number of hosting VMs (∣{𝑘∣𝜃(𝑘) = ℎ}∣), and large free capacity (𝐹 𝑟𝑒𝑒(ℎ)). 𝑀 , 𝐹 𝑟𝑒𝑒 and 𝑂 are then updated accordingly. The rest of Scattered algorithm is the same as that of LVF algorithm. Exchanges are investigated and finally assignment is updated. In the worst case, when all VMs have to be 2 ) caused by migrated, the complexity of Scattered is 𝑂(𝑁𝑣𝑚 the searching of strongly correlated VMs. V. E VALUATION The dataset we used is from an enterprise data center that hosts thousands of VMs. Due to significant overheads and security concerns, we collected processor utilization of 48 VMs during 9 days from July 6th to 14th, 2011. Each VM, as we observed, was configured with 17 logical processors1 (which excludes any over-commitments). The average processor utilization of each VM was recorded at a 15-mins granularity. We treat the utilization of each VM as a chronologically ordered time series. As described earlier, although only processor utilization is considered for migration in this paper, our approach can be easily generalized to consider memory and disk utilization. To test the risk of overload with or without VM migration, we place 48 VMs on 𝑁𝑃 𝑀 = 3, 4, 6 physical machines on 2 racks. As we assume that the network architecture is a VL2 model shown in Figure 1, having any additional racks will not impact the results. What is important is correctly simulating all assumed costs, namely the cost when 2 VMs are on the same machine, on the same rack but 1 Logical processors are the hyper-threading processor cores of all the processors within a server. The processor mentioned hereinafter refers to logical processor.
Algorithm 5: Scattered migration algorithm Function Scattered − migration(𝑂𝑣𝑒𝑟𝐿𝑖𝑠𝑡, 𝜃, 𝑢𝑡𝑖−ℎ , 𝑃 ) for each ℎ𝑜 ∈ 𝑂𝑣𝑒𝑟𝐿𝑖𝑠𝑡 do 1. U = [U𝑘 ], 𝑘 ∈ {𝑘∣𝜃(𝑘) = ℎ𝑜 }, 𝑡−𝑤+2 𝑡 𝑇 where U𝑘 = [𝑢𝑡−𝑤+1 𝑘−ℎ𝑜 , 𝑢𝑘−ℎ𝑜 , ..., 𝑢𝑘−ℎ𝑜 ] and 𝑤 is the length of a sliding window ∑ 2. 𝑂 = 𝑃 − 𝑘 U𝑡𝑘 3. for ℎ = 1 to 𝑁𝑝𝑚 do∑ 4. 𝐹 𝑟𝑒𝑒(ℎ) = 𝑃 − 𝑎𝑙𝑙 𝑘,𝜃(𝑘)=ℎ 𝑢𝑡𝑘−ℎ 5. 𝑀 = {} 6. Find 𝑅, a set of VMs on ℎ𝑜 having strong correlations with each other, by checking correlations of {U𝑘 } 7. Find 𝑉 , a set of VMs on ℎ𝑜 having larger variance than the other 2/3 VMs, by checking variances of {U𝑘 } 8. 𝐾 = 𝑅 ∩ 𝑉 9. if 𝐾 = ∅ then 10. 𝐾 = {𝑘∣𝜃(𝑘) = ℎ𝑜 } 11. for each 𝑘 ∈ 𝐾 do 12. 𝐻 = {ℎ∣𝛿(ℎ) = 𝛿(ℎ𝑜 ), 0 < 𝐹 𝑟𝑒𝑒(ℎ)} 13. if 𝐻 = ∅ then 14. 𝐻 = {ℎ∣0 < 𝐹 𝑟𝑒𝑒(ℎ)} 15. 𝑁 (ℎ) = number of VMs (at host ℎ ∈ 𝐻) significantly correlated to VM 𝑘 𝑁 (ℎ) × ∣𝐻∣ 16. ℎ∗ = argmin 𝐹 𝑟𝑒𝑒(ℎ) ℎ 17. 𝑀 = 𝑀 ∪ (𝑘, ℎ∗ ) 18. 𝐹 𝑟𝑒𝑒(ℎ∗ ) = 𝐹 𝑟𝑒𝑒(ℎ∗ ) − 𝑢𝑡𝑘−ℎ𝑜 19. 𝑂 = 𝑂 + 𝑢𝑡𝑘−ℎ𝑜 20. if ∣𝑀 ∣ > 2 then 21. 𝑋 = exchange(ℎ𝑜 , 𝜃, 𝑢𝑡𝑖−ℎ ) 22. if 𝑋 ∕= ∅ then 23. 𝑀 = 𝑋 24. else if 𝑂 < 0 then 25. 𝑋 = exchange(ℎ𝑜 , 𝜃, 𝑢𝑡𝑖−ℎ , 𝑂, 𝐹 𝑟𝑒𝑒, 𝑀 ) 26. 𝑀 = 𝑀 ∪ 𝑋 27. for each (𝑘∗ , ℎ∗ ) ∈ 𝑀 do 28. 𝜃(𝑘∗ ) = ℎ∗
different machines, or across different racks. To achieve a fair consideration of traffic costs, we place equal number of machines on every rack. For example, when 𝑁𝑃 𝑀 = 6 every rack is placed 3 machines, and when 𝑁𝑃 𝑀 = 3, all machines are on one rack. To simulate the over-commitment, we vary the number of resources on each physical machine. For simplicity, we assume every physical machine has the same number of processors. Given that VM requirements are fixed, different over-commitment ratios are achieved by varying the number of processors at each physical machine from 18 to 90. The lower number of resources a machines has, the higher overcommitment ratio and risk of overload the system will have. Since the initial assignment of VMs to physical machines
2012 IEEE Network Operations and Management Symposium (NOMS)
201
No migration LVF migration Scattered migration
400
Number of overloads
350 300 250 200 150 100 50
180
LVF migration Scattered migration
160
Number of migrations
450
140 120 100 80 60 40 20
0
0
20
30
40
50
60
70
Physical machine capacity (processors)
20
30
40
50
60
70
Physical machine capacity (processors)
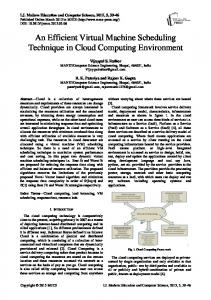
Figure 3. The number of occurred overloads on 𝑁𝑃 𝑀 = 6 physical machines hosting 48 VMs during 9 days.
Figure 4. The number of migration happened on 𝑁𝑃 𝑀 = 6 physical machines hosting 48 VMs during 9 days.
is unknown and can affect future migrations, we tested the algorithms on 200 random initial assignments and report the average performance along with standard deviation. We compare the performance of Scattered against two alternatives: LVF migration and no migration. We use four criteria to evaluate the efficacy of all approaches: (1) the number of overloads, (2) the number of migrations (moves + exchanges), (3) the amount of overloads, and (4) the impact on communication cost. We note that for space considerations, all figures show the evaluation results when migration is operated on 𝑁𝑃 𝑀 = 6 physical machines across 2 racks. When 𝑁𝑃 𝑀 = 4 at 2 racks and 𝑁𝑃 𝑀 = 3 at 1 rack, the number and the amount of overload, the number of migrations and the impact on traffic cost are similar the broader case of 𝑁𝑃 𝑀 = 6.
tions as one of the key evaluation parameters specifically due to the impracticality of modeling the wide-spectrum of migration overheads, which depends on the types of migration (e.g., pre-copy vs. post copy, type of storage, and size of VMs). In general, using the number of migrations as a normalizing metric allows us to focus on how to maximally pack the underlying infrastructure while reducing the need for migrations. Minimizing such metric will directly minimize the amount of added traffic (due to migration), and will minimize any service disruption irrespective of the underlying Service Level of Agreement (SLA). Figure 4 shows that migration depends on physical machine capacity. When machines have sufficient resources for all VMs (e.g., more than 40 processors), overload is so rare that the number of migrations is close to 0. When capacity is not large (around 35 to 40 processors), a small number of migrations (less than 10) can allow VMs be hosted under high over-commit ratios. A large number of migrations are triggered when each physical machine has less than 25 processors. Under such conditions, Scattered substantially outperforms LVF by requiring fewer migrations.
Number of Overloads. Figure 3 shows the number of overloads on 6 physical machines at 2 racks hosting 48 VMs during 9 days. Each rack includes three machines. Given the same physical machine capacity, we counted the occurrences of overload when using no migration, LVF, and Scattered. Both, the mean of 200 independent runs and error bars (whose height is 2*standard-deviation) are plotted. As we expected, the number of overloads decreases when each physical machine has larger capacity. In the scenario of no migration, overload can occur even when physical machines have more than 60 processors as the standard deviation (height of error bar in Figure 3) is larger than 0. Migration (using either LVF or Scattered) significantly reduces the number of overload (around 70% reduction) but also the risk of overload (very small variance). When each physical machine has more than 40 processors, the number of overload occurrences trends towards 0. In other words, migration allows that 6 physical machines host 48 VMs with highest over-commit ratio 3.4. Number of Migrations. Figure 4 shows the number of VM migration (moves + exchanges) when using LVF and Scattered for migration. We used the number of VM migra-
202
Amount of Overload. Besides the number of overloads, we are also interested in the amount of overload that shows how many extra processors should be added to each physical machine to satisfy all VM resource requirements. Figure 5 compares the amount of overload when given different capacity. We see that no migration causes larger amount of overload than using migration, and LVF requires more processors than Scattered. Impact on Communication Cost. As discussed in Section III, we use the sum of traffic rate perceived by each switch as object value for evaluating the traffic cost. In the no migration case, the object value 𝑆 is defined by Equation 1 once VMs are randomly assigned to physical machines. When migration is considered, the traffic rate 𝑇 among VMs is stable, but their communication cost 𝐶 will be changed if some VMs are moved from one machine
2012 IEEE Network Operations and Management Symposium (NOMS)
VI. C ONCLUSION Amount of overloads
25
No migration LVF migration Scattered migration
20 15 10 5 0 −5
20
30
40
50
60
70
Physical machine capacity (processors)
Increase of traffic rate per switch (MB/min)
Figure 5. The amount of overload on 𝑁𝑃 𝑀 = 6 physical machines hosting 48 VMs during 9 days. 0 −100 −200 −300 −400 −500
Global traffic − LVF migration Global traffic − Scattered migration Uneven traffic − LVF migration Uneven traffic − Scattered migration
−600 −700 −800 20
30
40
50
60
70
Physical machine capacity (processors)
Figure 6. The increase of traffic rate caused by LVF and Scattered migration when comparing with random placement.
to another. Therefore, the object value 𝑆 changes with the migration process. We expect that the value will not increase dramatically because of migration. In order to evaluate the impact of migration on VM traffic, we use random VMs placement as the baseline. When at time 𝑡 physical machine 𝑃 𝑀𝑖 is hosting 𝑛𝑖 VMs, the object value 𝑆𝑡 of traffic cost can be computed by Equation 1. For a fair comparison, 𝑛𝑖 out of total 𝑁𝑣𝑚 VMs are randomly placed on machine 𝑃 𝑀𝑖 and object value 𝑆 ′ is computed. The difference between 𝑆𝑡 and 𝑆 ′ shows the increase of traffic cost at time 𝑡 due to migration. The average difference for all 𝑡 is used to evaluate the influence of migration on traffic cost. Figure 6 shows the averaged increase on object value 𝑆 given different physical machine capacities. Both LVF and Scattered migration have 0 increase on 𝑆 under the global traffic model, which means that migration will not affect VMs communication. When traffic model has uneven traffic rates, LVF and Scattered migration reduces traffic cost. In other words, migration process can help minimize traffic cost. What is most important is the Scattered achieves significantly larger improvements than LVF and allows for higher over-commit ratios.
This paper studied both the benefits and risks in overcommitting VM resources in cloud environments. Clearly, over-commitment provides economical incentives to cloud providers. This, however, is at the risk of reduced quality of service (namely, providers may induce overload on hosted VMs). We designed an algorithm, Scattered, that balances VM resource utilization and reduces the overall risk of overload across the entire cloud data center. Evaluation results demonstrate the efficacy of our approach across a wide array of configuration scenarios. In particular, we believe that our migration approach is particularly attractive because it minimizes the number of needed migrations, thus minimally impacting running applications. Additionally, our approach also balances long-term communication cost between running VMs. Our current work only monitors processor utilization of VMs. We are considering memory and disk utilization in our future VM migration algorithms. R EFERENCES [1] T. Wood, P. Shenoy, A. Venkataramani, and M. Yousif, “Blackbox and Gray-box Strategies for Virtual Machine Migration,” in Proceedings of the 4th USENIX Conference on Networked Systems Design & Implementation (NSDI), 2007, pp. 229–242. [2] V. Shrivastava, P. Zerfos, K.-W. Lee, H. Jamjoom, Y.-H. Liu, and S. Banerjee, “Application-aware Virtual Machine Migration in Data Centers,” in Proceedings of INFOCOM Mini Conf., 2011, pp. 66–70. [3] D. Williams, H. Jamjoom, Y.-H. Liu, and H. Weatherspoon, “Overdriver: Handling Memory Overload in an Oversubscribed Cloud,” in Proceedings of the 2011 ACM SIGPLAN/SIGOPS International Conference on Virtual Execution Environments, 2011. [4] P. Padala, K. G. Shin, X. Zhu, M. Uysal, Z. Wang, S. Singhal, A. Merchant, and K. Salem, “Adaptive Control of Virtualized Resources in Utility Computing Environments,” in EuroSys, 2007, pp. 289–302. [5] C. Clark, K. Fraser, S. Hand, J. G. Hansen, E. Jul, C. Limpach, I. Pratt, and A. Warfield, “Live Migration of Virtual Machines,” in Proceedings of 2nd Symposium on Networked Systems Design and Implementation (NSDI), 2005. [6] M. Nelson, B.-H. Lim, and G. Hutchins, “Fast Transparent Migration for Virtual Machines,” in ATEC’05: Proceedings of the USENIX Annual Technical Conference, 2005. [7] F. Hermenier, X. Lorca, J.-M. Menaud, G. Muller, and J. Lawall, “Entropy: a Consolidation Manager for Clusters,” in Proceedings of the 2009 ACM SIGPLAN/SIGOPS International Conference on Virtual Execution Environments, 2009, pp. 41–50. [8] M. Zhao and R. J. Figueiredo, “Experimental Study of Virtual Machine Migration in Support of Reservation of Cluster Resources,” in Proceedings of the 2nd International Workshop on Virtualization Technology in Distributed Computing (VTDC), 2007, pp. 1–8. [9] A. Singh, M. Korupolu, and D. Mohapatra, “Server-Storage Virtualization: Integration and Load Balancing in Data Centers,” in Proceedings of ACM/IEEE Conference on Supercomputing (SC), 2008, pp. 1–12. [10] T. Wood, G. Tarasuk-Levin, P. Shenoy, P. Desnoyers, E. Cecchet, and M. D. Corner, “Memory Buddies: Exploiting Page Sharing for Smart Colocation in Virtualized Data Centers,” SIGOPS Operating Systems Review, vol. 43, pp. 27–36, July 2009. [11] A. Greenberg, J. R. Hamilton, N. Jain, S. Kandula, C. Kim, P. Lahiri, D. A. Maltz, P. Patel, and S. Sengupta, “VL2: a Scalable and Flexible Data Center Network,” in Proceedings of ACM SIGCOMM, 2009, pp. 51–62. [12] X. Meng, V. Pappas, and L. Zhang, “Improving the Scalability of Data Center Networks with Traffic-aware Virtual Machine Placement,” in Proceedings of IEEE INFOCOM, 2010, pp. 1154–1162.
2012 IEEE Network Operations and Management Symposium (NOMS)
203