Virtual materials design using databases of calculated materials properties T R Munter1 , D D Landis1 , F Abild-Pedersen1,2 , G Jones1 , S Wang1 and T Bligaard1 1 Center
for Atomic-scale Materials Design (CAMD), Department of Physics, Technical University of Denmark, Building 307, DK-2800 Kgs. Lyngby, Denmark 2 Computational Materials Design ApS, Fysikvej Building 307, DK-2800 Kgs. Lyngby, Denmark E-mail:
[email protected] Received 27 December 2007, in final form 28 October 2009 Published 26 November 2009 Computational Science & Discovery 2 (2009) 015006 (27pp) doi:10.1088/1749-4699/2/1/015006
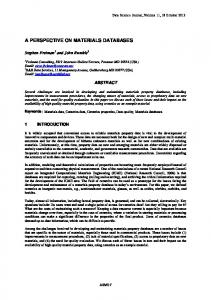
Materials design is most commonly carried out by experimental trial and error techniques. Current trends indicate that the increased complexity of newly developed materials, the exponential growth of the available computational power, and the constantly improving algorithms for solving the electronic structure problem, will continue to increase the relative importance of computational methods in the design of new materials. One possibility for utilizing electronic structure theory in the design of new materials is to create large databases of materials properties, and subsequently screen these for new potential candidates satisfying given design criteria. We utilize a database of more than 81 000 electronic structure calculations. This alloy database is combined with other published materials properties to form the foundation of a virtual materials design framework (VMDF). The VMDF offers a flexible collection of materials databases, filters, analysis tools and visualization methods, which are particularly useful in the design of new functional materials and surface structures. The applicability of the VMDF is illustrated by two examples. One is the determination of the Pareto-optimal set of binary alloy methanation catalysts with respect to catalytic activity and alloy stability; the other is the search for new alloy mercury absorbers. Abstract.
Computational Science & Discovery 2 (2009) 015006
© 2009 IOP Publishing Ltd
www.iop.org/journals/csd 1749-4699/09/015006+27$30.00
Computational Science & Discovery 2 (2009) 015006
T R Munter et al
Contents 1. Introduction
2
2. Overview
3
3. A portfolio of databases
5
4. Program structure
8
5. Example 1. Screening for mercury absorbing materials
5.1. 5.2. 5.3. 5.4. 5.5. 5.6.
Screening for potential candidates Reaction conditions . . . . . . . . Critical formation energy . . . . . Stability against oxidation . . . . Candidates . . . . . . . . . . . . . Discussion . . . . . . . . . . . . .
. . . . . .
. . . . . .
. . . . . .
. . . . . .
. . . . . .
. . . . . .
. . . . . .
. . . . . .
. . . . . .
15
. . . . . .
. . . . . .
. . . . . .
. . . . . .
. . . . . .
. . . . . .
. . . . . .
. . . . . .
. . . . . .
. . . . . .
. . . . . .
. . . . . .
. . . . . .
. . . . . .
. . . . . .
. . . . . .
. . . . . .
. . . . . .
. . . . . .
. . . . . .
. . . . . .
. . . . . .
. . . . . .
15 16 16 17 19 19
6. Example 2. The methanation reaction
20
7. Summary. conclusion
23
Acknowledgments
24
References
25
1. Introduction
During the last century, materials science was subject to an enormous transformation. Based on the development of the quantum theory of physics, the human control over matter saw a number of successes leading up to the materials technology of today, where the human genome has been mapped [1] and measurements with, e.g., scanning probe microscopes and transmission electron microscopes are used to create images of surfaces with sub-nanometer resolution [2, 3]. The subsequent influence on the development of new materials is dramatic. One area where the development of simple models from quantum mechanical principles has had a profound effect is organic synthesis, where chemists today almost routinely create molecules with the exact atomic configurations they seek. However, there are still many problems facing the materials scientists who are attempting to design new materials with predefined design objectives. One fundamental problem is the large number of different possible atomic arrangements that can be envisioned for even a very limited number of atoms. This leads to an intractable number of design possibilities for materials, each with significantly varying properties, and among these perhaps only a few have the desired properties or are practically realizable. Despite the cost of discovering new materials with specific properties continuously decreasing due to the introduction of highthroughput parallel synthesis and screening techniques, the cost for developing new materials is still high. The modern implementations of electronic structure theory provide hope that better solutions to this problem are getting closer. Methodological improvements continuously appear, which increase the accuracy as well as the speed of the computation of materials properties. The cost for computational power is in parallel to the methodological improvements decreasing exponentially, and has been so since perhaps the early 1960s following Moore’s law (stating that a doubling in the number of transistors that can be integrated on a single circuit can be expected every two years) [4]. This has led to the situation that we today, in some fortunate cases, can perform computer simulations to obtain the relevant materials properties faster, more reliably, and at lower cost than the traditional synthesis and testing procedure. As an example of this, we shall in this paper use a database of more than 81 000 density functional theory (DFT) calculations for various materials and properties to screen for stable methanation catalysts and mercury absorbers. An accurate experimental determination of the materials properties for such a large number of compounds might be difficult to obtain in a lifetime of work effort. The computational work load, however, is large but not excessive. Extrapolating the advances of the recent past suggests that electronic structure theory might in the relatively near future become a highly competitive tool in the materials design process for a much wider range of materials. 2
Computational Science & Discovery 2 (2009) 015006
T R Munter et al
When intending to calculate materials properties or mechanisms for chemical reactions at the atomic scale, resolving the electronic structure is necessary. Presently, DFT [5–7] is the method of choice for calculating electronic structure to a reasonably high degree of accuracy with reasonably limited computational effort, when the system size is from a few atoms up to a few hundred atoms. DFT is versatile in the sense that by solving the electronic structure problem using DFT, one can determine a wide range of atomic-scale properties for a given atomic-scale structure. One can even predict the properties for materials which have not yet been synthesized [8, 9], or for which the relevant synthesis and testing might be too expensive or even dangerous. The otherwise clear goal of predicting new materials with improved properties based on computational tools immediately raises a series of important questions, which do not have any obvious answers: how does one obtain the materials properties, which are observed at larger length and time scales from the calculations at the atomic scale? Is it already possible today to establish large databases of materials properties calculated by these theoretical tools? How do we efficiently use such databases for materials optimization when multiple criteria need to be optimized simultaneously? These questions are perhaps too difficult to answer in general within just one short paper. However, an attempt will be made here to create the foundation on which the detailed answers for these questions in specific cases can subsequently be developed. The focus throughout the paper will be on catalysis and ordered intermetallic alloys and on the absorption of heavy metals in alloys. We discuss a practical implementation of the data analysis with the purpose of facilitating various aspects of the prediction of materials properties and chemical reactions using calculated materials properties. Within the pharmaceutical industry virtual screening methods have for a long time been used for drug discovery. There, large libraries of chemical compounds or biological molecules are evaluated automatically for desired functionality using computers. For drug discovery virtual screening is used for estimating among others: the absorption of drugs in the body, metabolism, toxicity and evaluation of drug activity of chemical compounds [10–12]. Virtual screening is a relatively new concept in the heterogeneous catalysis field [13]. Whereas medical companies have big databases of well-characterized compounds and their properties, it has proven more difficult to determine the active surface sites at the atomic scale under conditions that are relevant to catalytic processes. This has in turn slowed down the progress of high-throughput theoretical design of new catalysts. Computational methods have been useful for understanding trends in the properties of catalysts across the Periodic Table, and have been used widely within the field of theoretical catalysis. The atomic-level understanding of ammonia synthesis [14–16], methanation [17], ethylene epoxidation [18], the oxygen reduction reaction [19], CO oxidation [20, 21], the hydrogen evolution reaction [22] and methanol decomposition [23] among others was facilitated by the use of computational methods. Progress has recently been made with respect to actual theoretical design [24–36]. Direct atomic-scale computational design is difficult due to the lack of databases with chemical properties relevant for catalyst development. In this paper, we present the implementation of a program tailored to carrying out virtual screening for the design of catalysts for heterogeneous and electrochemical processes. The implemented approach to virtual screening is an example of what has previously been called data pipelining and been used for drug discovery [37], and is simultaneously inspired by the ‘Cambridge Engineering Selector’ and related works by Professor M F Ashby [38]. Catalysis of commodity chemicals is economically important for society. It has been estimated that 20% of the World’s GNP is directly related to catalytic processes [39]. In this paper, we therefore use catalysis as an example, although the virtual materials design framework (VMDF) we present is more generally applicable for computational materials design. 2. Overview
The virtual screening program VMDF that we present is implemented in Java, and can therefore run on most hardware platforms. The program provides easy access to an extensive embedded database of computationally obtained physical and chemical properties for bulk materials and interaction of molecules with surfaces relevant in catalysis and electrochemistry. The filters and analysis tools, which are provided have been 3
Computational Science & Discovery 2 (2009) 015006
T R Munter et al
Alloy formation Energies (LMTO) Quatenary (43081)
Alloy formation Energies (EMTO)
Trinary (17563)
Binary (8278) Pure (333) Binary (3473)
Segregation Adsorption
energies (1203)
energies (7641) Figure 1. Schematic overview over the sizes of the databases produced at the Center for Atomic-scale
Materials Design (CAMD) at the Technical University of Denmark over the past 20 years. The data sets represent theoretical data such as formation energies and segregation energies for bulk alloy systems, adsorption energies and theoretical relations for many catalytically relevant quantities.
developed to simplify the process of searching and correlating data from multiple databases, in order to find the best leads for new catalysts. Currently, the database contains electronic structure calculations for more than 81 500 atomic-scale structures. Figure 1 shows in schematic form the size of each part of the database. As computers become increasingly powerful, the process of generating data of chemical properties for adsorbates and surfaces becomes faster. In the near future, we will thus see increasingly large data sets published for increasingly more complex materials properties. A graphical user-interface (GUI) is used to create a flowchart for the virtual screening. Data sets flow from data sources, through filters to visualization tools, which can present the resulting data sets as, for example, graphs or show them in spreadsheets. Figure 2 shows a typical screenshot from a virtual screening. To the left is a list of the available filters and a button to show the visualization tools. The model-view window contains a flow-chart model containing one data source, two filters and four visualization tools. The data set containing adsorption energies of hydrogen on binary surface alloys [33], is shown in tables both before and after it was filtered through the PropertyInRangeFilter. This filter can be used to selectively allow data elements to pass for which a chosen property has a numerical value in the predefined range. The two corresponding tables can be seen in the upper-right and middle-right windows. The data set is also piped through the NumberOfElementsFilter which is set to only let adsorption energies pass for surfaces of pure elements. The data are then plotted in a color-coded Periodic Table, see the lower-middle window. The data set is also piped to a visualization tool that plots the data in a graph. Here the binding energy of H sitting in a face-centered cubic (fcc)-like three-fold adsorption site on the (111) surface of the alloys having a fcc-like crystal structure, is shown as a function of the binding energy of H sitting in a hexagonal close-packed (hcp)-like three-fold adsorption site on the same surface. As one would expect there is a clear linear correlation between the adsorption energy of H in the two adsorption sites. In section 3 of this paper, the data sets included in our database are presented. In section 4, the underlying architecture of the virtual screening program is described. Section 5 gives an example of how virtual screening can be used to search for metals that can potentially absorb mercury from a gas stream, and bind the mercury in an alloy. Finally, in section 6 we present an example of how physical knowledge about a reaction can be used together with virtual screening to find new leads in the search for a catalyst suitable for the classical methanation reaction.
4
Computational Science & Discovery 2 (2009) 015006
T R Munter et al
Figure 2. Screenshot of VMDF showing a more advanced model containing one data source, two filters
and four visualization tools. Four output windows are shown. The scatter graph (bottom right) shows the adsorption energy of H on two different threefold adsorption sites on binary alloys as a function of each other. 3. A portfolio of databases
Since the introduction of computers in theoretical physics and chemistry, vast amounts of data have been generated. These are often calculated using varying accuracy and are stored in a format suitable for the specific project they were generated for. This makes it a nontrivial task to directly combine results from multiple sources and use them in subsequent projects. In this paper, we describe one way that data from different sources can be put in a homogeneous form so that different studies can be more easily combined and used to conduct a screening study. One difficulty is often that data from different studies must be put in a consistent form having, for example, the same reference values. Evidently, it would be a more satisfactory solution if one could build the database up on total energies, since the addition of extra materials properties might be simpler. One would in this case, however, need to take much greater care that the reference energies produced and included in the past were of the same computational quality and level as the subsequently included total energies. In the studies presented here, we do not propose a general solution for the problem of mutual reference values. Rather we use a number of data sets that have already been published separately. This means, for example, that whereas the calculations of adsorption energies and alloy formation energies were done with different electronic structure codes, the full calculation of each property is done using energy differences within only one code at one consistent level of accuracy. Over the past 20 years, the research group which we are part of, at the Technical University of Denmark, has carried out numerous theoretical studies, thereby generating vast amounts of data. Especially, in the last few years the amount of theoretically calculated accurate materials properties has increased tremendously. Among the systems studied are ammonia synthesis [14, 15], the methanation reaction [31], adsorption energies for molecules on transition metal surfaces [17, 40, 41], activation energies for many molecules on transition metal 5
Computational Science & Discovery 2 (2009) 015006
T R Munter et al
Figure 3. The CAMD database contains many theoretically calculated adsorption energies of
adsorbates on the close-packed (111) surface of pure elements. Here is shown a small subset. (a) Adsorption energies for carbon. (b) Adsorption energies for nitrogen. (c) Adsorption energies for oxygen.
surfaces [42] and compounds [43], and the formation energy of quaternary alloys having body-centered cubic (bcc)- or fcc-like crystal structures [26, 44]. Bringing these data into a homogeneous form that can be used in conjunction provides a versatile database. A fundamental chemical property in catalysis is the energy change when a molecule adsorbs on a surface, the adsorption energy. Figure 3 presents theoretical adsorption energies for carbon-, nitrogen- and oxygen atoms adsorbed on close-packed metal surfaces obtained using DFT. Calculated adsorption energies as presented here can be used for predicting chemical properties for many different alloys. This is sometimes 6
Computational Science & Discovery 2 (2009) 015006
T R Munter et al
Figure 4. The adsorption energy of hydrogen on a supported overlayer. Horizontally, the element of
the substrate is shown. Vertically, the nature of the overlayer is shown. The data are adapted from [33].
facilitated by means of simple interpolation or more advanced schemes that generate approximate materials data, which can subsequently be screened for specific properties. This approach was used successfully when proposing new catalysts for, e.g., the methanation reaction [31]. Chemical properties like adsorption energies can also be tuned by forming a monolayer of one element or a multi-component alloy on a substrate of another metal [45–47]. The change in adsorption energy can primarily be attributed to two effects that govern the position of the material’s d-band. The first could be considered an intrinsic property of the chemical elements present and is a result of the different number of valence electrons. The second is a geometric influence brought about by a mismatch in lattice constants of the overlayer and the substrate, which for transition metals changes the width and the position of the d-band [48]. How the adsorption energy of atomic H changes when adsorbed on a surface with a one atomic-layer thick overlayer of one element on a substrate of another element can be seen in figure 4. The diagonal elements in figure 4 provide the adsorption energies of H on the surface of the pure elements. In earlier works, properties such as adsorption energies, barriers to dissociate and other relevant properties were only calculated for adsorbates on the surfaces of metals relevant to the chemical reaction in question. So when data sets are collected the data for adsorbates will be incomplete with respect to the elements of the surfaces. Figure 5 shows a histogram of the number of different adsorbates for which there exists adsorption energies on a given transition metal surface. Here selected adsorption data on close-packed surfaces which for metals having the fcc crystal structure (the (111)-surface) are shown. In the present study of methanation catalysts, we used a database of DFT calculations in the full charge density EMTO implementation [49–52] of formation energies for 8611 binary alloys [53]. These binary alloys are those binary combinations of Li, Na, Be, Mg, Ca, Sr, Al, Zn, Ge, Si and the 3d, 4d and 5d transition metals (except La) which sit in the structures shown in figure 6. It was not possible to converge every single combination, since the implementation is not fully automated, but by far the most combinations have been calculated. It will indeed most often be the case, that when working with theoretically calculated materials properties, the databases are not necessarily complete, and subsequent screening studies will be carried out utilizing incomplete data sets. An example of the contents (data for one crystal structure) of this database is shown in figure 7. Here the binary alloys in the L12 structure are shown with a color-code illustrating their 7
Computational Science & Discovery 2 (2009) 015006
T R Munter et al
Sc
Ti
V
Cr
Mn
Fe
Co
Ni
Cu
Zn
Y
Zr
Nb
Mo
Tc
Ru
Rh
Pd
Ag
Cd
La
Hf
Ta
W
Re
Os
Ir
Pt
Au
Hg
Figure 5. The number of distinct adsorbates for which adsorption energies in the CAMD database exist
shown for all the 3d, 4d and 5d transition metals.
formation energies. Those combinations, which have not yet been possible to converge are shown in white. The database was obtained from Professor H L Skriver through its web interface [53]. The database also includes formation energies for over 64 000 alloys containing up to four different elements in simple fcc- or bcc-like crystal structures [44]. These values are calculated using the faster, but somewhat less accurate linear muffin tin orbitals-method (LMTO) [54] except for alloys involving Zn, Cd, Hg, Lu and Si, where the Korringa–Kohn–Rostocker (KKR) method [55] was used to give an accurate description of the low-lying valence or semi-core states. These data can be used to test alloys for stability and phase segregation effects leading to a more accurate estimate of whether or not a given alloy phase can be formed. Figure 8 shows which elements were chosen as components in the combinatorial screening of formation energy for quaternary alloys. 4. Program structure
The VMDF presented here is designed to enable materials researchers or engineers to perform virtual screening of functional materials having a particular combination of physical or chemical properties which should 8
Computational Science & Discovery 2 (2009) 015006
T R Munter et al
(a) B1 (NaCl)
(d) B20 (FeSi)
(b) B2 (CsCl)
(e) B27 (FeB)
(g) D03 (AlFe3 )
(i) L10 (AuCu)
(c) B11 (γ-CuTi)
(f) C15 (Cu2 Mg)
(h) D022 (Al3 Ti)
(j) L11 (CuPt)
(k) L12 (Cu3 Au)
Figure 6. The 11 different crystal structures that the binary alloys have in the presented database of
alloy formation energies. The structure names are given in the Strukturbericht nomenclature [69].
be optimized. Furthermore, it enables a user to perform detailed analysis of larger data sets that cannot be analyzed manually or, only with difficulty, analyzed using computer programs that are not specially designed for the problem in question. More extensive analysis of chemical properties and materials design might require programming of additional analysis modules, but these are easy to implement in the presented framework. In this section, the framework that speeds up the development process is presented. 9
Computational Science & Discovery 2 (2009) 015006
T R Munter et al
Figure 7. Formation energy for binary alloys having the composition AB3 . All alloys have the Strukturbericht crystal structure L12 . The stability is calculated using EMTO with a GGA xc-functional and is given in mRy atom−1 . The chemical elements are ordered accordingly to the Pettifor stringing of the elements [70].
The program for carrying out virtual screening for materials design consists of two parts: the materials design framework (MDF) that abstracts how data sets are stored physically on the disc and provides an application programming interface (API) in which filters, analysis tools and visualization tools can use to perform the screening process. Virtual screening models can be built in a GUI, which provides the means to modify and run the model interactively. The different layers in the program are shown in figure 9 and will be described in more detail in the following discussion. The MDF enables the user to combine data from multiple data sources, which could be, for example, databases containing theoretical values of chemical properties, databases with experimental data and modeldata derived from models based on parameterizations of chemical or thermodynamic properties. The framework operates with three different types of objects. Data sources. Objects that feed data sets into the model. Data sources come in two different flavors: data sources that provide enumerated data, e.g., existing data sets loaded from a database, and generators 10
Computational Science & Discovery 2 (2009) 015006
T R Munter et al
Figure 8. The four components of the quaternary alloys in the database containing LMTO formation
energy energies for quaternary alloys [44] are selected from the set of elements colored on this Periodic Table. Virtual Materials Design
JavaBeans-based GUI
Filters
Analysis tools
Visualization tools
Materials Design Framework (MDF) layer DataElementReader
SQLDataElementReader
Flat data file
Local RDBMS
Other data source
Remote RDBMS
Figure 9. Schematic view of the program structure. The program has a layered structure with the
storage layer on the bottom and then more and more data-abstract layers upwards to the top-layer which the user interacts with.
that have to be inquired in order to access information about certain materials because no enumeration is possible. An example of a generator is one which gives the formation energy for oxides of a chemical element at a given temperature calculated from the parameterization of the formation energy as a function of temperature. Filters. Objects that take the output of a data source (or of another filter if they are linked) and evaluate each element in the data set against predefined criteria. Only data elements that meet the criteria are allowed to pass and there is the further option to add more data fields about the material in question. 11
Computational Science & Discovery 2 (2009) 015006
HAdsorptionEnergies
123 123
ABC 55 xxyyzz
ABC 55 xxyyzz
T R Munter et al
PropertyInRangeFilter
1 2 3 4 3 1
2
XYScatterGraph
Table
Figure 10. Simple example of a virtual screening. The data set ‘HAdsorptionEnergies’ containing
theoretical values for H adsorption energies on binary alloys is loaded and passed to a visualizing tool that plots the data set in a scatter graph and to a filter named PropertyInRangeFilter that only accepts data elements which have a certain property in the selected range. The data elements that pass the filter are then presented in a table.
In general, data elements of a data set are fed to filters in a non-deterministic order so filters have no information available to them about the current position in the data set. In special cases a filter can store a local copy of the data set in order to perform certain tasks, for example, sorting a data set. Visualization tools. Objects of this type can be connected to the output of a chain of filters or directly to a data source to visualize the data set. A multitude of different ways to visualize a data set can be imagined, such as the data set presented in a table, shown as a scatter-graph or as a histogram. The illustrations in the first part of this paper are examples of ways to visualize data sets. As previously mentioned, data elements in a data set are in non-deterministic order, this is because ordering a data set according to the value of a property does not make sense except when presenting the data set in a table for the user. Due to the fact that filters can add or remove fields in individual data elements, care is taken to make sure that filters cannot change instances of the data sets seen by objects upstream in the model. This makes it easy to run the evaluation of the model in parallel since a data element, as soon as it has passed one object, can be fed into the next object in the chain. The downside is the extra cost of memory. It also makes it easy to implement one-to-many relationships: the output from one data source or filter is fed to one or many filters. Figure 10 illustrates this. The virtual screening program is implemented in Java running on Sun’s JavaSE 5 SDK [56]. The decision to use Java was made to make the program portable. Java offers a versatile program library containing packages to build advanced user-interfaces, and a multitude of packages offers functionalities such as embedded database systems; and molecule visualization is also available from other sources. The GUI takes care of the user interaction, the editing of models and the display of plots. For the editing of object properties, Java’s built-in functionality for reflection is used to discover the properties of data sources, filters and visualization tools. Reflection enables a program to discover properties about classes at run-time, thereby not requiring any hardcoded information about classes. Reflection works best when the JavaBeans design pattern [57] is applied in the class-design, therefore the classes in the MDF are designed following the JavaBean design-pattern. The only configuration the program needs is an XML file containing the names of the classes of the data sources, filters and visualization tools. Everything after this point can be discovered at run-time using reflection. 12
Computational Science & Discovery 2 (2009) 015006
T R Munter et al
Figure 11. Schematic illustration of how a subset of the data is organized in tables in the relational
database.
Most data sets are stored in the embedded SQL database server, a relational database management system (RDBMS). For the embedded RDBMS the Apache Derby database version 10.3 is used [58]. It offers a fast Java RDBMS that implements a large part of the SQL standard. The RDBMS can be embedded into an application and the data files can be packed in a JAR-archive and be distributed along the main application. Access to the database is provided through JDBC which is Java’s mechanism for accessing relational database systems. Creation of connections to the embedded RDBMS is handled by a separate class. This pattern allows one to switch to the back-end RDBMS easily, as long as data sources and other classes only use standard SQL. Unfortunately, database systems do not always implement the whole SQL standard and therefore databasespecific dependencies can still be found in the modules. As illustrated in figure 9 data sets can be stored in many different ways, e.g., in the embedded RDBMS, in a local text file or in an off-site database server. The data set is loaded using a derivative of either SQLDataElementReader or DataElementReader, depending upon whether access to a SQL database server is needed or not. After loading, access to data sets happens in a uniform way defined by the MDF, independent of the data origin. Due to the fact that information stored in different data sets is often very heterogeneous, it is necessary to store each data set in an individual table in the embedded RDBMS. An example of which columns a data set contains on-disc is shown in figure 11. Relationships between tables are used to find additional information about a particular property, e.g., relationships implemented using foreign keys are used to find information about computational setup and references to where the data originates for the row containing the actual material property. This is important because one data set can contain data coming from multiple sources, therefore it is vital that the origin of a data element can be traced back to where it was published and how it was obtained. Each data element is wrapped in an instance of the DataElement class. This class inherits from the MaterialTemplate class which offers basic functionality to store values associated with keys and to be able to retrieve the value associated with the given key. Instances of the MaterialTemplate class are also used when searching for data elements matching an incomplete description of a material, this could be all alloys having a certain crystal structure. DataElement imposes some constraints on the information stored, the data element must, for example, contain a reference to where the data comes from, a name to be presented to the user and a list of the elements that the material contains. The full class diagram can be seen in figure 12. Data sources are implemented as instances of either MaterialList or as derived classes of MaterialGenerator. Sources where the data can be enumerated are instances of MaterialList and we can therefore iterate through all elements, data sources that can only be 13
Computational Science & Discovery 2 (2009) 015006
T R Munter et al
Figure 12. UML class diagram of the MDF-package.
Figure 13. UML class diagram of the filters-subpackage of the MDF.
queried for data about a certain material or class of materials inherit from MaterialGenerator. An instance of MaterialList can either be constructed using an instance of a class inheriting from DataElementReader or be initialized to contain the output from a filter. Classes derived from DataElementReader are used to read data sets from files or over the internet, where the more specialized class SQLDataElementReader is used when loading data sets from a RDBMS. Data sources, filters and visualization tools built on the MDF must also implement either the DatasourceInputInterface and/or the DatasourceOutputInterface. By inheriting from these interfaces the modelbuilder knows which modules can be connected. The class diagram for data sources, filters and visualization tools is shown in figure 13. A filter or analysis tool which is iterating over the data set one element at a time, can inherit from the class SingleSourceFilter and get a lot of functionality by inheritance. In this way it becomes possible to implement a new filter by just overriding one method concentrating on the new functionality, thereby using the methods inherited from SingleSourceFilter to handle all the tasks common to all filters. Filters combining input from multiple data sources can inherit from the class MultipleSourcesFilter. Multiple data sources are handled though this filter by iterating over elements in the primary data source and using these elements in queries to the secondary data sources. In this way, a data element from one MaterialList can get additional information added from other iterable MaterialLists or from a MaterialGenerator. Figure 14 shows a more realistic virtual screening model, where three filters are applied to the data set coming from the data source. The resulting data set is then plotted as a checkerboard plot and in a table.
14
Computational Science & Discovery 2 (2009) 015006
StringMatchFilter
123 123
ABC 55 xxyyzz
123 123
QuaternaryAlloys
ABC 55 xxyyzz
ABC 55 xxyyzz
T R Munter et al
NumberOfElementsFilter
123 123
ABC 55 xxyyzz
1 2 3 4 3 1
2
CheckerBoard
HighConcentrationFilter
Table
Figure 14. Example of a virtual screening. The data set comes from a data source named
‘QuaternaryAlloys’ contain the data presented in [44]. After being loaded the data elements are filtered, so only those having a fcc-like crystal structure pass, then only binary alloys are allowed to pass, the last filter is one that selects binary alloys containing elements with the ratio 0.25 and 0.75, respectively. Finally, the data are plotted in a checkerboard graph and shown in a table. 5. Example 1. Screening for mercury absorbing materials
In this example, it will be shown how the proposed framework for performing virtual screening in a materials design context can be applied. The methodology is applied to the problem of searching for a material that potentially can absorb gaseous Hg from a gas stream. Hg is naturally present in coal and crude oil in minute amounts. Given the large quantities of hydrocarbons that pass through the chemical plants treating these chemicals, even traces of Hg will add up. It is estimated that the largest aggregate source of Hg pollution in the US are coal-fired power plants, which in 1999 were responsible for 40% of the total Hg emission [59]. Hg and other heavy metals are toxic to humans and animals and cause severe pollution of the environment. Furthermore, Hg will poison the active sites of a number of catalysts used in reactions, where trace amounts of Hg can be found in the feed-gas stream. These processes include, for example, the methanation process and the production of synthetic natural gas. The ability to remove Hg from the feed-gas stream of a chemical plant or from exhaust gas from combustion of coal or crude oil is therefore crucial for the environment and to the operators of chemical plants alike. A solution for the removal of gaseous Hg is proposed by which a regenerable absorber material will absorb the Hg from a gas stream when it is passed over the material, forming an alloy in the process. In the following section 5.1, some key properties that such a material should have will be described. We shall now turn our attention to describing, in more detail, how these criteria are defined. 5.1. Screening for potential candidates Candidate materials that can absorb Hg and, at the same time, are stable are required to fulfill a long list of constraints. Several of these constraints are not known exactly, and must therefore be established from experience. The constraints that we chose for the candidate alloys are listed below. (i) (ii) (iii) (iv)
Candidate has a negative formation energy. Candidate contains Hg. Candidate is stable to oxidation at the given reaction conditions. Candidate must have a more negative formation energy than the critical formation energy at the partial pressure of Hg at the entrance of the absorber. (v) Candidate must have a more negative formation energy than the critical formation energy at the partial pressure of Hg at the exit of the absorber (1/100 of the Hg pressure at the entrance). (vi) If candidates in the result set are polymorphic only the most stable phase passes. 15
Computational Science & Discovery 2 (2009) 015006
T R Munter et al
Table 1. Fractional gas composition of the gas stream coming from a gasifier at a temperature of
T = 473 K and a total pressure of p = 3 MPa. Xi H2 CO CO2 H2 O H2 S
0.27 0.62 0.02 0.04