Dedicated LPAR Definition. – Dedicated Donating Definition. – VPs vs AIX SMT
scheduling – VP Folding. – Shared LPAR Definition. • Maximum VPs for each ...
2011 IBM Power Systems Technical University October 10-14 | Fontainebleau Miami Beach | Miami, FL IBM
Return to Basics I : Understanding POWER7 Capacity Entitlement and Virtual Processors VN211 Rosa Davidson Advanced Technical Skills - Security and Performance - IBM
© Copyright IBM Corporation 2012 Materials may not be reproduced in whole or in part without the prior written permission of IBM.
5.3
Session Evaluations • ibmtechu.com/vp
Prizes will be drawn from Evals
© Copyright IBM Corporation 2012
2
IBM Power Systems
Outline – Part 1 � PowerVM Concepts: (20 slides) – Terminology : CPU, CPU within AIX. – Two Usages View : PowerVM vs OS – Types of Logical PARtitions (LPARs). – Virtual Processor Definition (VP). – Capacity Entitlement Definition (CE). – Dedicated LPAR Definition. – Dedicated Donating Definition. – VPs vs AIX SMT scheduling – VP Folding – Shared LPAR Definition. • Maximum VPs for each LPAR. • Shared: “The cake & the Invitees” story – Capacity Entitlement: Dispatch wheel. • “Limit the VPs, Core Access you receive” • The Uncapped: “The False Hope” story
3
Power is performance redefined
© 2011 IBM Corporation
IBM Power Systems
Bibliography - References �
Beyond this presentation, read the White Paper from Mala Anand : “POWER7 Virtualization - Best Practice Guide” http://www.ibm.com/developerworks/wikis/display/WikiPtype/Performance+Monitoring+Documentation
�
Server virtualization with IBM PowerVM http://www-03.ibm.com/systems/power/software/virtualization/resources.html
�
IBM Systems Workload Estimator or http://www-912.ibm.com/estimator
�
IBM System p Advanced POWER Virtualization Best Practices Redbook: http://www.redbooks.ibm.com/redpapers/pdfs/redp4194.pdf
�
Virtualization Best Practice: http://www.ibm.com/developerworks/wikis/display/virtualization/Virtualization+Best+Practice
�
Configuring Processor Resources for System p5 Shared-Processor Pool Micro-Partitions: http://www.ibmsystemsmag.com/aix/administrator/systemsmanagement/Configuring-Processor-Resources-for-System-p5-Shar/
�
An LPAR Review: http://www.ibmsystemsmag.com/aix/administrator/lpar/An-LPAR-Review/
�
Virtualization Tricks: http://www.ibmsystemsmag.com/aix/trends/whatsnew/Virtualization-Tricks/
�
A Comparison of PowerVM and x86-Based Virtualization Performance: http://www-03.ibm.com/systems/power/software/virtualization/whitepapers/powervm_x86.html
�
IBM Integrated Virtualization Manager: http://www-03.ibm.com/systems/power/hardware/whitepapers/ivm.html
�
Achieving Technical and Business Benefits through Processor Virtualization:
�
Java Performance Advisor is available
�
VIOS Performance Advisor is available
�
Virtualization Performance Advisor is in develeopment (expected Q1/2012)
4
http://www.ibm.com/common/ssi/fcgi-bin/ssialias?infotype=SA&subtype=WH&appname=STGE_PO_PO_USEN&htmlfid=POL03027USEN&attachment=POL03027USEN.PDF
https://www.ibm.com/developerworks/wikis/display/WikiPtype/Java+Performance+Advisor ftp://ftp.software.ibm.com/aix/tools/perftools/JPA/AIX61/ http://www.ibm.com/developerworks/wikis/display/WikiPtype/VIOS+Advisor http://aixptools.austin.ibm.com/virt/virt_advisor/
Power is performance redefined
© 2011 IBM Corporation
IBM Power Systems
Terminology : CPU � The Threads of the core are the: Logical Processor (LP) or Logical CPU (lcpu).
� The Core becomes a “Virtual Processor” or “Physical Processor” or “Physical CPU”. THE WINNERS ARE:
100
POWER5 POWER6
POWER7 Compatibility mode P6 POWER7 SMT2 A core with 2 LOGICAL CPUS
150
“Number ONE !” EFFECT
THE WINNERS ARE:
No Sizing on a UNIQUE NUMBER (rPerf and CPW – ONE Number)
POWER7 SMT4
NO BOX SIZING (VIO ? Which VIO?)
BOX = ONE LPAR
A core with 4 LOGICAL CPUS
5
Power is performance redefined
© 2011 IBM Corporation
IBM Power Systems
Mills crunching data or My Performance Job Where’s the core ? VP
VP Core
SMT Mode Nb Log. CPUs
SMT Mode Nb Log. CPUs CE GHz + Memory SpecInt
Throughput 10
20 No Sizing on a UNIQUE NUMBER (rPerf and CPW)
6
Power is performance redefined
© 2011 IBM Corporation
IBM Power Systems
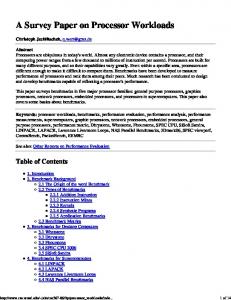
Two Usage views: PowerVM and OS � IDLE CAPACITY: – PowerVM does report cores’ usage (idle core). – Operating Systems (OS) do report the idle capacity (%idle) of Logical CPUs (SMT threads). • To report how many cores are used, OS gives the physical consumed: physc
PowerVM COREs: 3 used OR
physc: 3.0
Operating System
CPUs: x usr%; y sys%; z idle% CPU 0
Core 0
VP 0
CPU 1
sys
CPU 9
idle
idle
CPU 6
CPU 7
idle
idle
CPU 10
CPU 11
idle
idle
Vision SMT Threads
VP 2
Core 2
1 VP Folded
POWER7 chip 7
CPU 5
VP 1
CPU 8
Core 3
CPU 3
usr CPU 4
Core 1
CPU 2
Power is performance redefined
CPU 12
CPU 13
CPU 14
CPU 15
This is a folded processor.
a SMT4 Shared LPAR © 2011 IBM Corporation
IBM Power Systems
Terminology : CPU within AIX � To see the Logical CPUs - Physical CPU association: AIX command ‘smtctl’ � AIX V3 is born 1990 where 1 CPU = 1 Processor. • Some historic Unix commands are naming logical cpus as processor. • New AIX Commands are showing logical cpus with the right denomination.
On a POWER7 SERVER – With AIX
On a POWER5 SERVER – With AIX PHYSICAL CPUs or VIRTUAL PROCESSORS “PROC” /=>lsdev -C | grep proc proc0 Available 00-00 Processor proc2 Available 00-02 Processor proc4 Available 00-04 Processor proc6 Available 00-06 Processor
(VP 1) (VP 2) (VP 3) (VP 4)
LOGICAL CPUs “processor” /=>bindprocessor -q The available processors are: 0 1 2 3 4 5 6 7 /=>lparstat …type=Shared mode=Uncapped smt=On lcpu=8 mem=2048MB… ASSOCIATION LOGICAL CPUs–PHYSICAL CPU /=>smtctl This system supports up to 2 SMT threads per processor. SMT threads are bound to the same virtual processor. proc0 has 2 SMT threads. Bind processor 0 (lcpu0) is bound with proc0 (VP 1) Bind processor 1 (lcpu1) is bound with proc0 (VP 1) 8
Power is performance redefined
PHYSICAL CPUs or VIRTUAL PROCESSORS “PROC” # lsdev -C | grep proc proc0 Available 00-00 Processor (VP 1) proc4 Available 00-04 Processor (VP 2) LOGICAL CPUs “processor” # bindprocessor -q The available processors are: 0 1 2 3 4 5 6 7 # lparstat …type=Shared mode=Uncapped smt=4 lcpu=8 mem=2048MB … ASSOCIATION LOGICAL CPUs–PHYSICAL CPU # smtctl This system supports up to 4 SMT threads per processor. SMT threads are bound to the same virtual processor. proc0 has 4 SMT threads. Bind processor 0 (lcpu0) is bound with proc0 (VP 1) Bind processor 1 (lcpu1) is bound with proc0 (VP 1) Bind processor 2 (lcpu2) is bound with proc0 (VP 1) Bind processor 3 (lcpu3) is bound with proc0 (VP 1)
© 2011 IBM Corporation
IBM Power Systems
Questions / Answers root@davidson /=>lsdev proc0 Available 00-00 proc2 Available 00-02 proc4 Available 00-04 proc6 Available 00-06 proc8 Defined 00-08 proc10 Defined 00-10 proc12 Defined 00-12 proc14 Defined 00-14 proc16 Defined 00-16 proc18 Defined 00-18 proc20 Defined 00-20 proc22 Defined 00-22 proc24 Defined 00-24 proc26 Defined 00-26 proc28 Defined 00-28 proc30 Defined 00-30 proc32 Defined 00-32 proc34 Defined 00-34 proc36 Defined 00-36 proc38 Defined 00-38
-Cc processor Processor Processor 4 Processor Processor Processor Processor Processor Processor Processor Processor Processor Processor 16 Processor Processor Processor Processor Processor Processor Processor Processor
Virtual Processors or Logical CPUs ? How many XX do we have ? Why 4 available / 16 defined ? ANSWER root@davidson /=>lparstat -i Node Name : davidson Partition Name : aix61 Partition Number : 1 Type : Shared-SMT Mode : Uncapped Entitled Capacity : 4.00 Partition Group-ID : 32769 Shared Pool ID : 0 Online Virtual CPUs* : 4 Maximum Virtual CPUs* : 10 Minimum Virtual CPUs : 1
Why 16 defined and not 6 defined ? * “Virtual CPUs” means Virtual Processors 9
Power is performance redefined
© 2011 IBM Corporation
IBM Power Systems
Types of Logical PARtition (LPAR) � Dedicated Partition: – One partition has a whole number of cores (from one to the maximum supported by the server). – Can use virtual adapters and virtual disks. – Can share its non-used cores (Dedicated Donating) or Do not share them (Dedicated). – Can not borrow any cores if needed.
� Shared Partition in one Shared Pool: – One partition has a fractional number of cores (from 0.1 to the maximum supported by the server). – Can use virtual adapters and virtual disks. – Share its non-used cores, belonging shared pool. – Can borrow a fractional number of any cores if needed. •
Have a borrowing limit (Capped) or no borrowing limit (Uncapped).
– Is assigned to a pool of shared cores: Processors Pool or Shared Pool •
Group the cores which are shared by Shared Partitions.
� VIO Server: – An Appliance Partition used to virtualize physical network adapters, physical storage adapters and CD devices. – A server can have one to many VIO servers.
10
Power is performance redefined
© 2011 IBM Corporation
IBM Power Systems
PowerVM: Virtual Processor Definition LPAR 1 3 VP
VP
VP
LPAR 2 1 VP
VP
VP
LPAR 3 4 VP
VP
VP
VP
VP
PowerVM Hypervisor Shared Pool
Dedicated Cores
CORE 0 CORE 1 CORE 2 CORE 3
CORE 4 CORE 5 CORE 6 CORE 7
One POWER7 Processor � Cores are presented to LPARS’ Operating Systems as Virtual Processor (VP). � PowerVM virtualizes the physical cores, delivering a portion of a them to each LPAR.
11
Power is performance redefined
© 2011 IBM Corporation
IBM Power Systems
PowerVM: Capacity Entitlement Definition LPAR 1 - SHARED 3 VP – CE: 0.3
VP 10
VP 11
LPAR 2 - SHARED 1 VP – CE: 0.3
VP 12
LPAR 3 - DEDICATED 4 VP – CE is implicit: 4
VP 20
VP 30
VP 31
VP 32
VP 33
PowerVM Hypervisor Shared Pool CORE 0
CORE 1
Dedicated Cores
CORE 2
CORE 3
CORE 4
CORE 5
CORE 6
0.1
CORE 7 0.1
One POWER7 Processor � The whole or fractional number of cores is represented by the : Capacity Entitlement (CE). – The initial fraction is 1/10th of a core. – Additional fraction can be in order of
CORE 0 0.5
1.0
0.1
0.6
1/100th
of a core
• This presentation does represent only 1/10th. � Within HMC, Capacity Entitlement (CE) is called Processing Unit. 12
Power is performance redefined
© 2011 IBM Corporation
IBM Power Systems
HMC: Processing Unit for Capacity Entitlement
Type of LPAR
Used at Activation to figure entitled capacity
13
Power is performance redefined
© 2011 IBM Corporation
IBM Power Systems
PowerVM: Dedicated LPAR Definition LPAR 3 - DEDICATED 4 VP – implicit CE: 4 and physc: 4)
VP 30
used
idle
VP 31
used
idle
VP 32
used
idle
VP 33
used
idle
PowerVM Hypervisor Share Pool CORE 0
CORE 1
Dedicated Cores
CORE 2
CORE 3
CORE 4
CORE 5
CORE 6
CORE 7
One POWER7 Processor � Dedicated / Dedicated Donating LPARs: receive all fractions of cores (the whole core). � Dedicated LPAR: – Idle cycles « of the core » are not ceded: % idle is present. – You have dedicated cores : relationship 1:1 – Your cores are there for you and you only: IMMEDIATELY available. – As there is no sharing, there is the best processor affinity : you’re the only one to use these cores. 14
Power is performance redefined
© 2011 IBM Corporation
IBM Power Systems
PowerVM: Dedicated Donating LPAR Definition LPAR 3 4 VP Dedicated Donating (implicit CE: 4) VP 30
used
idle
VP 31
used
idle
VP 32
used
idle
VP 33
used
idle
PowerVM Hypervisor Share Pool CORE 0
CORE 1
Dedicated Cores
CORE 2
CORE 3
CORE 4
used
SP
CORE 5
used
SP
CORE 6
used
CORE 7
SP
SP used
One POWER7 Processor � Dedicated / Dedicated Donating LPARs: receive all fractions of cores (the whole core). � Dedicated Donating LPAR: – Idle cycles « of the core » are ceded to the share pool : share pool is extended. • %idle can be present. It does represent the %idle 4 Logical CPUs of the used core (SMT 4). – Your cores are there for you and you only: IMMEDIATELY available. – The processor affinity is restored after shared LPARs have been invited to use your idle cycles. 15
Power is performance redefined
© 2011 IBM Corporation
IBM Power Systems
PowerVM: Shared LPAR Definition LPAR 1 – SHARED UNCAPPED
LPAR 2 - SHARED CAPPED
3 VP – CE: 0.3 uncapped : 2.7 VP 10
VP 11
1 VP – CE: 0.3 VP 12
VP 20
PowerVM Hypervisor Shared Pool CORE 0
CORE 1
Dedicated Cores
CORE 2
CORE 3
CORE 4
CORE 5
CORE 6
CORE 7
One POWER7 Processor � Shared LPARs: receive a fractional number of cores. – Capped : the fractional number of cores goes up to the value of this fractional number (CE). • LPAR 2 can run up to 0.3 only because CE is 0.3 AND LPAR 2 is capped. – Uncapped: the fractional number of cores goes beyond the CE up to the whole number of VP (cores). • LPAR 1 can run up to 3.0 because VP is 3 AND LPAR 1 is uncapped.
16
Power is performance redefined
© 2011 IBM Corporation
IBM Power Systems
The “Virtual Processors”
THE «VPs»
17
Power is performance redefined
© 2011 IBM Corporation
IBM Power Systems
VPs vs AIX SMT Scheduling LPAR 3 4 VP Dedicated Donating (implicit CE: 4) VP 30
VP 31
used
used
VP 32
used
VP 33
used
Current (1H2012)
Default AIX Folding / SMT Approach Core 1
Core 2
ST (SMT 1)
Core 3
Core 1
Core 2
SMT 2
Core 1
Core N
AIX Folding – AIX SMT Scheduling
SMT4
� Current AIX folding / SMT scheduling approach favors : – single threaded performance, faster response time, and total LPAR level throughput • As load increases, cores are unfolded to keep them Single Threaded (ST mode) until all available LPAR cores are unfolded. • Some spare core capacity above what is minimally needed is held for workload spikes • Further load increases will start switching cores (VP) to SMT2 then to SMT4
18
Power is performance redefined
© 2011 IBM Corporation
IBM Power Systems
VPs vs AIX Folding LPAR 3 4 VP Dedicated Donating (implicit CE: 4) VP 30
VP 31
used
used
VP 32
used
VP 33
used
ARGH ! OUCH ! OUCH !
Default AIX Folding / SMT Approach Core 1
Core 2
ST (SMT 1)
Core 3
Core 1
Core 2
SMT 2
AIX Folding Active (physc varies)
Core 1
Core N
SMT4 All cores unfolded -> physc = nb VPs Tertiaries begin to be loaded.
My Sizing ??!!!! 100 users-4 cores; 200 users-8 cores and VP=8 – I have 100 users – physc 8 !!
� Current AIX folding / SMT scheduling approach favors : – single threaded performance, faster response time, and total LPAR level throughput • As load increases, cores are unfolded to keep them single threaded until all available LPAR cores are unfolded (VP)
19
Power is performance redefined
© 2011 IBM Corporation
IBM Power Systems
What your sizing did not tell you… MY SIZING ON MY SPREADSHEET 8 cores – 200 users
LPAR 3 We are in 1Q1776 – We have 100 users We configure 8 VPs – We expect 4 cores used
4 cores – 100 users (1Q1776) VP 30 VP 31 VP 32
used
used
used
used
used
used
VP 30
VP 33
used
VP 31
used
used
used
VP 32
used
VP 33
used
4 cores - + 100 users (2Q1779) VP 35
used
used
VP 36
used
used
VP 37
used
used
VP 35
VP 38
used
VP 36
used
used
used
VP 37
used
VP 38
used
physc = 6 to 8 – idle 35%
� Sizing does compute an equivalent of “processing” capacity – It’s an “in-depth” scheduling: it is not true at all. Core 1
Core 1
Core 1
– “sizing are linear” : it is not true at all.
20
Core 2
Core 1
Power is performance redefined
Core 2
rPerf 595 595 595 595 595
GHz 5.00 5.00 5.00 5.00 5.00
cores 64 48 32 16 8
rPerf 553.01 430.53 307.12 164.67 87.10
rPerf/core 8.64 8.97 9.60 10.29 10.89
© 2011 IBM Corporation
IBM Power Systems
MAXIMUM VPs FOR EACH LPAR LPAR 1 – 4 VP
LPAR 1 – 8 VP VP 1
VP 2
VP 3
VP 4
VP 5
VP 6
VP 7
VP 8
VP 1
Core 1
Core 2
Core 3
VP 3
VP 4
Shared Pool – 4 cores
Shared Pool – 4 cores Core 1
Core 4
t3 t2 t1 t0
VP 2
Core 2
Core 3
Core 4
Additional Context switches
Configuration A POOR PERFORMER - 8 VP > 4 CORES
Configuration B GOOD PERFORMER 4 VP < 4 CORES For my example it is equal : it should not.
The NUMBER of VPs for EACH LPAR MUST BE LESS THAN The NUMBER of CORES of the SHARE POOL.
� The VPs exceeding the number of cores will be dispatched sequentially: – Defining 8 VPs (Configuration A) gives a wrong assumption on the “real” parallelism. – Only 4 VPs are able to run physically at the same time because we have only 4 Cores
– The maximum parallelism degree (nb of VPs) for any LPAR is nb of CORES. � Configuration A does lose performance: – It can generate up to 3 VP Context Switches PLUS a hurting and useless loss of Processor affinity. 21
Power is performance redefined
© 2011 IBM Corporation
IBM Power Systems
Configuration A under Micro…second (< 1 s) Shared Pool – 4 cores
t0 Core 1
Core 2
Core 3
1 second
Core 4
t1
Launch/Stop Launch/Stop Launch/Stop
CLEANING (Save VP Context / Restore VP Context)
Launch/Stop
Core 1
Core 2
Core 3
Core 4
t2 Core 1
Core 2
Core 3
Core 4
CLEANING (Save VP Context / Restore VP Context)
Launch/Stop Launch/Stop Launch/Stop
Launch/Stop
t3 Core 1 Launch/Stop Launch/Stop Launch/Stop
Core 2
Core 3
Core 4
Launch/Stop
CLEANING (Save VP Context / Restore VP Context)
Launch/Stop Launch/Stop Launch/Stop
Launch/Stop
LPAR 1 – 8 VP – 32 CPUs VP 1
VP 2
VP 3
VP 4
CE: 4 due to 4 cores in Share Pool
VP 5
VP 6
VP 7
VP 8
Ratio CE/VP : 0.5
22
0-3
4-7
8-11
12-15
run
t0: 16 Effective CPUs running
16-19
20-23
24-27
28-31
stop
0-3
4-7
8-11
12-15
stop
t1: 16 Effective CPUs running
16-19
20-23
24-27
28-31
run
0-3
4-7
8-11
12-15
run
t2: 16 Effective CPUs running
16-19
20-23
24-27
28-31
stop
0-3
4-7
8-11
12-15
stop
t3: 16 Effective CPUs running
16-19
20-23
24-27
28-31
run
Power is performance redefined
© 2011 IBM Corporation
IBM Power Systems
Let’s see Configuration B under microscope Shared Pool – 4 cores
t0-t1-t2-t3 Core 1
Core 2
Core 3
Launch/Stop Launch/Stop Launch/Stop
• •
VP 1
VP 2
VP 3
Core 4
Launch/Stop
Less work for PowerVM Hypervisor � More performance for the LPAR Processor Affinity (No extra. Cleaning work). � More performance for the LPAR
VP 4
LPAR 1 – 4 VP – 16 CPUs CE: 4 due to 4 cores in Share Pool Ratio CE/VP : 1.0
23
0-3
4-7
8-11
12-15
t0: 16 Logical CPUs running
0-3
4-7
8-11
12-15
t1: 16 Logical CPUs running
0-3
4-7
8-11
12-15
t2: 16 Logical CPUs running
0-3
4-7
8-11
12-15
t3: 16 Logical CPUs running
Power is performance redefined
•
Always 16 “Effective” CPUs running • Continuously vs Disruptive
© 2011 IBM Corporation
IBM Power Systems
PowerVM Published Informations � At http://www.ibm.com/developerworks/wikis/display/WikiPtype/Performance+Monitoring+Documentation
� “P7 Virtualization Best Practice” – Page 5 “ 1.1.1 Sizing/configuring virtual processors: The number of virtual processors in each LPAR in the system should not “exceed” the number of cores available in the system (CEC/framework) or if the partition is defined to run in specific virtual shared processor pool, the number of virtual processors should not exceed the maximum defined for the specific virtual shared processor pool. Having more virtual processors configured than can be running at a single point in time does not provide any additional performance benefit and can actually cause additional context switches of the virtual processors reducing performance.
24
Power is performance redefined
© 2011 IBM Corporation
IBM Power Systems
PowerVM : Minimum of entitlement per VP
Each VP receives always 0.1 minimum of entitlement
……. THE «VPs» 0.x CE PER VP (Desired CE) 25
Power is performance redefined
SHARE POOL SLICES = NB. CORES x 10 © 2011 IBM Corporation
IBM Power Systems
The CAKE: Who’s eating the cake tonight ?
It’s LPAR 1 !
LPAR 1 – 4 VP – CE 0.4 + the cake left-over VP 1
VP 2
VP 3
LPAR 3 – 4 VP – CE 0.4
VP 4
VP 1
LPAR 2 – 4 VP – CE 0.4 VP 1
VP 2
VP 3
VP 2
VP 3
VP 4
You are LPAR1
LPAR 4 – 4 VP – CE 0.4 VP 4
VP 1
VP 2
VP 3
VP 4
4 VP
2.8 Cores
We have 4 Uncapped LPARs – Total 16 VP Shared Pool – 4 cores - COshar Core 1
Core 2
Core 3
Core 4
� Minimum to give to “the others” – The total of LPAR 2,3,4 deliver with the minimum each: (VPtotal - VP
LPAR1
)* 0.1
Here, you can not eat and you must give : (16 – 4) * 0.1 = 1.2 cores
� LPAR 1 can consume at maximum = Max physc – LPAR 1 can only consume a maximum of: COshar – Minimum to Give Here, 4 – 1.2 = 2.8 as Physical Consumed for LPAR 1 26
Power is performance redefined
© 2011 IBM Corporation
IBM Power Systems
The CAKE: How to eat MORE cake tonight ? LPAR 1 – 4 VP VP 1
VP 2
VP 3
You are LPAR1
LPAR 3 – 2 VP VP 4
VP 1
VP 2
3.4 Cores LPAR 2 – 2 VP VP 1
VP 2
LPAR 4 – 2 VP VP 1
VP 2
Total VPs for the share pool – 10 VPSHAR Shared Pool – 4 cores - COSHAR Core 1
Core 2
Core 3
We reduce the “others” VPs !! Less Guests, More Cake (sic).
Core 4
Who’s in charge of your Physc ? � Minimum to give to “the others”
“The others VPs” (ouch, ouch).
– The total of LPAR 2,3,4 deliver with the minimum each: VPtotal - VP
LPAR1
* 0.1
Here, you can not eat and you must give : (10– 4) * 0.1 = 0.6 cores
� LPAR 1 can consume at maximum = Max physc – LPAR 1 can only consume a maximum of: COshar – Minimum to give Here, 4 – 0.6 = 3.4 as Physical Consumed for LPAR 1 27
Power is performance redefined
© 2011 IBM Corporation
IBM Power Systems
The CAKE: What we have seen is so far
THE «others VPs»
Share Pool Size (nb of cores)
� “Reduce the others” means there’s a ratio between nb of Cores and the nb of VPs – Example 1 : ratio = 4 (16 VPs / 4 cores) – LPAR 1: max. physc is 2.8 – Example 2 : ratio = 2.5 (10 VPs / 4 cores) – LPAR 1: max. physc is 3.4
� People increase the number of VPs for an LPAR… – Thinking it guarantees a growth capacity of the LPAR. • For real, it increases automatically the physc with idle% • It activates folding activity. • It decreases the uncapped capacity of all others LPARs. • People doing server sizing become stressed or angry
� Large Share Pool with large uncapped are less predictable. 28
Power is performance redefined
© 2011 IBM Corporation
IBM Power Systems
What your sizing is not telling you clearly…
Sizing by rPerf: Techno Y = 1.5 x Techno X Reducing the number of cores Share Pool Size 60 cores Techno X 180 VPs defined : ratio 3
Share Pool Size 40 cores Techno Y
You reduce the number of cores
You reduce your nb of VPs!
180 VPs defined : ratio 4.5 should become 120 VPs defined : ratio 3
� As rPerf tells you : – Because the core is more powerful (4 arms)….you have sized with less cores. – Be fair, you buy less cores. Thus, use less VPs for your LPARs to keep at least the original ratio.
� Mostly doing migration to P7 servers, – People do not readjust the number of VPs. – BUT the number of cores has sometimes drastically decreased and thus, the ratio drastically increased.
– Avoid Global Frame computation -> Thus, Re-Adjust your number of VPs per LPAR. 29
Power is performance redefined
© 2011 IBM Corporation
IBM Power Systems
VP are always dispatched…except if folded My machine is a POWER5 SMT2 with 4 VPs. My Machine is idle : physc is 0.01. Why not 0.04 or 0.4?
Why my physc is 0.01 and not 0.04 or 0.4? physc is 0.01 because only 1 VP is unfolded (principle to be idle).
Why each VP has a minimum of 0.1 : A VP needs to run to cede its time, …. even it takes less than 0.1 to cede. Minimum Entitlement could have been less !!
DO NOT DESACTIVATE FOLDING 30
Power is performance redefined
© 2011 IBM Corporation
IBM Power Systems
The “Capacity Entitlement”
C O R E
VP THE «CE»
31
Power is performance redefined
© 2011 IBM Corporation
IBM Power Systems
PowerVM: Capacity Entitlement – Dispatch Wheel POWERVM Hypervisor Dispatch Wheel = 10 ms
LPAR 1 – 3 VP SHARED – CE: 0.3 VP 10
VP 11
VP 12 Core 0 Core 1 Core 2 Core 3 Core 4 Core 5 Core 6 Core 7 Core 8 Core 9 Core A Core B
LPAR 2 – 1 VP SHARED – CE: 0.3 VP 20
Total Shared Pool VPs : 4 VPshar
LPAR 3 – 4 VP DEDICATED VP 30
VP 31
VP 32
VP 41
VP 42
vp10
vp11
vp12
vp20
vp30
vp31
vp32
vp33
vp40
vp41
vp42
vp43
1
vp20
vp30
vp31
vp32
vp33
vp40
vp41
vp42
vp43
2
vp20
vp30
vp31
vp32
vp33
vp40
vp42
vp43
3
vp30
vp31
vp32
vp33
vp40
vp41
vp42
vp43
4
vp30
vp31
vp32
vp33
vp41
vp42
vp43
5
vp30
vp31
vp32
vp33
vp41
vp42
vp43
6
vp30
vp31
vp32
vp33
vp41
vp42
vp43
7
vp30
vp31
vp32
vp33
vp40
vp41
8
vp30
vp31
vp32
vp33
vp40
vp41
vp42
9
vp30
vp31
vp32
vp33
vp40
vp41
vp42
VP 33
LPAR 4 – 4 VP DEDICATED DONATING VP 40
0
vp43
VP 43
Total Frame VPs : 12 VPtot
LPAR 1, LPAR 2
LPAR 3
Shared Pool
Dedicated Cores
LPAR 4 Dedicated Donating Cores
� Each LPAR will receive its CAPACITY Entitlement (CE) every 10 ms (dispatch wheel). – Major difference between «Shared», «Dedicated», «Dedicated Donating»: IDLE CYCLES of Core.
� Shared Pool: Processor Affinity is optimum due a fabulous ratio of 4VPSHAR = 4 COSHAR. � Shared Pool: Processor Affinity determined by pHyp based on the CE of each Shared LPAR. 32
Power is performance redefined
© 2011 IBM Corporation
IBM Power Systems
PowerVM: The ratio CE/VP - Access to the core LPAR 2 1 VP – CE=0.3
LPAR 1 3 VP – CE=0.3 Min. Required VP 10
VP 11
VP 12
LPAR 3 4 VP – Dedicated it means CE=4 - %Entc 100%
VP 20
VP 30
VP 31
VP 32
VP 33
PowerVM Hypervisor Dispatch Wheel = 10 ms vp20
0
vp20
vp33
vp33
vp33
vp33
vp33
vp33
vp33
vp33
vp33
vp33
vp12
vp32
vp32
vp32
vp32
vp32
vp32
vp32
vp32
vp32
vp32
vp11
vp31
vp31
vp31
vp31
vp31
vp31
vp31
vp31
vp31
vp31
vp10
vp30
vp30
vp30
vp30
vp30
vp30
vp30
vp30
vp30
vp30
vp20
1
2
3
4
5
6
7
8
9
10
0
1
2
3
Shared Pool CORE 0
CORE 1
4
5
6
7
8
9
10
Dedicated Cores CORE 2
CORE 3
CORE 4
CORE 5
CORE 6
CORE 7
� Each LPAR will receive its CAPACITY Entitlement every 10 ms (dispatch wheel). – CEVP is a ratio (CE LPAR/ VPLPAR).
� With the minimum of 0.1 of CE/VP, – the Virtual processor has accessed during 1 ms only to the core.
The CE
CORE Access in ms= (CELPAR/VPLPAR) * 10 33
Power is performance redefined
© 2011 IBM Corporation
IBM Power Systems
“Limit the VPs, Core Access you receive” LPAR 1 3 VP – CE=0.3 Min. Required VP 10
vp20
LPAR 2 1 VP – CE=0.3
VP 11
vp20
VP 12
LPAR 3 4 VP – Dedicated it means CE=4 - %Entc 100%
VP 20
VP 30
PowerVM Hypervisor Dispatch Wheel = 10 ms Dispatch interval
vp20
vp12
Dispatch interval
vp11 vp10
0
1
2
3
4
5
6
7
8
9
10
0
CORE 1
VP 32
VP 33
vp33
vp33
vp33
vp33
vp33
vp33
vp33
vp33
vp33
vp32
vp32
vp32
vp32
vp32
vp32
vp32
vp32
vp32
vp32
vp31
vp31
vp31
vp31
vp31
vp31
vp31
vp31
vp31
vp31
vp30
vp30
vp30
vp30
vp30
vp30
vp30
vp30
vp30
vp30
1
2
Shared Pool CORE 0
VP 31
3
4
5
6
7
8
vp33
9
10
Dedicated Cores CORE 2
CORE 3
CORE 4
CORE 5
CORE 6
CORE 7
� For the SAME CELPAR , let’s compare Performance of LPAR 1 with Performance of LPAR 2: – 3 ms of core access (LPAR2) vs 1 ms of core access (LPAR1): “300% more” or “x 3 times” of core access !! – Dispatch Interval:
34
•
LPAR 1 : dispatch between 9 ms to 18 ms.
•
LPAR 2 : dispatch between 7 ms to 14 ms
Power is performance redefined
Who’s the Winner ? © 2011 IBM Corporation
IBM Power Systems
Welcome to “Adventures in Uncapland” LPAR 2 1 VP – CE=0.3
LPAR 1 3 VP – CE=0.3 Min. Required VP 10
vp20
0
VP 11
vp20 vp12
vp12
vp11
vp11
vp11
vp10
vp10
vp10
1
2
VP 20
VP 30
vp33
Dispatch interval
3
4
5
6
7
8
9
10
0
vp33
vp33
CORE 1
vp33
VP 32
VP 33
vp33
vp33
vp33
vp33
vp33
vp33
vp32
vp32
vp32
vp32
vp32
vp32
vp32
vp32
vp32
vp32
vp31
vp31
vp31
vp31
vp31
vp31
vp31
vp31
vp31
vp31
vp30
vp30
vp30
vp30
vp30
vp30
vp30
vp30
vp30
vp30
1
2
3
4
5
6
7
8
9
10
Dedicated Cores
Shared Pool CORE 0
VP 31
PowerVM Hypervisor Dispatch Wheel = 10 ms Dispatch interval
vp20
vp12
VP 12
LPAR 3 4 VP – Dedicated it means CE=4 - %Entc 100%
CORE 2
CORE 3
CORE 4
CORE 5
CORE 6
CORE 7
� My performance of LPAR 1 can be rescued by the UNCAPPED feature. – Same time of core access: 3 ms of core access. – Same dispatch Interval: LPAR 1 : between 7 ms to 14 ms
BUT,
“Who’s eating the cake tonight ?” 35
Power is performance redefined
© 2011 IBM Corporation
IBM Power Systems
“Adventures in Uncapland” is Adventures first You plan to be dispatched on uncapped capacity vp20
vp20 vp12
vp12
vp11
vp11
vp11
vp10
vp10
vp10
vp12
0
1
Dispatch interval
vp20
2
Dispatch interval
3
4
CAKE: 10 cores VPs : 10 VPs
Your «VPs» can be dispatched at 0.1ms on SAME core.
5
6
7
8
9
UNCAPPED Exposures •Processor Affinity Loss •Dispatch Delays “Adventures”
10
Share Pool Core 0Core 1Core 2Core 3Core 4Core 5 Core 6Core 7Core 8 Core 9
0
vp10
1
vp40
vp41 vp50 vp51
vp10 vp11 vp12 vp20
vp30 vp31 vp40
vp41 vp50 vp51
2
vp10 vp11 vp12 vp20
vp30 vp31 vp40
vp41 vp50 vp51
3
vp10 vp11 vp12 vp20 vp30 vp31 vp40
vp41 vp50 vp51
4
vp20 vp30 vp31 vp40
vp41 vp50 vp51
5
vp20 vp30 vp31 vp40
vp41 vp50 vp51
6
vp40
vp41
7
vp40
vp41
vp11 vp12 vp20 vp30 vp31
8
Share Pool
CAKE: 6 cores VPs : 10 VPs
Core 0Core 1Core 2Core 3 Core 4Core 5
Your «VPs» can be dispatched only at 0.5 ms on ANOTHER core (core5).
9 GOOD FOR PERF
Shared Pool A very calm and spaceful Share Pool
36
Power is performance redefined
BAD FOR PERF
Story of the “Interrupt at 3ms”
0
vp10
vp11 vp12
vp20 vp30 vp31
1
vp40
vp41 vp50
vp20 vp30 vp31
2
vp40
vp41 vp50
vp20 vp30 vp31
3
vp40
vp41 vp50
vp51 vp30 vp31
4
vp40
vp41 vp50
vp51 vp30 vp31
5
vp40
vp41 vp50
vp51 vp20
vp10
6
vp40 vp11 vp12 vp51 vp41
vp31
7
vp40 vp41
vp20 vp51 vp30
vp31
8
vp10 vp11
vp50
9
vp40 vp41 vp10 vp11 vp12 vp20
vp51 vp12 vp20
Shared Pool The « Jungle » of a crowded subway
© 2011 IBM Corporation
IBM Power Systems
Shared LPAR: Estimate Uncapped Exposure CORE Access in ms = (CELPAR/VPLPAR) * 10
PowerVM Hypervisor Dispatch Wheel = 10 ms vp12
vp12
vp12
vp12
vp12
vp12
vp11
vp11
vp11
vp11
vp11
vp11
vp10
vp10
vp10
vp10
vp10
vp10
0
1
2
3
4
5
6ms = (CELPAR/VPLPAR) * 10
Dispatch interval Potential uncapped
6
7
8
9
0.6
Or
10
- Try to use the cores you bought ! - Not to spend your time in dispatch wait.
= CELPAR / VPLPAR
VPLPAR = 1.67 CELPAR
(CE/VP) 0.1 0.2 0.3 0.4
Performance for growing uncapped is not safe here.
LPAR1 VP 1 - CE 0.1 is OK if physc 0.1 or 0.2. LPAR2 VP 1 - CE 0.1 to physc 1.0 is NOT OK 0.9 to gain in “Adventures in Uncapland”
0.5 0.6 0.7 0.8 0.9
Performance for uncapped is better : from acceptable to good. LPAR2 VP 2- CE 1.2 capped is OK LPAR2 VP 2- CE 1.2 physc 2.0 is better “Adventures in UncapLand” is more limited.
Prefer the green values if you rely on uncapped capacity And “Use the cores you bought”
1
37
Power is performance redefined
* CE is based on the expected number of sized cores.
© 2011 IBM Corporation
IBM Power Systems
Conclusions We have reviewed : – Part I : Basic Concepts of PowerVM. – Part II : Technical Insights on the balance on CE / VP for shared LPARs.
We hope this will help you to size, configure and implement Power7 Servers.
38
Power is performance redefined
© 2011 IBM Corporation
© Copyright IBM Corporation 2012
39
Notes on benchmarks and values
The IBM benchmarks results shown herein were derived using particular, well configured, development-level and generally-available computer systems. Buyers should consult other sources of information to evaluate the performance of systems they are considering buying and should consider conducting application oriented testing. For additional information about the benchmarks, values and systems tested, contact your local IBM office or IBM authorized reseller or access the Web site of the benchmark consortium or benchmark vendor. IBM benchmark results can be found in the IBM Power Systems Performance Report at http://www.ibm.com/systems/p/hardware/system_perf.html . All performance measurements were made with AIX or AIX 5L operating systems unless otherwise indicated to have used Linux. For new and upgraded systems, AIX Version 4.3, AIX 5L or AIX 6 were used. All other systems used previous versions of AIX. The SPEC CPU2006, SPEC2000, LINPACK, and Technical Computing benchmarks were compiled using IBM's high performance C, C++, and FORTRAN compilers for AIX 5L and Linux. For new and upgraded systems, the latest versions of these compilers were used: XL C Enterprise Edition V7.0 for AIX, XL C/C++ Enterprise Edition V7.0 for AIX, XL FORTRAN Enterprise Edition V9.1 for AIX, XL C/C++ Advanced Edition V7.0 for Linux, and XL FORTRAN Advanced Edition V9.1 for Linux. The SPEC CPU95 (retired in 2000) tests used preprocessors, KAP 3.2 for FORTRAN and KAP/C 1.4.2 from Kuck & Associates and VAST-2 v4.01X8 from Pacific-Sierra Research. The preprocessors were purchased separately from these vendors. Other software packages like IBM ESSL for AIX, MASS for AIX and Kazushige Goto’s BLAS Library for Linux were also used in some benchmarks. For a definition/explanation of each benchmark and the full list of detailed results, visit the Web site of the benchmark consortium or benchmark vendor. TPC http://www.tpc.org SPEC http://www.spec.org LINPACK http://www.netlib.org/benchmark/performance.pdf Pro/E http://www.proe.com GPC http://www.spec.org/gpc VolanoMark http://www.volano.com STREAM http://www.cs.virginia.edu/stream/ SAP http://www.sap.com/benchmark/ Oracle Applications http://www.oracle.com/apps_benchmark/ PeopleSoft - To get information on PeopleSoft benchmarks, contact PeopleSoft directly Siebel http://www.siebel.com/crm/performance_benchmark/index.shtm Baan http://www.ssaglobal.com Fluent http://www.fluent.com/software/fluent/index.htm TOP500 Supercomputers http://www.top500.org/ Ideas International http://www.ideasinternational.com/benchmark/bench.html Storage Performance Council http://www.storageperformance.org/results
Revised March 12, 2009
© Copyright IBM Corporation 2012
40
Notes on HPC benchmarks and values
The IBM benchmarks results shown herein were derived using particular, well configured, development-level and generally-available computer systems. Buyers should consult other sources of information to evaluate the performance of systems they are considering buying and should consider conducting application oriented testing. For additional information about the benchmarks, values and systems tested, contact your local IBM office or IBM authorized reseller or access the Web site of the benchmark consortium or benchmark vendor. IBM benchmark results can be found in the IBM Power Systems Performance Report at http://www.ibm.com/systems/p/hardware/system_perf.html . All performance measurements were made with AIX or AIX 5L operating systems unless otherwise indicated to have used Linux. For new and upgraded systems, AIX Version 4.3 or AIX 5L were used. All other systems used previous versions of AIX. The SPEC CPU2000, LINPACK, and Technical Computing benchmarks were compiled using IBM's high performance C, C++, and FORTRAN compilers for AIX 5L and Linux. For new and upgraded systems, the latest versions of these compilers were used: XL C Enterprise Edition V7.0 for AIX, XL C/C++ Enterprise Edition V7.0 for AIX, XL FORTRAN Enterprise Edition V9.1 for AIX, XL C/C++ Advanced Edition V7.0 for Linux, and XL FORTRAN Advanced Edition V9.1 for Linux. The SPEC CPU95 (retired in 2000) tests used preprocessors, KAP 3.2 for FORTRAN and KAP/C 1.4.2 from Kuck & Associates and VAST-2 v4.01X8 from Pacific-Sierra Research. The preprocessors were purchased separately from these vendors. Other software packages like IBM ESSL for AIX, MASS for AIX and Kazushige Goto’s BLAS Library for Linux were also used in some benchmarks. For a definition/explanation of each benchmark and the full list of detailed results, visit the Web site of the benchmark consortium or benchmark vendor. SPEC http://www.spec.org LINPACK http://www.netlib.org/benchmark/performance.pdf Pro/E http://www.proe.com GPC http://www.spec.org/gpc STREAM http://www.cs.virginia.edu/stream/ Fluent http://www.fluent.com/software/fluent/index.htm TOP500 Supercomputers http://www.top500.org/ AMBER http://amber.scripps.edu/ FLUENT http://www.fluent.com/software/fluent/fl5bench/index.htm GAMESS http://www.msg.chem.iastate.edu/gamess GAUSSIAN http://www.gaussian.com ANSYS http://www.ansys.com/services/hardware-support-db.htm Click on the "Benchmarks" icon on the left hand side frame to expand. Click on "Benchmark Results in a Table" icon for benchmark results. ABAQUS http://www.simulia.com/support/v68/v68_performance.php ECLIPSE http://www.sis.slb.com/content/software/simulation/index.asp?seg=geoquest& MM5 http://www.mmm.ucar.edu/mm5/ MSC.NASTRAN http://www.mscsoftware.com/support/prod%5Fsupport/nastran/performance/v04_sngl.cfm STAR-CD www.cd-adapco.com/products/STAR-CD/performance/320/index/html Revised March 12, 2009 NAMD http://www.ks.uiuc.edu/Research/namd HMMER http://hmmer.janelia.org/ http://powerdev.osuosl.org/project/hmmerAltivecGen2mod © Copyright IBM Corporation 2012
41
Notes on performance estimates rPerf for AIX rPerf (Relative Performance) is an estimate of commercial processing performance relative to other IBM UNIX systems. It is derived from an IBM analytical model which uses characteristics from IBM internal workloads, TPC and SPEC benchmarks. The rPerf model is not intended to represent any specific public benchmark results and should not be reasonably used in that way. The model simulates some of the system operations such as CPU, cache and memory. However, the model does not simulate disk or network I/O operations. • rPerf estimates are calculated based on systems with the latest levels of AIX and other pertinent software at the time of system announcement. Actual performance will vary based on application and configuration specifics. The IBM eServer pSeries 640 is the baseline reference system and has a value of 1.0. Although rPerf may be used to approximate relative IBM UNIX commercial processing performance, actual system performance may vary and is dependent upon many factors including system hardware configuration and software design and configuration. Note that the rPerf methodology used for the POWER6 systems is identical to that used for the POWER5 systems. Variations in incremental system performance may be observed in commercial workloads due to changes in the underlying system architecture. All performance estimates are provided "AS IS" and no warranties or guarantees are expressed or implied by IBM. Buyers should consult other sources of information, including system benchmarks, and application sizing guides to evaluate the performance of a system they are considering buying. For additional information about rPerf, contact your local IBM office or IBM authorized reseller. ======================================================================== CPW for IBM i Commercial Processing Workload (CPW) is a relative measure of performance of processors running the IBM i operating system. Performance in customer environments may vary. The value is based on maximum configurations. More performance information is available in the Performance Capabilities Reference at: www.ibm.com/systems/i/solutions/perfmgmt/resource.html Revised April 2, 2007
© Copyright IBM Corporation 2012
42