The Autonomy and Robotics Area (ARA) at NASA Ames Research Center has investigated the use of various types of Virtual Reality-based operator interfaces to remotely control ..... to make contact after the Mars Polar Lander started its.
Autonomous Robots 11, 59–68, 2001 c 2001 Kluwer Academic Publishers. Manufactured in The Netherlands. �
Virtual Reality Interfaces for Visualization and Control of Remote Vehicles LAURENT A. NGUYEN Recom Technologies, Inc., Autonomy and Robotics Area, Mail Stop 269-3, NASA Ames Research Center, Moffett Field, California 94035 MARIA BUALAT Autonomy and Robotics Area, Mail Stop 269-3, NASA Ames Research Center, Moffett Field, California 94035 LAURENCE J. EDWARDS Caelum Research Corp., Autonomy and Robotics Area, Mail Stop 269-3, NASA Ames Research Center, Moffett Field, California 94035 LORENZO FLUECKIGER NASA Ames Associate, Autonomy and Robotics Area, Mail Stop 269-3, NASA Ames Research Center, Moffett Field, California 94035 CHARLES NEVEU Caelum Research Corp., Autonomy and Robotics Area, Mail Stop 269-3, NASA Ames Research Center, Moffett Field, California 94035 KURT SCHWEHR AND MICHAEL D. WAGNER Recom Technologies, Inc., Autonomy and Robotics Area, Mail Stop 269-3, NASA Ames Research Center, Moffett Field, California 94035 ERIC ZBINDEN Caelum Research Corp., Autonomy and Robotics Area, Mail Stop 269-3, NASA Ames Research Center, Moffett Field, California 94035 Abstract. The Autonomy and Robotics Area (ARA) at NASA Ames Research Center has investigated the use of various types of Virtual Reality-based operator interfaces to remotely control complex robotic mechanisms. In this paper, we describe the major accomplishments and technology applications of the ARA in this area, and highlight the advantages and issues related to this technology. Keywords: visualization, robotics, virtual reality, planetary exploration, user interfaces, remote control 1. 1.1.
Introduction Mission of the ARA
The Intelligent Mechanisms Group (IMG) at NASA Ames Research Center has been involved for several
years in the development of operator interfaces to enable the control of vehicles deployed in remote environments. Recently, the IMG has merged with the Autonomous System Group to form the Autonomy and Robotics Area (ARA). As a result, the ARA activities are spread across a wide spectrum of domains such
60
Nguyen et al.
as artificial intelligence (rover autonomy, planning and scheduling, intelligent execution agents, fault diagnosis and recovery), hardware development (rovers, personal satellite assistant), computer vision (visual tracking, 3D terrain modeling) and user interfaces. The mission of the ARA is to investigate the use of autonomous robotic systems to meet NASA goals and objectives. In this paper, we review the main developments of the ARA in user interfaces for various projects. More specifically, we highlight the benefits and issues of using “Virtual Reality” (VR) interfaces. VR is sometimes also referred to as “Virtual Environments” (VE). 1.2.
Resources such as onboard power and data storage are usually very limited and must be used efficiently. In the case of planetary exploration these constraints can significantly impact the duration of the mission, navigation range of the robot and the science return. The robotic mechanism tends to have a large number of degrees of freedom to control, such as actuators, sensors and discrete powered subsystems. Robotic exploration systems carry as many sensors and science instruments as possible. This results in a large number of data streams that must be interpreted by both the rover operations and science teams.
Field Tests 2.
Planetary surface exploration missions involve an engineering team that provides the platform (e.g., spacecraft, lander, rover, etc.) and tools to perform science experiments, and a science team that defines and conducts the scientific experiments. In order to prepare for these missions, field experiments are conducted using teams, tools, and a test environment as much like the projected mission as possible. The objectives of such experiments include the evaluation of engineering tools; the interaction between the science and the engineering team; the exercise of various operational scenarios and a validation of the integrated components by performing an end-to-end test of the system under realistic conditions. 1.3.
Issues Involved in Remotely Controlling Robots
In general, there are a number of constraints to consider when developing a system to remotely operate a robot: Communication with the robot is limited by delays in data transmission, an intermittent or unreliable communication link and limited bandwidth. There is often little a priori knowledge of the remote environment. In planetary surface exploration, for instance, satellite imagery and elevation maps can help mission scientists select a scientifically interesting and relatively safe landing site. However, the highest resolution of current orbital data is on the order of meters, which can only provide a coarse description of the terrain. Thus, engineers and navigation algorithms must rely on in-situ images, and descent imagery, to determine an accurate local description of the terrain. In addition, the unstructured nature of the remote environment generally makes the development of navigation algorithms quite challenging.
2.1.
History of Previous Work Virtual Environment for Vehicle Interface (VEVI) (Piguet et al., 1996)
2.1.1. Motivation for Using VR Interfaces. Conventional mission operations to control robotic mechanisms involved minimal on-board automation and required a large ground control staff during the mission (Hine et al., 1995). The IMG proposed that the size of the ground control staff could be significantly reduced by: Putting more software automation on board the vehicle for local decision making. Implementing highly automated ground control software to receive, interpret and synthesize the state of the mechanism and present it in a very concise and comprehensible fashion. Consequently, the IMG developed VEVI to address the latter aspect. VEVI consisted of a user interface to control complex mechanisms that allows an unsophisticated operator to comprehend the current and past state of the system quickly, to plan and review high-level commands to the system, and to send those commands for the system to execute. Furthermore, the human visual system is a very high bandwidth means for communicating complex information to a human operator, but only if that information is properly presented. To take advantage of it, the IMG used VR techniques. The term Virtual Reality refers to highly interactive threedimensional computer-generated graphics. Special devices such as head-mounted displays, head-tracked stereo video displays using polarized glasses and 6dof input devices can create the illusion that the user is physically immersed in the VE. Although potentially
Virtual Reality Interfaces
any type of data can be displayed, Virtual Environments typically show familiar physical objects, such as an articulated robot. 2.1.2. Technology. VEVI was designed and implemented to be modular, flexible and distributed. The graphics component of VEVI was implemented using the WorldToolKitTM ; graphics library from Sense8 Corp. The user can customize VEVI, by connecting input/output modules that communicate with the given robotic platform to control, using a well-defined communication protocol. The robotic mechanism being controlled is decomposed into a series of objects that are displayed in VEVI. The geometrical information about the physical shape of these objects and their kinematic relationships can be encoded using VEVI Configuration Files (VCF). 2.1.3. Applications and Lessons Learned. VEVI has been utilized and evaluated on various platforms in many field tests and projects including: the underwater robot TROV (Telepresence Remotely Operated Vehicle) in the Antarctic (in collaboration with Deep Ocean Engineering Inc.), the 8-legged robot Dante II in the active crater of Mount Spurr in Alaska (in collaboration with the Robotic Institute of Carnegie Mellon University) (Fong et al., 1995), the 6-wheeled Marsokhod in the crater of the Kilauea volcano in Hawaii (Stoker and Hine, 1996), the early development phase of the free-flying 2armed satellite servicing robot Ranger (in collaboration with the Space Systems Lab of University of Maryland) and the automated forklifts of the Automated Material Handling System (in collaboration with the National Robotics Engineering Consortium). The main lesson learned in using this approach was that 3D visualization greatly improves situational awareness. Two modes of operating the robot with VEVI were identified: direct teleoperation and highlevel task planning. Direct teleoperation turned out to be less efficient, because of the interface’s high dependence on vehicle sensors. Whenever the sensing was degraded or data transmission was delayed, the virtual environment did not reflect the actual current state of the vehicle and became less useful, and sometimes misleading. However, using VEVI as a high-level task planner in conjunction with some level of rover autonomy proved to be an efficient means of control.
2.2.
61
Nomad’s User Interfaces: Direct Teleoperation and the Importance of Telepresence
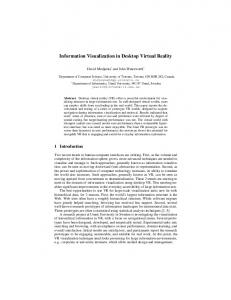
2.2.1. Technology. Developed by the Robotic Institute at Carnegie Mellon University (CMU), Nomad is a mobile robot designed for extended planetary exploration. Carrying its own fuel-powered generator, Nomad is a four-wheel drive, four-wheel steer, robust 550 kg rover with a transformable chassis. The robot features an actively pointed antenna to support highbandwidth communication, inertial measurement unit, gyrocompass and global positioning system (GPS) for navigation. The imaging system includes an ultrawide field-of-view (360 degrees) panoramic camera, highresolution narrow field-of-view color stereo-cameras, and black-and-white stereo cameras. Other science instruments such as a magnetometer and weather sensors (temperature, humidity and wind velocity) were mounted as well. The IMG partnered with CMU to develop Nomad’s operator interfaces (Wettergreen, 1997) including the “Virtual Dashboard Interface” and the “Telepresence Interface”. Virtual Dashboard Interface. The Virtual Dashboard Interface (VDI) enabled operators to drive Nomad (see Fig. 1). It was designed to be simple and intuitive to use and to provide compelling interaction with the rover, in order to increase operation efficiency. The VDI
Figure 1.
Samples of the virtual dashboard control panels.
62
Nguyen et al.
provides a clear visualization of the robot state in recognizable graphical and numeric formats. Multiple reconfigurable panels provide graphic telemetry displays and robot control widgets. These panels include: The telemetry display panel. This panel shows the position of the robot in world coordinates (latitudelongitude), orientation (yaw-pitch-roll), distance traveled, speed (provided by GPS), and chassis angle. A message window indicates the VDI activity and displays warnings when state values approach preset limits. An aerial tracking panel, which shows aerial photos of the area and Nomad’s position within them. This panel also provides waypoint specification capabilities. The camera control panel. This panel contains controls to maneuver the pan and tilt device, to set the mosaic pan and tilt ranges and to grab images. It also provides a graphic compass display. The driving control panel, which contains controls for sending direct teleoperation commands to the rover, such as go forward, stop, turn left. It also provides controls to set the turn radius, speed, etc. The VDI was initially implemented in the scripting language TCL/Tk for the IMG mobile 6-wheeled robot called Marsokhod and for Nomad, and was later ported to the scripting language Python/Tkinter for more recent field experiments. Telepresence Interface. Jointly developed with the GROK lab of University of Iowa, the Telepresence Interface uses the imagery from Nomad’s panospheric camera to give the operator a sense of presence in the robot’s environment. The panospheric camera consists of a camera pointed at a spherical mirror that captures a 360 degree-panorama in a single image. Implemented using the Performer graphics library on a Silicon Graphics, Inc. (SGI) workstation, the Telepresence Interface de-warps the image for display, and allows the user to rotate the viewpoint and zoom-in on portions of the scene. The Telepresence Interface output was projected onto a large screen in front of the operator to provide a very useful forward-looking view of the environment, like through the windshield of a car. In addition, software was integrated to wavelet-compress the image, decompose it into packets, transmit it to multiple computers and recompose it.
2.2.2. Lessons Learned. In the summer of 1997, Nomad was deployed in the Atacama Desert in Chile and traveled more than 220 km under remote control to simulate a Mars or Moon traverse. The objectives included: the demonstration of the robot’s capability of a long traverse; test and validation of new strategies for terrestrial and planetary geological investigation; evaluation of various imaging techniques. This field test demonstrated that the ability to continually see all around the robot provided scientists with a more natural sense of position and orientation at the remote site than is usually available through more traditional imaging systems. This capability (which was lacking in previous field tests) substantially accelerated site exploration. Panospheric imagery clearly improved science efficiency. However, the target update rate of 7.5 Hz was not achieved, and averaged 1 Hz with a 5 second delay. This required some adaptation time for a novice Nomad operator. 2.3.
Marsmap and Ames Stereo Pipeline: Science Analysis for Mars Pathfinder (Stoker et al., 1999)
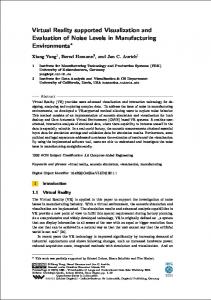
2.3.1. Mars Pathfinder Mission. In 1997, the Pathfinder spacecraft successfully landed on Mars, and deployed its mobile rover Sojourner. Among other science instruments, the Pathfinder lander featured a highresolution narrow field of view stereo-camera called IMP (Imager for Mars Pathfinder). Using the IMP images, the IMG demonstrated the value of 3D visualization for science (see Fig. 2) during the Mars Pathfinder Mission.
Figure 2. Measuring distance in Marsmap: from the robot Sojourner to the rock called Yogi.
Virtual Reality Interfaces
2.3.2. Technology. The Ames Stereo Pipeline was developed to automatically reconstruct photo-realistic 3D terrain models from stereoscopic images acquired by the IMP camera. The left-eye image is correlated with the right-eye image to find the disparity between features appearing in both images. This disparity is used to build a range map that shows the distance from the camera to the features. The range map vertices are then connected to form a polygonal mesh on which the original (left or right) image is projected. The end product is a photo-realistic 3D terrain model. A significant aspect of this project was the rapid generation and display of 3D terrain models. The raw images used to generate the models originated from the Deep Space Network, were transmitted to NASA Ames via JPL for processing. The models were then transmitted to Mission Control at JPL for display. This entire process took a matter of minutes. Marsmap (Stoker et al., 1999) was developed to display these 3D models in a VE allowing the user to inspect them from any vantage point, using different view control modalities. In addition to the spectacular visualization capabilities for navigating in the local Pathfinder site, Marsmap’s science tools enabled scientists to measure distances and angles in a matter of seconds (once the models were created and loaded). This operation would have required days, if the scientists had worked with the raw stereo-images using standard photogrametric techniques. 2.3.3. Results. The high-resolution of the IMP camera combined with the IMG’s ability to create geometrically correct models enabled over 2500 rock size measurements and 300 small sand wind streak measurements, used to determine the prevailing wind direction. Marsmap also featured cartographic markers, a tool used to mark locations where scientific measurement had been performed on the site. 2.4.
CMap and Mapping Executive: 3D Mapping the Interior of a Nuclear Shelter
2.4.1. Background. The Department of Energy’s International Nuclear Safety Program initiated an effort to deliver and deploy a tele-robotic diagnostic system for structural evaluation and monitoring within the Chernobyl Unit-4 shelter. Tele-operated with two joysticks, a mobile robot, called Pioneer, was to 1) enter the damaged nuclear plant and acquire environmental data such as radiation level, temperature, and
63
humidity; 2) acquire core samples of concrete structures for subsequent engineering analysis; 3) using a radiation-hardened trinocular stereoscopic camera, create a photo-realistic 3D map of the interior. In this section, we will describe the software used to perform the last operation. 2.4.2. Requirements. The mapping operation consisted of acquiring a series of stereo-image mosaics of the robot surroundings, processing the images to create 3D models, merging these models together to form a complete map of the interior and that would be analyzed. The target operation conditions presented a number of challenges. First, the VR interface had to be simple and very robust. Second, data processing and management had to be fully automated to allow local personnel unfamiliar with computers to operate the system. Operators would possibly be wearing safety equipment (goggles and gloves), which made computer use cumbersome. In addition, except for the blueprint of the intact building, no knowledge of the actual structure was available. The mapping sequences had to be decided during the operation. The operation inside the building had to be as quick as possible, in order to minimize the exposure of the crew and robot to radiation. The dimly lit scenes could cause the stereo correlation software to fail without adequate control and supervision over lighting. Also, the integration of a large number of data sets captured at different robot locations and at different times into a unified map required sophisticated mesh merging algorithms that rely upon accurate position estimates of the robot. Finally, the data volume was significant enough to require a robust automated system to organize and archive the data into a comprehensive database, for subsequent retrieval and processing. 2.4.3. Technology. The NASA Jet Propulsion Lab, Carnegie Mellon University, University of Iowa and the IMG joined their efforts to develop the Chernobyl Mapping System (CMap) (Blackmon et al., 1999) an automated 3D mapping system for requesting, creating, managing and interactively displaying photo-realistic 3D models of the interior of the power plant. In this section, we describe the operator interface of CMap, a variation of Marsmap developed for Pathfinder, which ran on a Silicon Graphics UNIX workstation. The task was decomposed into two distinct phases: data acquisition and data analysis. Consequently, CMap provided two VR user interfaces,
64
Nguyen et al.
CMap-Acquire, and CMap-Analyze. CMap-Acquire was designed to be operated on site during the data acquisition (see Fig. 3). Using CMap-Acquire, the operator generated image acquisition command sequences by specifying the size (in pan and tilt angles) of the mosaic of images to acquire. A module called Mapping Executive was developed to automatically maneuver the pan/tilt device to the necessary intermediate steps and acquire the images. CMap-Acquire was designed to display all pertinent information in a concise way. The interface included a display panel for the number of images contained in a sequence, the data volume, and a sample of acquired images and range maps for visual inspection. It also included a control panel to set the mosaic size and initiate, stop or resume the image acquisition operation. CMap-Analyze was designed for the analysis phase that was performed in a safe environment without time or operation constraints. The photo-realistic 3D range maps were fully processed, merged, and subsampled into different levels of details. CMap-Analyze featured more sophisticated capabilities, such as measurement tools and selection of dataset to visualize. An elaborate file structure was designed to store the different products, in order to provide a uniform database for CMap-Acquire, CMap-Analyze and the Mapping Executive. The database, called the Telepresence Archive (Blackmon et al., 1999), was hierarchically organized with respect to robot position and panoramic sequence number. The Telepresence Archive could be directly browsed from CMap-Analyze in order to select the portions of the 3D map to display. 2.4.4. Lessons Learned. Robotic exploration tasks involve collecting data, often in the form of images. Resources are often allocated for developing optimized interfaces or accurate acquisition systems, but archiving the data is often neglected. The large volume of raw data produced in this project was manageable by conventional methods (such as relying on the file system). However, the derived products, such as 3D mesh files, disparity files, range maps or corrected images, at least doubled the data volume and required a more sophisticated archiving system. 3. 3.1.
Viz and Current Developments Motivation of Viz
The motivation for the development of Viz was to create a visualization infrastructure that enables the ARA
to leverage its experience in Virtual Environments, science analysis and robot control by merging its capabilities together into a comprehensive operator interface. Imagine a single operator being able to run an entire mission, from driving the vehicle, to deploying instruments and performing science experiments. Depending on the task being performed, the operator would be able to reconfigure the control interface on the fly by turning on or off different modules when needed. The design of Viz emphasized easy integration of external technologies, improved interaction with the objects in the VE, and support of distributed collaborative science. We decided not to rely on commercial packages, because they were too limiting. They tend focus on a specific number of features required by the Viz system needed to support. For instance, while Geographic Information Systems (GIS) packages provide a suite of tools to manipulate 2D or 3D geographic information, 3D design packages like (ProE), allow 3D visualization of a mechanical system and possibly dynamic simulation. Viz also differentiates itself from similar systems being developed within NASA, such as the Web Interface for Telescience (WITS) or the Rover Control Workstation (RoCs), by focusing on using VR techniques to go beyond just visualization and display and allow a bidirectional interaction with the operator. 3.1.1. Integration of New External Technologies. The fast pace of NASA missions combined with the diversity and complexity of ARA projects involving the control of autonomous robotic systems requires increasing amounts of resources to build efficient application–specific control interfaces. The objective of the Viz development is to leverage existing technologies as much as possible by enabling rapid and easy integration of both commercial packages and technologies developed within NASA. This strategy can significantly reduce the development cycle and the cost of prototyping. 3.1.2. Improved Interaction with the Models. Previous experience with Nomad, VEVI, CMap and Marsmap showed the benefits of using 3D visualization. However, human interaction with synthetic objects can be improved, such as the ability to query information by selecting objects, or grabbing and manipulating objects, or drawing regions of interest on the ground. Similarly, more access to the VR interface and its internal scene should be provided to external
Virtual Reality Interfaces
65
modules. For instance, a simulator might want to know how high the ground is at a certain location, and thus can take advantage of the VR interface’s ability to compute that information. 3.1.3. Distributed Collaborative Science. Allowing a distributed team of scientists to collaborate together and with the mission ground control team from their home institutions helps reduce the programmatic costs of hosting an entire science team at Mission Operations. It will also increase the number of scientists able to participate and therefore the possible amount of knowledge that can be shared. By providing an infrastructure for distributed science, we aim to improve the science productivity of a mission. 3.2.
The CMap-acquire interface.
Figure 4.
The Viz interface for Mars Polar Lander.
Design and Implementation
Based on previous experience, we designed Viz to be a generic modular and flexible VR-based interface that allows easy reconfiguration and rapid prototyping. The core 3D module of Viz is implemented as a generic multi-threaded server, to which application specific clients connect via TCP/IP. Once connected to the server, clients can dynamically modify the scene by sending messages. The server dedicates a thread for each client to process incoming messages and a separate thread for rendering. Additionally, an API for sending messages is automatically generated in Java, C++ and Python from the message specification. Using this API, an application developer can rapidly interface an external module as a new client to Viz. The current system runs on SGI and Linux platforms. The 3D graphics rendering capabilities of Viz are based on the OpenInventorTM graphics library. 3.3.
Figure 3.
Application to the Mars Polar Lander Mission
The Mars Polar Lander was scheduled to land on the Mars South Pole in December 1999. Among other instruments, the science payload included: the Surface Stereo Imager (SSI) similar to Pathfinder’s IMP; the 4 joint Robotic Arm to dig into the surface and collect samples for on-board analysis; and the Robotic Arm Camera (RAC), a monoscopic camera mounted on the robot last joint to acquire close-up images. Tightly involved with the science operations of the Mars Polar Lander mission, the ARA closely collaborated with the Jet Propulsion Lab to provide 3D
modeling capabilities. The SSI images were automatically processed, using the Ames Stereo Pipeline technology, to create range maps for the Robotic Arm operation team and 3D photo-realistic terrain models for the science team. Using Viz (see Fig. 4), we demonstrated the rapid development of a unified user interface that could provide science analysis, planning and simulation capabilities. The tool integrated three main components: a Science Analysis tool, the Stereo Pipeline and a Planning tool. The Science Analysis tool extended the set of capabilities available from Marsmap in the Pathfinder mission with: the ability to produce a 2D cross-section of the ground elevation along an arbitrary line defined by the user,
66
Nguyen et al.
the ability to perform surface and volume measurements, in addition to the point, distance and angle measurements available since Pathfinder, and a comprehensive system of Markers to interactively annotate terrain models and also place synthetic objects of known size to give the user an idea of scale (soda can, human figure, etc.) The Ames Stereo Pipeline was linked to Viz, so that new terrain models could be automatically displayed in Viz on the operations meeting area projection screen at University of California in Los Angeles (UCLA) as soon as they were processed, without human intervention. The Planning tool featured a series of programs to help the operator plan and review command sequences for the Robotic Arm and the SSI camera. Targets for arm placements or camera pointing vectors designated in Viz could be transmitted to the actual flight software used by mission operators to create and uplink the final command sequences. The Planning tool featured: an interactive kinematic simulation of the Robotic Arm [Virtual Robot (Fl¨uckiger et al., 1998)], a representation of the cameras’ field-of-view and an interactive simulation of camera images for any camera or robotic arm camea positions, a simulation of SSI command sequences to be uplinked to the lander, and modalities to designate targets for arm placement and camera pointing vector. The Viz system was tested and evaluated during the various mission operational readiness tests of the Mars Polar Lander mission. The fact that these tools were integrated together facilitated the distribution of the software system. We deployed Viz on five machines at the Science Operation Facility at UCLA and three other locations outside NASA Ames for outreach. Finally, Viz was also used to generate outreach products for press conferences. Unfortunately, NASA was not able to make contact after the Mars Polar Lander started its descent for landing, so real data from Mars were never received.
4.
Conclusion
In this paper, we have described the application of VR interfaces for controlling complex robotic mechanisms. Our involvement in planetary surface exploration has shown that VR interfaces can improve the operator situational awareness and provide valuable tools to help
understand and analyze the vehicle surroundings, and plan command sequences. Our first objective for future development of VR interfaces is to improve Viz planning capabilities for rover operation by utilizing the ARA’s existing technologies in rover autonomy, such as high-level goal specifications and automatic planners and schedulers (Blackmon et al., 1999). Our second objective is to develop a distributed visualization infrastructure to support distributed and collaborative science mission operations. By achieving these objectives, we will increase the overall efficiency of rover and science operations in future robotic exploration missions.
References Blackmon, T.T., Nguyen, L., and Neveu, C.F. 1999. The telepresence archive for virtual reality 3D mapping systems. ANS: Annual Symposium on Robotics and Remote Systems, Pittsburgh, PA. Blackmon, T.T., Nguyen, L.M., Neveu, C.F. et al. 1999. Virtual reality mapping system for chernobyl accident site assessment. In Proceedings SPIE San Jose, CA, 3644:338–345. Blackmon, T.T., Nguyen, L., Neveu, C.F. et al. 1999, Command generation for planetary rovers using virtual reality. 5th International Symposium on Artificial Intelligence, Robotics and Automation in Space (I-SAIRAS 99), Noordwijk, The Netherlands. Fl¨uckiger L., Baur, C., and Clavel R. 1998. Cinegen: A rapid prototyping tool for robot manipulators. In The Fourth International Conference on Motion and Vibration Control (MOVIC’98), Zurich, Switzerland, 1998, Vol. 1, G. Schweitzer, R. Siegwart, and P. Cattin (Eds.), pp. 129–134. Fong, T., Pangels, H., Wettergreen, D. et al. 1995. Operator interfaces and network-based participation for Dante II. In Proceeding of 25th SAE International Conference on Environmental Systems, San Diego, CA. Hine, B., Hontalas P., Fong, T. et al. 1995. VEVI: A virtual environment teleoperations interface for planetary exploration. SAE 25th International Conference on Environmental Systems, San Diego, CA. Piguet, L., Hine, B. et al. 1996. The Virtual Environment Vehicle Interface: A Dynamic, Distributed and Flexible Virtual Environment, 1996. Stoker, C. and Hine III, B. 1996. Telepresence control of mobile robots: Kilauea Marsokhod experiment. 96-0338 AIAA, Reno, NV. Stoker, C., Zbinden, E., Blackmon, T., Kanefsky, B. et al. 1999. Analyzing pathfinder data using virtual reality and superresolved imaging. Journal of Geophysical Research—Planets, 104(E4):8889– 8906. Stoker, C., Zbinden, E., Blackmon, T., and Nguyen, L. 1999. Visualizing Mars using virtual reality: A state of the art mapping tool used on Mars pathfinder. Extraterrestrial Mapping Symposium: Mapping of Mars, ISPRS, Caltech, Pasadena, CA. Wettergreen, D., Bualat, M., Christian, D. et al. 1997. Operating nomad during the Atacama Desert trek. In Proceedings of Field and Service Robotics Conference, Canberra, Australia.
Virtual Reality Interfaces
67
a research assistant in the Microengineering Department of EPFL, where he worked on a testbed for Endoscopic Surgery Training with Virtual Environments (Virgy Project). From 1999–2000, he was a post-doc in the Autonomy and Robotics Laboratory at the NASA Ames Research Center, specializing in haptic interfaces. He is currently a technical lead for the NASA Intelligent Systems Program.
Laurent Nguyen received his M.S. (1996) in Microengineering from the Swiss Federal Institute of Technology, Lausanne. From 1996– 1997, he led the development of a control interface for an overhead power line inspection robot at Toshiba Corp. He is currently a computer scientist in the Autonomy and Robotics Laboratory at the NASA Ames Research Center. His research interests include mobile robotics, Virtual Reality-based interfaces for robot control and scientific data analysis. Charles Neveu earned Bachelors and Masters degrees in Electrical and Computer Engineering from the University of WisconsinMadison, and a Doctorate in Physiological Optics from the Univerity of California, Berkeley. He works in the Autonomy and Robotics Group at NASA Ames Research Center in Mountain View, California.
Maria Bualat received her B.S. (1987) in Electrical Engineering from Stanford University and her M.S. in Electrical Engineering (1992) from Santa Clara University. Since 1995 she has been a research scientist in the Autonomy and Robotics Laboratory at the NASA Ames Research Center. Her research includes mobile robot navigation, visual servoing and telerobotic user interfaces. She is currently field test manager for the Ames planetary rover. Kurt Schwehr received his B.S. in Geology from Stanford University in 1996. From 1996–1998 he worked at the NASA Ames Research Center and was lead designer and project manager of the Viz robotic vehicle visualization and planning system. From 1998–2000 he was a visiting scientist at the Field Robotics Center (Carnegie Mellon University). During 2000, he was Chief Technical Officer for Etool and Die. He is currently purusing a Ph.D. in Geology at the Scripps Institute of Oceanography. Laurence Edwards received his Ph.D. in Mechanical Engineering from Stanford University in 1995. He is currently at the NASA Ames Research Center involved in the development of 3D visualization and surface reconstruction techniques for remote planetary exploration. Before joining NASA, Laurence Edwards was a member of the technical staff at Paraform Inc. where he developed innovative techniques for editing large polygon meshes. Prior to joining Paraform, he was a Chief Software Designer at Virtual Technologies, Inc. investigating techniques for direct manipulation of virtual objects.
Lorenzo Flueckiger received his M.S. (1994) and his Ph.D. (1998) in Microengineering from EPFL. During the Fall of 1994, he was
Michael Wagner is Director of Software Engineering at NCS Learn, an educational software company in Sunnyvale, California. He began his career as an Air Force Officer at the Space Systems Division in Los Angeles, California, where we worked on the development and acquisition of launch vehicle and spacecraft systems. At NASA Ames Research Center, Michael was a key member in several telerobotics and autonomy projects, including Deep Space One. Michael was a cofounder of Fourth Planet, Inc. which developed visualization products for computer network management. He holds a B.S. in Electrical Engineering from Duke University and a M.S. in Electrical Engineering from the University of Southern California.
68
Nguyen et al.
images and Virtual Reality interfaces for robotic exploration. In 1997, he participated to the Mars Pathfinder Mission where he was responsible for the creation of photorealistic 3D models of the landing site. Eric has received numerous awards and was selected as a recipient for the prestigious Aviation Week and Space Technology Laurel Awards in 1997 for his work on the Mars Pathfinder mission. He holds a M.S. in Microengineering from the Swiss Federal Institute of Technology. Eric Zbinden is a research scientist at the NASA Ames Research Center. His research focuses on 3D model reconstructions from stereo