GMD - German National Research Center for Information Technology ..... We will call structure tree the structure of a nested relation which can be described by.
VIRTUAL REALITY SYSTEMS FOR BROWSING MULTIMEDIA Antonio Massari Autorità per l’Informatica nella Pubblica Amministrazione Via Po 14 00198 Roma, Italy Lorenzo Saladini Integra Sistemi srl. Via Fara Sabina 2 00199 Roma, Italy Fabio Sisinni Walter Napolitano Università di Roma “La Sapienza” Dipartimento di Informatica e Sistemistica Via Salaria 113 00198 Roma, Italy Matthias Hemmje Aldo Paradiso Martin Leissler GMD - German National Research Center for Information Technology Integrated Publication and Information Systems Institute (IPSI) Dolivostrasse 15 D-64293 Darmstadt, Germany Abstract. In this chapter we introduce Virgilio, a system which supports the construction of non-immersive VR-based visualizations of complex data objects representing the result of a query performed on a multimedia database. Virgilio takes as input the dataset resulting from a query on a generic database, displays attribute values of the dataset on virtual world objects according to the capability of these objects to represent the proper type of data, represents semantic relationships among the objects in the dataset using the containment relationship and creates a corresponding visual representation composed of a collection of Virtual Reality Modeling Language scenes. 1.
INTRODUCTION
The potential of a database system as an information source for naive end-users can only be fully exploited if it is possible to easily formulate proper queries expressing the users information need towards the database and if the results of such queries can be presented to users in a cognitively effective manner. Visual query interfaces [3] [26] may help inexperienced users to easily express queries, but may possibly return large amounts of complex or highly structured information. In this case, the problem that the complexity of the query result could confuse users remains. Taking the user’s point of view, two types of critical situations can appear:
1.
When the underlying database schema contains many semantic relationships and constraints, the dataset representing the whole query result can be composed of many objects arranged in different of nested structural relationships. 2. Users often have only a rough idea about the information required. To solve their information need, therefore, they tend to favour browsing-oriented retrieval strategies, which cannot be supported by access mechanisms of traditional information systems, like visual query systems and matching paradigm oriented IR systems [4][18][21][23]. These basic problem can be solved utilizing advanced graphics technology to lower the cost of finding information and accessing it once it has been found. Increasing masses of information confronting a business unit or an individual have created a demand for graphical information management applications. While in the 1980s text-editing tasks forced the shaping of the desktop metaphor and many graphic user interfaces which are the state of the art today, in the next years, following the manyfold of multimedia information resources provided by the Web, information management, retrieval and access will be a primary force in shaping the successor to the desktop metaphor [31]. In this paper we present Virgilio, a system which explores an user interface paradigm that goes beyond the desktop metaphor. It aims at exploiting the capabilities offered by 3D visualization and Virtual Reality techniques. Virgilio generates 3D visualizations of complex data objects. It takes the dataset resulting from a query on a generic multimedia database as input and creates a visual representation composed of a collection of scenes described in VRML (Virtual Reality Modeling Language) [29]. In order to generate VRML scenes to represent the results of queries, Virgilio supports the definition of an information visualization mapping, or metaphor [16], among the objects of the dataset and the objects of a virtual world. In order to allow a proper visualization of data items, the construction of such a mapping is constraint by the following requirements: 1. the structure of the query result must be preserved; i.e., the aggregations (tuples, sets, sequences) derived from the database schema must be maintained in the virtual scenes; 2. virtual objects must be suitable for supporting the type of data to be displayed, (e.g., an object "portrait case" is suitable for an image data type, a virtual TV is suitable for a video data type); 3. visualization issues, concerning whether or not discriminating attributes are displayed in the "right" place to allow an effective browsing, must also be considered. The paper is organized as follows: we will first discuss basic motivations and related works. Then basic notions and concepts underlying the Virgilio system design are introduced and an overview of the system architecture is provided. Furthermore, we describe the currently existent prototypical implementation of the system. Finally, conclusions are drawn and future developments are outlined. 2.
MOTIVATIONS AND RELATED WORKS
With the increasing hardware performance of nowadays PCs and workstations, computer graphics is assuming an important role for multimedia data presentation. It is possible to display structural relationships among data and its context by applying visualizations. Such relationships would be more difficult to detect by a succession of individual search requests, and traditional, mostly list-oriented presentations. A proper data presentation system has to face some important issues [13]: • Visualization of large sets of objects; • Control of the intra-object complexity in the way to generate meaningful visualizations of single objects;
•
Control of the inter-object complexity in the way to generate meaningful visualizations of collections of objects; • User interaction to allow users to define areas of interest dynamically and to develop task specific visualizations of their own. Until the recent past visualization methods and metaphors were limited to 2D graphics, but now hardware and software performances allow to visualize static as well as dynamic 3D scenes [34]. 3D display methods can be usefully adopted for managing large sets of objects because they take advantage of natural human skills for spatial perception, orientation and spatial memories in the process of perceiving information spaces by means of spatial metaphors [5][17]. 3D visualization enables to make the screen space "larger" and "denser"[31], thus allowing visualization of large sets of objects. The screen space becomes larger because the user can get to a larger amount of ready-to-use information in short time and becomes denser because the same amount of screen can hold more objects, which the user can zoom into or animate into view in a short time. By means of perspective visualization, users are provided with a simple type of fish-eye view [33] and they can focus on a small part of the whole dataset. The addition of user interaction to the 3D display techniques can provide solutions for controlling the intra-object complexity and defining areas of interest dynamically. By manipulating objects or moving in the space the user will be able to disambiguate images, reveal hidden information, or zoom in for more detail, quickly accessing more information. Furthermore 3D environments can easily accommodate standard as well as multimedia attributes of the information objects, like pictures and videos. Indeed, recent works in scientific visualization showed that by exploring the data graphically the users can understand and realize the internal structure of data of large datasets [32] [25]. In regard to inter-object complexity, the semantic relationships among the objects in the dataset can be represented using the containment relationship among 3D objects. The threedimensional perspective “naturally“ organizes the information spatially into a global context and local areas of interest. Furthermore 3D visualizations for some of the classical data organizations have already been explored : Hierarchical (Cone Tree) [30], Linear (Perspective Wall)[24], Spatial [31]. Virtual Reality techniques allow to combine the advantages of 3D visualization with the power of metaphorical representations. The power of virtual reality is that it makes a part of the interface invisible: the user has no longer to manipulate the interface to manipulate the data: the user only needs to manipulate the data directly [11]. VR permits to shift cognitive processing load to the perceptual system more than other visual abstraction. Arranging the data of the query result into VR scenes, users are able to explore data more easily since they interact with familiar objects. Both the behavior of the system, i.e., the way in which the system reacts to the input of the user, and the structural and dynamic properties of the objects in a virtual world, i.e. the way in which objects can be composed and can act themselves, are completely known because they belong to the users' general backgrounds. As a consequence, no particular learning should be required to interact with and explore the dataset and in this way it is possible to reduce significantly the learning overhead of naive users in the process of accessing information. Moreover, since VR scenes can be enriched with many details (e.g. a painting in a room or a flower vase) users can easily locate the database objects within a certain context; in other words stay oriented, thus reducing the risk of getting lost in the VR space and in the explored information space as well. Until now, our interest focused on metaphorical capabilities offered by non-immersive VR techniques. The interface problems of immersive environments have not been solved, yet. In fact some studies revealed the visual disorders and the binocular deficits caused by head-mounted systems [37] [36] [28], other highlighted the user problems related to the headgear’s heaviness and the glove device’s inaccuracy of measurement [11]. Moreover, other studies have shown that lag in immersive environments greatly affects the accuracy of positioning tasks [7]. However, when these problems will be solved, immersive environments
could enrich metaphorical capabilities with a stronger sense of spatial presence involving the entire sensorial system of the users. Various studies on database visualization systems have been conducted, but they usually do not determine a generic approach to the problem. Some systems provide users with interface tools to explore datasets in a specific application domain ( e.g., statistical data [27] , medical data, document databases [18],[20],[39],[10]). An interesting development is the Dynamic Query paradigm tight coupled with the Starfield Display [1][35] to allow rapid, incremental and reversible navigations by querying over data resident in main memory. Range selections can be easily made on attributes via graphical user interface sliders. For every slider adjustment, a scatterplot display is updated to show the new query conditions. This method is useful for rapid exploration and detection of patterns and exceptions of data, but is limited to simple queries like conjunctions of disjunctions. Some systems (e.g.LyberWorld [18] and Cone trees [30] ) use 3D visualization techniques to represent information by means of abstract metaphors, where objects from an abstract world (e.g., cones, spheres) are used to compose visual representation of the explored dataset. The SemNet [12] system is an early example of 3D visualization of information structures. The structures visualized were mostly large knowledge bases, and were often arbitrary graphs. The results tended to be cluttered, and the cognitive task of understanding the structure was still quite difficult. The n-Vision system [14] exploits 3D to visualize n-dimensional business data. Multivariate functions are displayed in nested coordinates systems, using a metaphor called worlds-within-worlds. Although n-Vision focuses on continuos multivariate functions, it does exploit the human 3D perceptual apparatus to visualize abstract data. The Xerox PARC Cone Tree and Perspective Wall approaches focus on the visualization of linear and hierarchical information structures. For linear information, the perspective wall arranges information left to right on a virtual wall. For hierarchical information, the cone tree view is used. In the cone tree, hierarchies are laid out uniformly in three dimensions. The problem of intra-object complexity is not addressed by either visualization, a general mechanism for navigation within the information of a single node is not suggested. As opposed to the previous systems, Virgilio has been specifically thought to be a general purpose exploration tool for highly structured data where both the domain of interest and the user requests are considered as external parameters. It exploits the capabilities offered by 3D graphics to face the visualization of large sets of objects, the intra-object and inter-object complexity and the user interaction, but Virgilio also utilizes Virtual Reality techniques and their metaphorical potentialities to reduce the cognitive load in the process of information assimilation. Moreover, Virgilio is based on concrete metaphors (i.e., metaphors where the visual domain is composed by objects from every-day experience) in order to take advantage of common knowledge about real world objects.
3.
BASIC NOTIONS
In the following subsections we will describe the internal representation models which have been adopted to support Virgilio’s components. More specifically: we will describe the notion of STRUCTURE TREE that will be used to represent the way in which objects in the query result are aggregated; we will provide an abstract description of the objects (VIRTUAL WORLD OBJECTS) used to build the visual representation of data returned by the query;
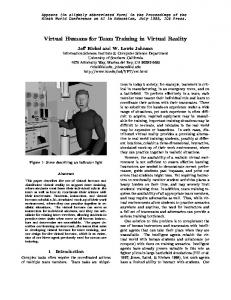
we will introduce the notion of Metaphor as a correspondence among Virtual World Objects and data in the query result. In order to better explain the internal models which we are going to describe, we will refer to a specific database. Its Entity-Relationship schema is shown in figure 1. notes (0,N)
belongs to
name (0,N)
Music Type
(1,1)
typically sings
(0,N)
case cover
name (0,N)
(0,N)
main author
CD
Singer
title
photo (0,N)
(1,N) audio
text
title (1,1)
(0,N) contains
Song
writer
Figure 1. E-R schema of the example database.
The database chosen as an example contains information about CD records, singers, music types and songs. Note that a considerable part of the information stored in our CD database is multimedia, for example the database contains a photograph for each singer, the cover picture for each CD and the audio file for each song. 1.1 STRUCTURE TREE An important notion of the Virgilio framework is the model used to represent the structure of the information to visualize. We will assume the portion of database returned by the user query to be organized according to a hierarchical structure. In particular, we will use the notion of nested relation [2] (informally, a set of tuples such that the values of attributes are allowed to be nested relations themselves) to represent the way in which the information to explore is organized. In such a context, we can state that Virgilio is a VR system for the visualization and the exploration of nested relations. We will call structure tree the structure of a nested relation which can be described by recursively composing the two constructs set_of and record. Referring to our example database schema reported in figure 1 consider the following query:
α β γ
Retrieve all the names and notes of a specific music type. For each music type, retrieve the name and the photo of the singers typically singing such music type. For each singer display: information about all the CDs of which the singer is main author. In particular display the CD title plus titles, texts and audio files of all the songs. all the titles and the text of the songs written by the singer.
Figure 2. A structure tree representing a query on the Musical CD database. The structure tree associated with the previous query is shown in figure 2, where the Sie benötigen Word 6.0c oder höher,
um Macintosh-Grafiken anzuzeigen.
Sie benötigen Word 6.0c oder höher,
um Macintosh-Grafiken anzuzeigen.
set_of and record constructs are displayed respectively with the symbols and . The circles attached to record symbols represent the atomic attributes. In a structure tree, we will define a key attribute as an attribute whose value identify at most one tuple in the immediately preceding set_of construct. Key attributes are displayed as black circles. The complete mapping among symbols and structure tree nodes is represented in table 1.
Structure Tree node
Symbol Sie benötigen Word 6.0c oder höher,
Set of node
um Macintosh-Grafiken anzuzeigen.
Sie benötigen Word 6.0c oder höher,
Record node
um Macintosh-Grafiken anzuzeigen.
Sie benötigen Word 6.0c oder höher,
um Macintosh-Grafiken anzuzeigen.
Attribute node Sie benötigen Word 6.0c oder höher,
um Macintosh-Grafiken anzuzeigen.
Key Attribute node Table 1
In a formal way, a structure tree can be recursively defined as: 1. D, where D is an atomic domain of values; 2. set of (T), where T is a structure tree; 3. record A1:T1,...An:Tn end, where the Ai‚s are distinct symbols, and the Ti‚s structure trees. A result object is an instance of a structure tree that can be recursively defined following its definition. Let T be a structure tree; 1. if T is an atomic domain D, then each element of D is an instance of T; 2. if T has the form set of (T‘), then an instance of T is a finite set of instances of T‘; 3. if T has the form record A1:T1,...An:Tn end, then an instance of T is a tuple t over A1,...An such that t[Ai] is an instance of Ti, for 1≤ i ≤ n. Consider the following structure tree: T : set of record A1:T1,..Ak:Tk,..An:Tn end If we say that the attribute Ak is a key it implies that for each pair of tuples t' t" in the set t'[Ak] ≠ t"[Ak]. 1.2 VIRTUAL WORLD OBJECTS Virtual World Objects (VWO) represent the building blocks for the construction of 3D visualizations. In order to allow a proper visualization of the data items, virtual world objects must have the following properties: • they must be able to display the different domains of data (e.g., text, images, etc.); • they have to properly represent data aggregations (tuples, sets) composing the query result structure. In order to exploit the advantages of metaphorical representations, data aggregations must be presented to the user in a familiar way; i.e. by clustering together VWO which, according to a common knowledge, are known to be grouped together. Our basic assumption is that of considering the natural containment relation (e.g. a room is contained in a corridor) among VWO as the grouping relation which is part of each user background. As a consequence, we claim that: by choosing an appropriate mapping among VWO and database objects, we are able to make use of the natural containment relation existing among VWOs, to “carry”, and properly visualize, structural relationships among objects of the database. This assumption will be formalized, and better defined, by means of the notion of metaphor introduced in the following section. Beyond their visual aspects, which can of course be more or less rich of details and realism, VWOs must be characterized, first of all, by the role they play in the representation of database objects and logical aggregations among them. It is necessary to clearly identify
which VWO can contain which other VWO, which is the modality of containment (i.e. whether or not a VWO can contain only homogeneous Objects) and which is the capability of the VWO to display information of the database. Moreover, in order to define a proper visualization for supporting the user’s browsing activity, a number of issues concerning visibility and hiding of VWO must be also addressed. In the Virgilio system, all information regarding VWO, are represented in a repository. Its E-R schema is displayed in figure 3. name VR object
VRML description
Container
(0,N)
Positioning Rules
(1,N) contains
Elementary Aggregator
Classifier
(1,1)
(0,1)
visually classifies
simple part of
Decorative Object
Accessory internal type
bounding position box
(0,1)
main part of
VRML primitive
(1,N) supports
(0,N) (1,N)
(min, max, avg (1,1)
(0,N) Type of Data
Logical Aggregator
Figure 3 - Virtual World Objects A Virtual World (VW) is simply a set of VWOs which are typically placed in the same context (e.g. the VW of a Ship, will include the VWO cabin, rescue boat etc). VWO is described by means of a name and a VRML description (a visual representation of VWO is shown in table 2). VWO may be partitioned into: Containers and Accessories.
Aggregator
desk
Classifier
drawer-case
Accessories
label with text
photo-frame with image
Table 2 - examples of Virtual World Objects
A container is an object related to other objects according to a containment relation. The containment relation can be of two forms, classification and aggregation. A container can classify a set of aggregators of the same type (for example an object file cabinet classifies objects of type folder), in this case we will say that the container is a classifier. Conversely, a
container can aggregate a set of objects of different types (for example a desk aggregates an object of type book and an object of type portrait case), in this case we will say that the container is an aggregator. An aggregator is associated with a (possibly empty) set of accessories, each accessory representing a support where one or more types of data (e.g. texts, strings, pictures) can be displayed. Note that the notions of classifier, aggregator and accessory, map, respectively, into the structure tree primitives: set_of, record and attribute. Continuing the repository description, relationship classifies relates each classifier object to the aggregator it classifies. Such a relationship has three attributes, min, avg, max representing the minimum, average and maximum number of objects contained in the classifier. At the base of the Virgilio system is the idea of using metaphorical power of Virtual Reality to effectively represent information of a database. Therefore, the naturalness of a scene is a critical factor for the success of such an approach; in other words, there should be a minimal distance of the synthesized environment to what the user considers a "normal" situation. Distributions of real world objects are typically constrained into well defined boundaries, for example a book will be typically composed of more than 10-20 pages and less than 2000, or a building can have a number of floors ranging from 1 to 150. By means of this information it will be possible to avoid the generation of “unnatural″ scenes with either too many or too few virtual world objects (e.g. a building with 1000 floors and a book with one page only). The entity accessory represents the set of the virtual world objects that pertain to some aggregator. The relationship supports relates an accessory to the set of type of data it can display. The attribute visible inside of the entity accessory and the relationship visible from represent visual characteristics to be considered for allowing the user to effectively browse the dataset. Information on visibility has to be considered in order to avoid the generation of scenes where the objects either remain hidden or indistinguishable from each other. In particular, the attribute visible inside represents, for each accessory, whether or not it can be seen in the same scene in which the corresponding aggregator object is visible. The relationship visible from identifies, for each accessory a, the set of classifiers which do not hide a. As an example, consider the container objects ROOM and CORRIDOR (a classifier of ROOMS) and the accessory of room LABEL ON THE DOOR (see figure 4). Label on the door is an accessory suitable for representing a string data type, it is not visible from inside (i.e. it is not visible in the same scene in which the object ROOM is displayed, see fig. 11), while it is visible from CORRIDOR (i.e. it can be seen from the scene where the object CORRIDOR is visible, see fig. 10). As a result, standing in the corridor and observing the label on the doors, the user will be able to distinguish the different database objects which will result mapped on the virtual objects rooms.
classifier
aggregator
2 classifies 50 10 corridor
room
has type of data visible from
label on the door supports string
accessory instance of elementary fact
Figure 4 - Relationships among virtual world objects
1.3 METAPHORS We define a metaphor to be a mapping between VWO and nodes of the structure tree corresponding to the user query (see table 3 for an example of metaphor).
VW Object
Kind
Structure Tree
Corridor
Classifier
set of singers
Room
Aggregator
singer
Label on the
Accessory
name of the singer
Photo frame
Accessory
image of the singer
........................
..............
................................
Table 3 An example of a metaphor.
In order to make the visualization of the final data an effective one, the metaphor should be carefully designed by following some general guidelines; more specifically: • the aggregation structure of the query result must be preserved • each data item of the query result must be provided with a physical support for its visualization • the user must be able to see in the scenes the appropriate data in order to perform browsing In the following paragraph we define the notion of structurally sound metaphor as a formal way of modeling a legitimate mapping with respect to the previous guidelines.
1.3.1 Structurally sound metaphors Let T be the structure tree of the query. We define a metaphor to be structurally sound iff the following conditions are satisfied: Each set of construct S in T is mapped into a VWO of kind classifier. The number of VWO which the classifier naturally classifies must be in the same range of the cardinality of the instance of S. Each record R in T is mapped into an aggregator having enough accessories to display the attributes of R and containing a set of classifiers each for every set of construct in R. Let r be a record construct in T; if Agg is the aggregator chosen for displaying r, a key attribute of r must be mapped in both an accessory that is visible from the classifier classifying Agg and an accessory visible from inside Agg. 1.3.2 Metaphor example Following the introduced guidelines it is now possible to build a sound visual representation, composed of objects of the Virtual World, for the α part of the previously specified query (see figure 5); the correspondence between Virtual World objects and structure tree nodes is shown inside the VW tree representation itself. In table 4 the graphic symbols used to indicate different object types are shown. Represented Object
Node Symbols
Aggregator
Classifier.
Accessory
Accessory visible from outside
Sie benötigen Word 6.0c oder höher,
Mapping
um Macintosh-Grafiken anzuzeigen.
Table 4
Note that, according to the rules expressed in previous sections, classifiers has been used to represent SetOf nodes, e.g., a Button Table represents the Set of Music Types and a Corridor represents the Set of Singers; conversely, aggregators have been used to represent Record nodes, e.g., a Floor represents the Music Type node and a Room represents the Singer node. Moreover proper accessories, capable of supporting Key Attributes and with correct visibility properties, have been chosen, in order to guarantee the structural soundness of the metaphor. As an example let us consider the Button Table and the Floor objects, which represent the Set of Music Types and the Music Type nodes of the structure tree, respectively; the Key Attribute Name of the Music Type has been mapped both on the Button Label accessory and on the Poster on the Floor accessory. They are both accessories of the Floor object but the
former is visible from the Button Table, i.e., the object classifying the Floor, while the latter is visible inside the Floor itself. building
elevator Set of music types
button table
button label
music type name
floor music type
poster on the floor
corridor Set of singers
sideboard
music type description
room label on the door
singer
poster on the wall
singer name
bottom banner
main picture
singer photo
Figure 5 - Virtual World Objects tree representing a metaphor It is worth noting that each of the Virtual World objects represents at most one node from the structure tree, but it is possible to have VW objects which are not bound to any structure tree node (e.g., the elevator node). 4.
ARCHITECTURE OF VIRGILIO
In figure 6 Virgilio system architecture is displayed. Main components of Virgilio are: a set of modules, called System administrator Tools, a global repository of information, and a Scene Construction server. The rest of the items displayed in figure 6, namely a DBMS a Web browser and an unspecified web network connection, will be considered external to Virgilio; we will assume the database to be a generic one with a structure composed of different kinds of objects, many semantic relationships and possibly containing multimedia data.
As we have already stated, Virgilio has been thought as a visualization system suitable whenever the information to explore is composed of a lot of highly structured data items. The strategy adopted in Virgilio is to present data resulting from query execution embedded in a 3D virtual scenario composed of virtual world objects. Such objects, due to their structural characteristics, can hide other objects or, simply, make their visualization in the current scene unnecessary (for example, in a scene with a corridor of closed and opaque rooms, it will be not necessary displaying the set of data items contained in the rooms). Therefore, in order to completely define a VR scene, not all data items of the query need to be retrieved at once. As a consequence, in order to avoid heavy load to the database server and unnecessary disk space allocation for storing the whole query result, it makes sense adopting a client-server architecture where database access is broken up in small query/result transactions returning only the information necessary to display the scene currently explored by the user. If an object-oriented database engine is available, it will furthermore make sense to capture metaphor’s mapping and scene construction methods in the DB functionalities by providing appropriate methods on information and meta information objects. System Administrator Tools classes and types Virgilio Meta DB
query repository
structure tree metaphor graph old metaphors
metaphor repository
database
open elementary QL scripts
DBMS Raw data
System administrator
Query tool
extended structure
Metaphor definition tool
logical containment information
Virtual World Objects editor
VR objects repository selected metaphor portion
VRML frameworks
-metaphor ID -object ID -met. node ID
Scene constructor server bounded elementary QL scripts
user needs
WEB
VRML browser
Final user
final VRML scenes
Figure 6 Users interacting with Virgilio belong to two different stereotypes: system administrators (expert users) final users (inexperienced users) We assume each of the two user stereotypes to interact with Virgilio according to specific roles. System administrators will collect specific needs of the final user and, in response, define queries which are of interest specifying “nice“ and effective VR visualization of data resulting from the execution of the queries. Final users interact with Virgilio system by retrieving 3D scenes and browsing embedded information by means of a VRML browser. Also, they may communicate with system administrators in order to request new queries and metaphors to be built. Similar to a standard client-server application running on the Web, a typical interaction between Virgilio and a final user will have the following framework: users ask for browsing a VR object (e.g. a building) Virgilio builds the corresponding first scene retrieving the necessary information from the database (raw data).
users explore the scene. When a user decides to navigate to another scene of the virtual world, a message is sent back to Virgilio which, in response, will generate a new scene. client application reads and displays the new scene, and so on. In the following a description of the tasks carried out by a System Administrator user is introduced and a brief explanation of the Scene Constructor Server is provided. 1.4 SYSTEM ADMINISTRATOR TASKS As previously stated, the role of a system administrator user is to customize Virgilio in order to allow final users to access data through VR scenes exploration. Three tasks have to be performed by the system administrator: defining queries in response to the user’s needs • defining new virtual world objects, specifying both their visual aspects and the containment relationships with other objects. specifying a set of proper VR visualizations of such queries by defining a mapping (or metaphor) among database objects and objects of a virtual world In order to carry out these tasks, a system administrator user is provided with a set of tools. In general, such tools will access the database only for retrieving information about the schema of the database and some statistical information about the distribution of the data items. This information (metadata) will be used to express the queries which the final user will be interested in, and to determine an abstract structure of the data resulting from such queries (see the Structure Tree section). Some tools will be used to create the Virtual World objects which will be used to accommodate the query result, while others will be used to define how database objects will result mapped in the objects of the virtual world. In both cases, the activity carried out by a system administrator using these tools will result in updating the different repositories of information, depicted in figure 6. The task of defining a query over the existing databases will be performed by means of a module called Query Tool. Such tool can be any general purpose query system which allows to express a generic query over a structured database; many examples of query tools useful for such a task can be found in the literature, and in this paper we will not refer to a specific one. Eventually, the query specification task will result in storing a set of data items in the Query repository. Such data items will represent a Structure Tree plus a set of database language scripts associated with the Structure Tree nodes. The scripts are useful for executing those transactions on the database which retrieve the instances of the structure tree nodes. Administrators users will define new VR objects, e.g. tables or drawers, by means of the Virtual World Object Editor; this tool will allow to specify the object type, according to the VR object repository classification, and its VRML description. Also, according to the type of object defined, it will be necessary to specify all the logical relations among the newly created object and the VR objects already present in the repository, i.e., containment and visibility relationships with respect to other objects. 1.4.1 Metaphor definition task Main task of the system administrator is to specify an appropriate VR visualization for the result of the queries. In order to do that, the system administrator has at disposal: the structure tree of the query, i.e. the way in which the data resulting form the query is aggregated and a set of virtual world objects which are related to each other by means of containment and visibility relationships. The definition of a metaphor must be made according to the general guidelines presented in the Structurally Sound Metaphors section. First of all one or more metaphors
which are structurally sound with respect to the query are to be found out, then the system administrator can select the most appropriate one and enrich it by adding decorative objects or refining the mapping. In order to find out the set of structurally sound metaphors, the system administrator can take advantage of the metaphor generator, a specific component of the Metaphor Definition Tool, not displayed in Figure 6. Given a particular Structure Tree, the metaphor generator is able to select a set of Virtual Worlds which can be used to soundly map the structure tree. We can assume the metaphor generator to work in the following way: given a set of virtual world objects stored in the VR object repository, the metaphor generator is able to extract the logical containment information and to find out one or more configurations which are structurally sound with respect to the given query. In order to simplify the search of metaphors, we can assume that the system administrator will specify the virtual world object which must be the starting point of the first scene. Besides the aforementioned issues, other considerations have to be taken into account, in order to allow the definition of a “good“ metaphor: Familiarity of the user with the VR object chosen. For example, a user belonging to the class of sailors will be familiar with the world of a ship, while, on the contrary he may be unfamiliar with the world of a skyscraper. Previous history of interaction of users with other metaphors. Important to the definition of a suitable metaphor will be the consistency of a mapping with respect to the metaphor previously learned by a user. In order to cope with this issue, the tools for defining a metaphor must maintain an internal history of interaction with final users. Constraints derived from a particular cultural background of a user. In the virtual world of a school building, for example, a user belonging to the teachers class would not accept to see the attribute case cover of a CD data item into the virtual world object board of a classroom. On the contrary the same mapping could be accepted by a user of type student. The expected next query the user may want to see on the system. It will be also important trying to foresee the future user requests in order to allow, in future, the addition of new objects in the scenes without having to rebuild a completely new world. Thus, it results evident that the role of the system administrator in defining a metaphor is a central one: from the set of all the structurally sound metaphors chosen by the metaphor generator tool, the system administrator has to find out which is the most appropriate one and to improve it by adding or removing virtual objects in the scenes. Even this task will eventually result in storing an appropriate data structure (a metaphor graph) in the Metaphor Repository. 1.5 SCENE CONSTRUCTOR The scene constructor is one of the most important modules of the VIRGILIO architecture. It executes the process of generating a scene in response to client requests produced by an end user during the exploration of a virtual world. Note that VRML directly supports the definition of a 3D scene as a tree of nested 3D objects, therefore each time an end user requests further information, Scene Constructor traverses a subtree of the metaphor tree currently used and builds the corresponding 3D scene. When an end user interacts with the VRML browser, each user action, like clicking on a VR object or issuing a shortcut command, is translated into a request sent to the server with the following parameters: identifier of the query whose result has to be displayed; • identifier of the metaphor used to display information; • identifier of the metaphor node to be displayed; • identifier of the database object for which a visualization is requested.
All this information have been previously enclosed in the actually browsed VRML scene, when such a scene has been built by the Scene Constructor. As a consequence, one of the tasks of the scene constructor will be embedding proper information in the result VRML scene, in order to allow further navigation to other subportion of the retrieved information. In response to end user input, Scene Constructor has to perform the following tasks: retrieve a subportion of the actual metaphor; retrieve the Virtual World Objects corresponding to the traversed nodes; retrieve data from the database; position Virtual World Objects and include data according to specific layout rules. The algorithm used by the scene constructor is a recursive one and it is driven by the metaphor currently selected, i.e. the scene construction algorithm will traverse in a recursive manner a portion of the metaphor graph, starting from the metaphor node provided as an input in the user request. For each metaphor node N traversed, the visual information (VRML frameworks, positioning rules) corresponding to the VR object associated with N will be considered for the scene construction. If the node N is also associated with a node of the structure tree, say T, then the query associated with T will be first bound to the current Oid and then executed against the database. Thus, the scene constructor has to access the metaphor repository in order to retrieve a subportion of the metaphor graph, the VW repository in order to retrieve the proper VRML frameworks, the Query repository to get the query language expressions associated with the structure tree nodes and the database server actually storing the data which have to be bound in the final scene.
5.
PROTOTYPE AND WORKING EXAMPLE
The actual prototype of the Virgilio system uses Illustra DBMS and WebSpace VRML browser as external components. It is now parametrical with respect to the database extension, but query, VW objects description and metaphor are still hardcoded in the actual Scene Constructor. The tool we have chosen to describe the final scenes representing the dataset embedded in a virtual scenario is VRML [10], an advanced language for describing interactive simulations and virtual worlds. Based on SGI Open Inventor ASCII format, it allows the specification of 3D scenes with rendered objects, lighting, materials, ambient properties and realism effects; it also supports extensions for networking and linking among different scene graphs allowing users to seamlessly navigate in 3D scenes distributed all over the Internet. Although its current version supports only a subset of the interactive behaviors offered by Open Inventor language, its standardization effort represents the most important single step to put VR on the Web and VRML promises to be an open and extensible language for distributed virtual world representations. Let us refer to the previously introduced query and suppose the user is at the beginning only interested in the α and β parts. Note that the elevator buttons are mapped into a key attribute of the record music type, i.e., the music type name; they are visible from the elevator in order to allow proper browsing. The first object in the scene graph represents a building: it contains the whole dataset, returned as the result of the query, and is the starting point for the exploration. Inside the building (fig. 7) the entrance hall aggregates different decorative objects and one container, the elevator; it classifies different kinds of music, providing an access to the next level of aggregation in the structure tree (fig. 8).
Figure 7 Entrance hall
Figure 8 The elevator, a classifier of floors
Figure 9 The Pop Music floor
Figure 10 Inside the corridor
Stepping out of the elevator (fig. 9) users may see a poster reminding them which floor had been chosen. The poster has been automatically chosen from the metaphor generator, since the elevator buttons are no longer visible in the scene. The notes of the music type has been mapped into a floor board while the corridor in front of the entrance provides access to the different singers. Walking through the corridor (fig. 10) it is possible to choose singers by means of labels beside each door. Note that a label on the door is an accessory of room that is visible from corridor, therefore it is suitable for mapping a key attribute of singer.
Figure 11 The Beatles room. Inside the room (fig. 11), users can see different objects representing the information related to the singer (in this case a group). The furniture contains different drawers, each one storing one CD and its related information.
Figure 12 A drawer. Both the title of the CD and its cover photo are used here to identify the content of each drawer (fig. 12), and at the lowest level of aggregation, data for each song is stored in different folders inside the drawer itself. Then it could be easy with a drag and drop operation on the song folder to make a virtual CD player or a virtual TV playing the song or the video clip. 1.5.1 Modifying the Query Suppose now the user decides to update the query. In particular the previous query is modified by adding the γ part. Following the same path and re-entering the room (fig. 13) users can see that the table, previously regarded as a decorative object, appears to be an aggregator and a new object, a book), has been put on top of it.
Fig 13 The book In the metaphor generation process, it is possible to put a container in a scene as it were a decorative object and to use it as an actual container at a second time. This strategy is particularly useful when users intend to explore the database starting from an initial query and then applying a sequence of small changes in the query specification. In this case, in order to not confuse the user, it is very important that the general structure of the metaphor results as less sensitive as possible to query changes (e.g. referring to the previous example,
the addition of g part in the initial query should not modify the basic associations music type floor, singer - room). Looking forward to a possible sequence of queries which can be requested by a user, the System Administrator should enrich the scenes of the initial metaphor using redundant visual objects and changing their role according to changes in the structure tree. In this way the mental strain of users, switching from one exploration session to the next one, will be reduced. 6.
CONCLUSIONS AND FUTURE WORK
We have presented a system which explores an UI paradigm that goes beyond the desktop metaphor to exploit the capabilities offered by 3D visualization and Virtual Reality techniques. It is able to handle important data visualization issues like visualization of large sets of objects, control of the intra-object complexity and the inter-object complexity, but Virgilio also utilizes Virtual Reality techniques and their “concrete” metaphorical potentialities to reduce the cognitive load in the process of information assimilation . Virgilio’s underlying model for flexibly encoding the mapping from the semantic space of information objects to the virtual space of visualization has been described. A prototype with parametricity limited to the extensional base has been developed and first informal usability test has been conducted with end-users. The next development efforts will be addressed to reach the total parametricity in order to have a general purpose visualization tool. Future works will focus on various development directions. VRML 2.0 new features[29] coupled with the capability to manage local interactions by means of Java enhance the user interaction with data. These features will allow the user to control the visualization of the data interactively and to highlight similar characteristics of the data by means of the object movements and animations. An other important development direction follows the way of optimization resources in order to fit the different technical network infrastructures (ISDN, INTRANET) possibilities with the requested bandwidth of the multimedia attributes of the DB and the VR. At last, we hope to put our theories of VR-concrete metaphors mapping information to a more complex test in which it will possible compare the utility and learning support provided by several different information access scenarios. These will include the printed page, hypermedia documents, 2D metaphors, 3D-concrete metaphors, 3D abstract metaphors, immersive VR. REFERENCES 7.
8. 9.
10. 11.
12. 13.
Ahlberg, C., and Shneidermann, B., “Visual Information Seeking: Tight Coupling of Dynamic Query Filters with Starfield Displays”, Proc. CHI`94 Human Factors in Computing Systems, ACM Press 1994, pp. 313-317. Atzeni, P., and de Antonellis, V., “Relational Database Theory”, Benjamin Cummings 1993. Batini, C., Catarci, T., Costabile, M.F., and Levialdi S., “On Visual Representation for Database Query Systems” Proc. of the Interface to Real and Virtual Worlds Conference, Montpellier, France, March 1993, pp. 273-283. Belkin, N.J., “Interaction with texts: Information Retrieval AS Information-Seeking Behaviour”, Information Retrieval '93: Von derModellierung zu Anwendung, 1993. :p.55-66. Bolter, J., Hodges, L., Meyer, T., and Nichols, A., “Integrating Perceptual and Symbolic Information in VR”, IEEE Computer Graphics and Applications, vol.15, no.4, July 1995, pp. 811. Bolter, J., Bowman, D.A., and Hodges, L.F., “The Virtual Venue: User-Computer Interaction In Information-Rich Virtual Enviroments”. Bryson, S., “Effects of lag and frame rate on various tracking tasks”.
14. Bryson, S., “Virtual Reality in Scientific Visualization”, Communications of the ACM, v39, n5, May 96, pp62-76 15. Canter, D., Rivers, R, and Storrs, G., “Characterizing User Navigation Through Complex Data Structures”, Behaviour and Information Technology, v4, n2, 1985, pages 93-102. 16. Chalmers, M., and Chitson, P., “Bead: Explorations in Information Exploration”, Proc. SIGIR'92, published as a special issue of SIGIR Forum, ACM Press, pp.330-337. 17. Erickson, T., “Artificial Realities as Data Visualization Enviroments: Problems and Prospects”, Virtual Reality Applications and Explorations, ed A.Wexelblat, Academic Press, 1993. 18. Fairchild, K.M., Poltrock, S.E., and Furnas G.W., “Sem net:Three-dimensional graphic representations of large knowledge bases”, Cognitive Science and its Applications for Human Computer Interaction, Guindon, R. Ed., Lawrence Erlbaum, 1988. 19. Fairchild K. M., “Information Management Using Virtual Reality-Based Visualization”, Virtual Reality Applications and Explorations, ed A.Wexelblat, Academic Press, 1993. 20. Feiner, S., and Beshers, C., “World within worlds: Metaphors for exploring n-dimensional virtual worlds”, Proceedings of the UIST’90, 1990, pp.76-83. 21. Goldstein, J., and Roth, S.F., “Using Aggregation and Dynamic Queries for Exploring Large Data Sets”, Proc. CHI`94 Human Factors in Computing Systems, ACM Press 1994, pp. 23-29. 22. Haber, E.M., Ioannidis, Y.E., and Livny, M., “Foundations of Visual Metaphors for Schema Display”, Journal of Intelligent information Systems, Special Issue on the Management of Visual Information, 1994. 23. Hemmje, M., “A 3D Based User Interface for Information Retrieval Systems”, Proceedings IEEE Workshop on Database Issues for Data Visualization, J.P.Lee, G.G. Grinstein (eds), Springer Verlag LNCS v871, Oct.1994, pp.194-207. 24. Hemmje, M., Kunkel, C., and Willet A., “Lyberworld - A Visualisation User Interface Supporting Full Text Retrieval”, Proceedings of ACM SIGIR`94, July 3-6, Dublin, 1994. 25. Javener, M. K., “Virtual Reality - What Will It Do to You?”, Computer Graphics, November 1994, Vol. 28, No. 4, pp. 244-245. 26. Krohn, U., “VINETA: Navigation through Virtual Information Spaces”, Proc. Workshop on Advanced Visual Interfaces 1996, p.49-58. 27. Lashkari, Y., “Domain Independent Disambiguation of Vague Query Specifications”, Univ. of Wisconsin (CS-TR-93-1181). 28. Lee, J.P., and Grinstein, G.G, “An Architecture for Retaining and Analyzing Visual Explorations of Databases”, Proceedings of. Visualization 95, pp.101-108. 29. Lee, J.P., “Data Exploration Interactions and the ExBase System”, Proceedings IEEE Workshop on Database Issues for Data Visualization, J.P.Lee, G.G. Grinstein (eds), Springer Verlag LNCS v871, Oct.1994, pp118-137. 30. Mackinlay, J.D., Robertson, G.G., and Card, S.K., “Perspective wall: Detail and context smoothly integrated”, Proceedings of SIGCHI’91, pp.173-179 31. McCormick, B., DeFanti, T.A., and Brown, M.D., Eds. “Visualization in scientific computing” Comput. Graphics 21, 6 (1987) 32. Massari, A., Pavani, S.,. Saladini, L. and Chrysanthis P.K., “QBI: Query By Icons”, Proceedings of the International Conference ACM-SIGMOD, S.Jose, California USA, 1995. 33. Meo-Evoli, L., Rafanelli, M., and Ricci, F.L., “An Interface for the Direct Manipulation of Statistical Data”, Journal of Visual Languages and Computing, 1994, 5, pp. 175-202. 34. Oman, C.M., “Sensory conflict in motion sickness: an Observery Theory approach”, Pictorial Communication in Virtual and Real Enviroments, S.R.Ellis, M.K. Kaiser, A.C. Grunwald (eds), London: Taylor and Francis,1991,pp.362-376. 35. The Virtual Reality Modeling Language Version 2.0 Spec.. On www, http://vag.vrml.org/VRML2.0/FINAL/spec/ 36. Robertson, G.G., Mackinlay, J.D., and Card, S.K., “Cone Trees: Animated 3D Visualizations of Hierarchical Information” Proc. CHI`91 Human Factors in Computing Systems, ACM Press 1991, pp. 189-194. 37. Robertson, G.G, Card, S.K, and Mackinlay, J.D., “Information Visualization Using 3D Interactive Animation”, Communications of the ACM, v36, n4, April 1993. 38. Rosemblum, L., et al., ed: “Scientific Visualization: Advances and Challenges”, 1995, Academic Press.
39. Sarkar, M., and Brown, M.H., “Graphical Fisheye Views”, Communications of the ACM, Dec. 1994, Vol. 37, No. 12, pp. 73-83. 40. Seligmann, D.D., and Feiner S., “Automated Generation of Intent-Based 3D Illustrations”, Comput.Graphics 25 (4), 1991, pp.123-132 41. Shneiderman, B., "Dynamic Queries : A Step Beyond Database Languages", University of Maryland Technical Report CS-TR-3022, 1993. 42. Strong, G.W, and O'Neil Strong K.E, “Visual guidance for information navigation: a computerhuman interface design principle derived from the cognitive neuroscience”, Interacting with computers: the interdisciplinary Journal of HCI, v3,n2, Butterworth-Heinemann,1991, pp.217231. 43. Travis, D., Watson, T., and Atyeo, M., “Human Psychology in Virtual Environments”, Interacting with Virtual Environments, L.MacDonald, J.Vince (eds), John Wiley & Sons Ltd,1994, pp.43-59. 44. “Virtual Reality Report” 2 (9), p.14. 45. Wilson, B.A., Fowler, R.H., and Fowler, W.A.L., “Integrating Query, Thesaurus, and Documents through a Common Visual Representation”, Proc. of the 14th Annual International ACM SIGIR Conference on Research and Development in Information Retrieval. 1991, p. 249259.