Int J Interact Des Manuf (2010) 4:125–136 DOI 10.1007/s12008-010-0094-4
TECHNICAL PAPER
Virtual representation of terrain through the web with VRML-Web3D and graphic libraries E. Martínez · E. Jiménez · F. Sanz · M. Pérez · J. Blanco · J. Santamaría
Received: 13 June 2009 / Accepted: 9 March 2010 / Published online: 9 April 2010 © Springer-Verlag 2010
Abstract This paper is focused on the analysis of virtual representation of terrain through the web, and shows the steps to follow in order to put into practice a virtual interactive terrain visualization system. The recent developments of threedimensional visualization systems can be naturally applied to terrain visualization targeted to the web, driving to a higher interaction level. Traditionally it has been implemented with 2D systems due to the huge data volume involved, but nowadays several possible technologies allow to achieve a 3D representation; two of them are analyzed in depth: VRML as an exponent of Web3D technology, and open source threedimensional graphic libraries. Their fundamental characteristics are considered, and their methodologies, pros and cons are illustrated by means of the development of some practical applications for terrain visualization, taking special attention in the implementation of the interaction facilities.
E. Martínez · F. Sanz · M. Pérez · J. Blanco · J. Santamaría Department of Mechanical Engineering, University of La Rioja, C/Luis de Ulloa, 26004 Logroño, La Rioja, Spain e-mail:
[email protected] F. Sanz e-mail:
[email protected] M. Pérez e-mail:
[email protected] J. Blanco e-mail:
[email protected] J. Santamaría e-mail:
[email protected] E. Jiménez (B) Department of Electrical Engineering, University of La Rioja, C/Luis de Ulloa, 26004 Logroño, La Rioja, Spain e-mail:
[email protected]
Keywords Terrain visualization · 3D graphics · Virtual reality · Web3D · Java 3D 1 Introduction In the last ten years, the increasing power of computers and graphics cards has stimulated developers and users to deepen Virtual Reality [4,24,28]. One of its natural applications of interest for the academic and the industrial communities is the Terrain Visualization Systems (TVS) [10,31,33]. In this field, two-dimensional representations have been completely superseded since three-dimensional (3D) visualization is closer to reality as well as easier to interpret. Furthermore, it allows the user to interact realistically with the environment [20,27]. Nowadays, there exist lots of issues to bear in mind on designing a TVS: various Web3D technologies to represent the Digital Terrain Elevation Models (DTEM), several ways to provide the TVS with sufficient realism, many graphic libraries both private and open-source projects, different applications to enable the user to interact with the system, etc. For example, some recent works can been reviewed about the use of non-proprietary available Web3D technologies (such as Web3D Consortium), specifically VRML, X3D and Java3D [12,14,18,21,25]. The creation of a DTEM can be referred for instance in [1,32,13]. There exist also several databases that can be used as starting point [15]. It is necessary to operate with these databases to extract a grid according to the necessities of realism and fast screen refresh required for this type of application. Furthermore, a correct structure and nomenclature for this grid must be carried out, in order to facilitate and to expedite its management. Another important aspect is the inclusion of texture-mapping in the model to give realism to the visualization [8,17,19]. The applied textures are the terrain orthophotographs, which are
123
126
previously treated, to readjust them according to the coordinates of the VRML environment, partitioned—with the appropriate size for the different elements that constitute the DTEM—or properly structured in order to improve the interactive visualization of massive textured terrain datasets if needed. Regarding the VRML viewers that can be used to represent the DTEM, some well-known samples are DeepViewTM , CASUSPresenterTM , WorldViewTM , BS Contact, Viewpoint Media Player, Emma 3D. Once 3D navigation system is developed, some interaction tools can be added using VRML Script and Java [37]. As it can be seen, there are several developments all over the world and very recent semantics in 3D visualization, so it is necessary to make an special effort in generating surveys and standards [9]. In this paper, we wish to contribute to clarify the process of development of a TVS in real time by providing a guide through the issues previously commented and illustrating the stages with practical examples. We explain the pros and cons of some of the different currently available options, offering criteria for an appropriate development. We come out of our experience in the Renewable Energy Research Group of La Rioja (Spain) to illustrate this guide. In order to overcome the limitations given by Web3D technologies in general, and VRML in particular, a specific graphic engine developed with open source graphic libraries is shown. Some programs—used to rename the terrain textures according to general VRML structures—and small applets, as interaction tools between the user and the 3D scene, have been implemented in a virtual TVS of La Rioja (one of the 17 autonomous regions in Spain, with a surface of about 5,000 Km2 ). They are used to clarify and exemplify some issues throughout the paper. The paper is organized as follows. First, the basic characteristics of a TVS will be briefly commented in Sect. 2. The Web3D-VRML technologies are introduced in Sect. 3 where their strong and weak points are shown. Section 4 is devoted to explore the VRML viewers and some tips to create the DTEM and to endow the TVS with interactivity are provided. The development of the graphic engine, and its libraries, which present the 3D geometry of the scene, are discussed in Sect. 5. Finally, Sect. 6 concludes the paper and refers to future work. 2 Terrain visualization The spatial distribution of the terrestrial surface is a continuous function, but for a digital storage and representation of these values it is necessary to reduce the infinite number of points to a finite and manageable number, so that the surface can be represented by a series of discrete values (surface discretization). For this purpose, Digital Terrain Models (DTM) and DTEM are used. A DTM is a numeric data structure that represents the spatial distribution of a quantitative and
123
E. Martínez et al.
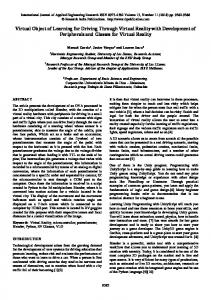
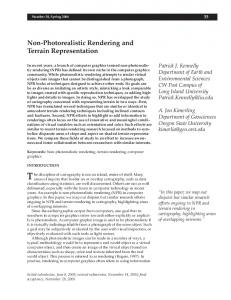
continuous variable. These variables may be height, slope, contour and orientation, as well as any other data applicable specifically to the terrain and the characteristics of any given point. A DTEM is a numeric data structure that represents the height of the surface of the terrain. By definition it can be seen that a DTEM is a particular type of DTM [29]. These DTEM are usually stored in two digital formats: a) as a map of heights, that is, a two-dimensional matrix in which each quadrant represents the corresponding height of each point; b) by means of chromatic representation of the heights, that is, an image either in shades of grey or in colours, where they depend on the specific height of each point defined. In general, dark colours are assigned to areas with low heights, and light colours are assigned to areas of high heights. Obviously both formats are similar, but the main problem with this second storing method is the colour scaling assigned to the true terrain height. Starting from this point and taking any of the DTEM available on the market as a reference, it is possible to develop an own 3D DTEM. For this purpose, a polygonal surface can be created, where the vertexes agree with the coordinates taken from the appropriate DTEM [30]. The next step is to achieve that this 3D model has a realistic appearance; that is to say, that it allows the user to perceive more details of any height of one given point with respect to any other one. To achieve this objective, we can think about the possibility of incorporating a specific model texture. The quickest method for achieving this realistic aspect is by using orthophotographs of the terrain. An orthophotograph is a digitally corrected photographic presentation that represents an orthogonal projection of an object, generated from real oblique photographs. Thus, in an orthophotograph, actual horizontal measurements can be taken, the same way how they can be taken from a map. Incorporating these corrected photographs to a DTM, an acceptable realistic representation can be obtained (see Fig. 1). Figure 2 shows a diagram with the elements involved in a TVS development. First, the orthophotos and the terrain spatial distribution data must be pre-treated, and the results are the data input to the graphic engine (case a) or to the Web3D viewer (case b). In this latter case, it can be seen that it is necessary to use Java applets, independent of the visualization, which provide the system with the capability of interaction with the user. In this paper, Sect. 4 is devoted to the basic steps for a TVS implementation based on VRML, whereas Sect. 5 deals with a development based on a graphic engine. 3 Web3D technologies One of the possible ways to implement a TVS consists in using Web3D technologies. The use of any of the available Web3D technologies permits to develop a 3D environment that can be shared on Internet.
Virtual representation of terrain through the web with VRML-Web3D and graphic libraries
127
Fig. 1 Creation of a 3D terrain model from a DTEM and a orthophotograph
ViewPoint, etc. However, to use an open standard presents important advantages. For instance, the specifications and documentation are well known, and there are all kinds of applications that support these standards. Next paragraphs briefly analyze the available standards, their main characteristics, and their advantages and disadvantages. 3.1 VMRL VRML is an archive format that permits the creation of interactive 3D objects and environments. The standard VRML was created and developed by the VRML Consortium, in principle a non-profit-making organization exclusively aimed at the development and promotion of VRML as a standard 3D system on Internet. VRML appeared in 1994 as the first officially recognized technology for the creation, distribution and representation of 3D elements on Internet by the ISO (International Standards Organization). VRML was designed to cover the following basic requirements [3]:
Fig. 2 Virtual Terrain Visualization Systems: a with Web3D viewers b with graphic engine
The term ‘Web3D’ refers to any programming language, protocol, archive format or technology that may be used for creating or presenting interactive 3D environments on Internet. Among these languages, used to program virtual reality, VRML (Virtual Reality Modeling Language), Java3D and X3D (Extensible 3D) are open standards. There are also a large number of proprietary-level solutions that satisfy the specific needs of the customers, generally aimed at electronic trade and entertainment purposes, such as Cult 3D, Pulse 3D,
(i) To make possible the development of programs to create, publish, and maintain VRML archives, as well as programs that can import and export VRML and other 3D graphic formats. (ii) To provide the capacity to use, combine, and re-use 3D objects in the same VRML environment. (iii) To incorporate the capacity to create new types of objects that have not been defined as part of VRML. (iv) To provide the possibility of being used in a wide variety of systems available on the market. (v) To emphasize the importance of interactive functioning in a wide variety of existing applications. (vi) To allow the creation of 3D environments at any scale or size.
123
128
E. Martínez et al.
VRML is a hierarchic language of marks that uses nodes, events and fields to model static or dynamic virtual realities: – Nodes are used to represent particular instances of the 54 primitives of the language. Instances are defined with a collection of fields that contain values of the basic attributes of the primitive form. – Fields are attributes that define the behaviour of the primitive forms. There are special fields (EventIn and Event Out) that allow the sending and reception of events to other fields. With these special fields and the command ROUTE, the flow of events can be controlled, directing the effect of one action among other multiple objects in order to animate a scene or simply to pass information to any of these objects. 3.2 X3D X3D is an open standard XML (eXtensible Markup Language), a 3D archive format that permits the creation and transmission of 3D data between different applications, especially web applications. Its principal characteristics are: (i) X3D is integrated in XML; this represents a basic step to achieve a correct integration in: – Web services. – Distributed networks. – Multiplatform systems and transference of archive and data among applications. (ii) X3D is modular; this allows the creation of a lighter 3D kernel, adjusted to the needs of developers. (iii) X3D is extensible; this allows adding components to provide more functions, in order to satisfy the market demands. (iv) X3D is shaped; this means that different appropriate extension groups can be chosen according to the specific needs of each application. (v) X3D is compatible with VRML; this implies that the development, the content and the base of VRML97 is maintained. X3D, instead of being limited to a single static wide specification—as in VRML that requires total adoption to achieve compatibility with X3D—has been designed with an structure based on components that give support for the creation of different profiles, which can be individually used. These components can be independently extended or modified, adding new levels or new components with new characteristics. Thanks to this structure, the advances in X3D specification are faster and the development of one area does not delay the evolution of the global specification.
123
3.3 Java3D Java3DTM API is a set of classes to create applications and applets with 3D elements [40]. It offers to developers the possibility of managing 3D complex geometries. The main advantage that this application programming interface (API) presents against other 3D programming environments is that it allows the creation of 3D graphic applications, independently of the type of system. It forms part of API JavaMedia. Therefore, it can make use of the versatility of Java language, and it can support a great number of formats, including VRML, CAD, etc. Java3D has a set of high class interfaces and libraries, which make good use of the high speed on graphic loading of many graphic cards. The calls to Java3D methods are converted into Open GL or Direct 3D functions. Though either conceptually or officially Java3D form part of API JMF, it has libraries that are installed independently of JMF. Despite Java3D does not directly support each possible 3D necessity, it permits a compatible implementation with Java code; in other cases, VRML loaders are available. They translate files from this format to appropriate objects of Java3D, which are visualized by means of an applet. Java3D provides a high-level programming interface based on the object-oriented paradigm. This fact implies some advantages such as to obtain a more powerful, faster, and simpler development of applications. The programming of 3D applications is based on ‘scene graph models’, which connect separated models with a treelike structure, including geometric data, attributes, and visualization information. These graphs give a global description of the scene, also known as ‘virtual universe’ [38]. This permits us to focus on geometric objects instead of on the low level triangles existing in the scene. 3.4 Comparisons X3D takes the work carried out by VRML97 and it tackles matters that have not been specifically treated so far. From the VRML basis taken as premise, X3D provides more flexibility than VRML. The main change is the total rewriting of the specifications in three different chapters, regarding: abstract concepts, file formats, and ways to access to the programming language. Other modifications provide a greater precision in illumination and event models and they also rename some fields in order to constitute a solider standard. The most important changes are: (i) Expansion of the graphic capacities. (ii) A revised and unified model of programming of applications.
Virtual representation of terrain through the web with VRML-Web3D and graphic libraries
(iii) Multiple file coding to describe the same abstract model, including XML. (iv) Modular structure that permits ranges of adoption levels and support for the different kinds of market. (v) Expansion of the specification structure. The X3D scene graphics, the core of any X3D application, are identical to the VRML97 scene graphics. The original design of VRML graphic structure and its node types are based on already existing technology for interactive graphics. The changes initially introduced in X3D aimed at incorporating the advances in commercial hardware by means of the introduction of new nodes and types of fields for data. Later, a single unified API was developed for X3D; this means an important difference from VRML97, which had a scripting internal API apart from the external API. The X3D unified API simplifies and solves many of the problems found in VRML97, as the result of a more robust implementation. X3D supports multiple codification archives, such as VRML97 and XML, or compressed binary (being developed at present). It uses a modular structure that provides greater extensibility and flexibility. The great majority of these applications neither need the full power of X3D nor the support for all its platforms and its functionalities defined in the specification. One of the advantages of X3D is that it is organized in components that can be used for the implementation of a defined platform or specific market. For that purpose, X3D includes the concept of profiles. They are a predefined collection of components generally used in certain applications and platforms, or in scenarios like the geometric interchange between design tools. Unlike VRML97, which requires total support from the implementation, X3D allows a support for each particular need. The mechanism of X3D components also permits the companies to implement their own extensions following a rigorous set of rules. Furthermore, X3D specification has been restructured in order to allow a greater flexibility in the life cycle of this standard, which is adjusted to its own evolution. The standard X3D is divided into three different specifications that permit ISO to achieve the adaptations of the concrete parts of the specification and their distribution in time. One of the main differences between VRML/X3D and Java3D, at a conceptual level, is that Java3D is defined as a low-level 3D-scene programming language. This means that the creation of 3D objects in Java3D does not only require the 3D element building, but also the definition of all the aspects related to the visualization and control of the environment capabilities. For example, for the creation of the simplest scenes, the Java3D code is notably larger than the necessary code in VRML/X3D. On the other hand, the control of the different elements in the system is more powerful and natural in Java3D. This does not mean that it is not possible to control a ‘virtual universe’ in
129
VRML to include user interaction, but that it is more complex. VRML has been the favourite of most Web 3D GIS researchers for over fifteen years because it is cheap, it can provide middle-quality interactive visualization, and it has high compatibility with Java applets [43]. However, recently a growing number of engineers in the graphics and design communities are using Java3D technology [23]. Because of its control power, it may be interesting to use Java3D as a VRML/X3D viewer in a TVS [26,34]. It is only necessary to use some of the VRML/X3D loaders developed for Java3D. At present, the Web3D Consortium is developing under GNU LGPL (Lesser General Public License), Xj3D as a tool— completely written in Java—to show VRML and X3D contents. The main advantages of using Java3D as a VRML/X3D viewer is its execution capability in different platforms and the fact that the final user is released of installing specific VRML/X3D plug-ins for the browser. In contrast, it must be considered the loss of speed and performance when using by Java3D vs. other VRML/X3D viewers developed in C/C++ [7] and vs. viewers that directly use Direct 3D or OpenGL [36]. Whichever viewer used, it must be taken into account that it is necessary to choose between internal or external programming within the VRML/X3D code. This choice is subject to the VRML/X3D implementation specification chosen by the programmer of the VRML/X3D viewer. For instance, at the level of External Authoring Interface (EAI) implementation, some VRML viewers, like CosmoPlayerTM, are based on Sun’s Microsystem Java Virtual Machine, and others, like BS Contact, are based on the version of Microsoft. 4 Use of VRML for the implementation of a TVS 4.1 Selection of the VRML viewer The first decision to make in a TVS implementation is to choose a VRML viewer, which must be capable of supporting and managing the great amount of data to visualize with a satisfactory performance. It is important to be very clear about this issue in order to achieve the best possible results according to the needs of the specific application to develop. In the list of Web3D viewers available on the market at present, we can specially remark, among others, those represented in the Table 1. Regarding their technological characteristics, we can distinguish between those viewers based on the use of a VRML/X3D plug-in in the browser—first column in Table 1—and those viewers that use Java applets—second column in Table 1. Furthermore, we can find different nonstandard format solutions that use their own technologies and file formats to store virtual environments. Although these non-standard format solutions can be better adjusted to the specific needs of a particular application at a given moment, they lack the advantage to work on an open standard that is
123
130
E. Martínez et al. Table 2 Comparison of performances between Java and C++ [35]
Table 1 Web3D viewers VRML/X3D
Non-standard format
Elements Used
Comparison with C++ (%)
C++ (no 3D)
0
Plug-in
Java
CosmoPlayer
AppletXj3D
Exel
Pure Java (no 3D)
54
Cortona
WireFusion
ViewPoint Media Player
Mixed Java/C++ (no 3D)
22.5
BS Contact
3DzzD
Adobe Atmosphere
C++ (with 3D)
0
Octaga
BS Contact J
Deep View
Pure Java (with 3D)
92.4
Flux
Shout 3D
Emma 3D
Mixed Java/C++ (with 3D)
32
FreeWRL
blaxxun Contact3D
Cult 3D
OpenVRML Venues OpenWorlds
universally recognized. So, they are subject to the decisions of the company proprietary of that format and solution. However, the use of a system based on an open standard allow us to port our own virtual environment to other different developments that also support the standard. For instance, Viewpoint Media Player uses a file format based on XML, and includes the interaction capability through the use of scripting—continuous lines of interpreted commands. Scripting vs. VRML presents a similar capability to interact directly with the environment in terms of execution time. On communicating with the Viewpoint Media Player plug-in from an HTML page, the possibility of using either JavaScript or Flash may be taken into consideration. Adobe Atmosphere and Deep ViewT M are different applications mainly used by Adobe to give to its PDF documents the possibility to include 3D contents. Adobe stopped the development of Adobe Atmosphere in December 2004, and presently it uses the Deep View technology developed by HighHemisphere. In this case, Universal 3D (U3D) file format is used. Emma 3D is an open source development based on Ogre3D graphic engine and uses an archive format similar to VRML. Cult3D allows the visualization of models imported directly from 3D Studio and other formats, as well as basic animation and interaction with the scene. For example, if we use CosmoPlayerTM as a viewer, we must take into account that it is old software; that implies that it cannot make good use of the graphic capabilities of new 3D graphic cards, and it make mainly the rendering by using software instead of hardware. On the other hand, if we use Xj3D, as well as any other viewer based on applets, we must remember that we use a viewer running in Java. Therefore, we must have the Java Virtual Machine (JVM) from Sun Microsystem installed and, according to the particular viewer, we may also need the Java3D library. In this case, to use the Java3D library allows us to accede to the graphic capabilities of 3D graphics cards available nowadays. However, using JVM involves certain declines in the performance of the application, since it is an interpreted programming language [2]—or semi-interpreted
123
language because a pre-compilation is carried out at bytecode level. In Table 2, a comparison can be observed about the loss of performance and speed of Java3D—pure Java (with 3D) in Table 2—against other VRML/X3D developed in C/C++ and directly using Direct 3D or OpenGL—C++ (with 3D) in Table 2. Another important aspect on choosing a viewer is to know on which platforms it can run (see Table 3), and then, which is the possible range of users having access to the application. Let us recall here that a viewer developed in Java is multiplatform and requires the JVM of Sun Microsystem. As commented in the first Section of this paper, our research group has developed a virtual TVS of La Rioja that will be used to illustrate the different stages of the process of development. In the decision-making process of choosing a viewer, the use of proprietary solutions was discarded in order to make good use of the advantages of an open standard such as VRML. As previously shown, VRML viewers can be classified into two main groups according to the technology employed: those that make use of JVM and those that incorporate plug-ins for the browser by means of ActiveX. The principal disadvantage that the former group presents against the latter one— applications compiled at machine-code level—is the loss of performance and speed [41]. This is the reason for discarding the use of any VRML viewer developed in Java; in general the specific needs of a TVS demands mainly high performance in refresh rates of the visualization (frames per second, FPS) and in memory use. Finally, once the capability of the remaining viewers to execute our developed particular application was tested, we decided to use the Bitmanagement Software viewer (BS Contact). At present, Bitmanagement Software and Octaga develop the leading viewers for the visualization of Web3D VRML/X3D technologies. The other viewers are a step behind as regards performance and updating on the development of new standards such as X3D. 4.2 The 3D model creation Once the different available Web3D technologies have been analyzed and one has been selected, as well as the necessary Web3D viewer, we have to determine the specific needs of the system that we want to implement. In this stage, the
Virtual representation of terrain through the web with VRML-Web3D and graphic libraries Table 3 Summary of the running capability in different platforms
131
VRML Viewer
Windows
Pocket PC
Linux
Mac OS
BS Contact
X
X
–
–
Cortona
X
–
–
X
Octaga
X
–
X
–
Flux
X
–
–
–
FreeWRL
–
–
X
X
CosmoPlayer
X
–
–
–
OpenVRML
X
–
X
X
Venues
X
–
–
–
OpenWorlds
X
–
–
–
Fig. 3 Division in zones of the surface to be visualized (116 × 75 Km). Each big rectangle represents a different zone
first step to develop the 3D TVS is to prepare a DTEM. In order to use this model, it is necessary to obtain the terrain heights corresponding to each pair of coordinates (X,Y) in the specific area that is to be visualized (Fig. 3). Nowadays, there is the possibility of knowing free the height of any point on Earth with a resolution of approximately 1 km. This is possible thanks to files such as GTOPO30 (Global Topographic Data horizontal grid spacing of 30 arc s) which provides a global digital elevation model of the US. Geological Survey’s Center (USGS) for Earth Resources Observation and Science (EROS). Without any doubt this is a highly useful tool, but they do not reach the desired precision for our TVS of La Rioja; so it was necessary to
resort to other local databases with higher resolution. In this case, as a starting point for the generation of the DTEM, a database with a 5-m spatial resolution was used. This database is in dBASE format and occupies several Gigabytes. In order to work with it, it was necessary to create a program that allowed consulting automatically through coordinates X and Y, represented in Universal Transverse Mercator projection (UTM) [32]. So, it was possible to sequence the process of generation of the grid on the terrain [6]. For this purpose, a program using PERL was created, which permitted covering the whole area, a total surface of more than 5.000 Km2 , and extracting the corresponding height coordinates. Although the program worked correctly, the consulting process was too slow since the different databases used were not correctly
123
132
indexed. In order to solve this problem we had to resort to a program in C++ Builder that makes the automatization of the indexation of the different databases. Subsequently, another specific application was necessary to choose the step of the grid and the area from where the data would be extracted. Once we obtained the height of each one of the desired coordinates, the following step is to classify the resulting information into an appropriate structure for its subsequent treating and processing. In our exemplary application, it can be noted in Fig. 5 that the region of La Rioja (Spain) was divided into different Zones with the aim of facilitating dynamic up-loading and down-loading according to the relative position of the observer/user. It was decided to build a dot-matrix structure totally adaptable to the step of the grid terrain at any moment for each zone. From this point, different tests must be carried out to adjust the size of the grid step to the specific needs of each application. In our TVS of La Rioja, we are concerned with a terrain visualization application in which a flight at a determined height is simulated; then an excessive precision is not required, as it is not going to provide anything visually important for the observer [1]. So finally, a compromise was reached for obtaining a satisfactory resolution fidelity, a required level of detail, and an admissible visualization refresh rate (the previously mentioned FPS): the value of 100 m grid step was selected. This value is more than sufficient to maintain an acceptable realism in a topographic environment, and even provides a fluid navigation. 4.3 Texture treatment The next step to achieve a realistic TVS is to map textures on the DTEM by means of orthophotographs obtained from aerial photographs [11,22]. Moreover, some treatments must be applied to the orthophotographs before mapping them, in order to optimize the implementation. For example, in our TVS of La Rioja, the orthophotos were obtained from the Autonomous Government of La Rioja, in JPG format, covering 10 Km2 of surface everyone. When carrying out a simulation of a VRML environment, it is necessary that the model files and texture files are not excessively large. That is the reason why each scene is stored in dot-matrix file, which cover an extension of only 1 Km2 . Therefore, the texture/orthophotographs have to be divided into partitions. A specific C++ program was employed to obtain this partitions. This application allows the user to define on the orthophotos some parameters, such as their origin and destination directories, their new names once they are partitioned, and new size. It considers their original size in case of being necessary to use data from some of them. Another treatment required is to adjust the optimum resolution of the textures for its further visualization during the
123
E. Martínez et al.
simulation. In order to find this optimum resolution, some tests were carried out from 0.5 m/pixel up to 4.0 m/pixel. Finally, it was proved that using resolutions lower than 2 m/pixel does not really provide a more realistic scene, due to the texture treatment that the different viewers carry out. Furthermore, to use high resolution textures implies that the files are heavier, more work for the viewers, and a lower visualization refresh rate (FPS). With all these issues in mind, we opted for 2 m/pixel as an appropriate texture resolution for our particular application. Another important aspect in order to accelerate the simulation is the inclusion of levels of detail [5,33], so that it is possible to lighten the viewer load without losing realism or quality for the observer user. The level of detail was established with the use of different resolution textures depending on the distance from the observer to them. (i) From 0 to 1,500 m: 2 m/pixel resolution. (ii) From 1,500 to 5,000 m: 4 m/pixel resolution. (iii) From 5,000 m to eye-sight reach: without texture and only the net-meshing is observed. Another noteworthy treatment of the orthophotographs is their reference coordinates. The orthophotographs are represented in UTM (see Fig. 4a) and they have to be adjusted to the coordinate system used in the VRML simulation (see Fig. 4b). For that reason, it is necessary to make a 180◦ clockwise turn of the orthophotographs with a software application (for instance, it is sufficient to use any photo-editor application). In this way, orthophotograph UTM coordinate system and VRML environment system fit one another perfectly. Once the texture files are prepared, the graphic engine or the web3D viewer can read them for a realistic visualization. 4.4 Tools for implementing the user interaction A main question that appears at this point is: how the analyzed solutions improve interactive engineering? The paper shows different solutions, and compares them based on developed
Fig. 4 Orthophotograph reference system
Virtual representation of terrain through the web with VRML-Web3D and graphic libraries
133
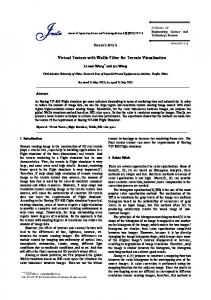
Fig. 5 External applets for interaction with the user
real applications, which allow us to interact with the terrain model at the level that we need, because all the steps that are needed to add any interaction utility are defined. For instance, in the developed applications just some interactive utilities have been developed, such as real accelerations and speeds, collisions, noise and image special effects, etc. but any other can be developed by any of the proposed techniques with really low programming effort. All this is possible because of the 3D model, witch is the core of all the applications and their interactive utilities. What provides VRML with the capability of implementing the user interaction is the JavaScript Code (usually denominated VRMLScript) and the Java code. On the one hand writing VRMLScript code requires the incorporation of different interaction elements within the VRML virtual scene; on the other hand it is possible to interact with the scene from some external applets with Java code. Thus, the programmer is completely free to create his own user interface with Java libraries and to connect with the virtual scene with the EAI library [16,39,42]. In Fig. 5, the different applets that have been developed for our exemplary application are shown:
(i) UTM Coordinates: this applet shows at any time the position of the user in UTM coordinates. (ii) Orientation: with this element, the user can know the angle from where he is watching. (iii) Movement: this panel permits to change rapidly the way we move in the 3D scene (walking, sliding, inspecting, flying, jumping, panoramic view, Gamelike view). (iv) Sound: this application allows to activate or deactivate the background sound.
Fig. 6 Screen capture of the application at an initial moment and FPS
(v) Distances: with this applet, the zenith view and measure distances in two or three dimensions can be activated. (vi) Surfaces: the option to measure the surface defined with a series of points pointed out in the scene can be used. (vii) Exaggeration: this applet permits to increase the height, exaggerating it in order to watch the size of the different heights increased. (viii) Joystick: it allows to activate or deactivate the navigation or the scene control by means of a Joystick added to the computer. (ix) Map: this applet includes a map of the terrain and shows us at any moment the position and orientation of the user. Besides, it permits us to move directly to any point on the map simply by clicking on it.
123
134
E. Martínez et al.
Fig. 7 User interface
Fig. 8 Example of the incorporation of external geometries
5 A graphic engine for a TVS 5.1 Open source libraries for 3D visualization An alternative solution to the Web3D viewers for the TVS performance is to develop a program known as graphic engine. It executes graphic routines by calling methods from
123
specialized libraries, like Open inventor TM, Coin3D, or OpenSceneGraph, among others. Let us focus on this latter mentioned library to explain some of their common characteristics. OpenSceneGraph (OSG) is a recently-developed graphic library which incorporates the different primitive basic concepts of OpenGL [36]. This library uses the programming language C++, because it is independent of the
Virtual representation of terrain through the web with VRML-Web3D and graphic libraries
platform and open source. Among the possible uses of this library we find simulations, scientific visualizations, virtual engineering and game development. OpenSceneGraph uses scene graph techniques to contain all the information regarding the scene generated. A scene graph is a data structure which permits the creation of a scene hierarchic structure, keeping the father–son connections among the different elements. For example, variations of position and orientation in the father node affect son nodes; thus, an arm robot with several joints can be created, with each piece dependent on the previous one, and simply applying movement to the initial piece; the rest of the dependent pieces will automatically move according to the defined structure. Another important father–son relationship exploited by the scene graph techniques is the possibility of defining enveloping volumes, which gather close elements. Thus, during the process of rejection of the elements that will be represented on screen, it is not necessary to analyze the children of a node father already rejected. Although the library is still under development at present, it is being employed by different users in research and commercial applications. There are even other open source developments, which extend and give support to the capabilities of OpenSceneGraph, such as OpenProducer or VT Jugger, for instance. OpenProducer is a library that permits the treatment of different current representation systems and interaction devices. Although there are other libraries providing this support, OpenProducer offers the advantage of being an open source development and it allows working with the OpenScreneGraph library. VR Juggler is a technology that supplies necessary tools for the development of virtual reality applications. It constitutes a virtual platform for the development of applications that are applicable to nearly all the virtual reality systems (Fig. 6). 5.2 Graphic engine development Once the graphic library is selected, the graphic engine consults the 3D model; so, it must be optimized for a satisfactorily fast terrain visualization. At software level, the way to deal with this matter is to maintain at any time a similar amount of information (textures and DTM), which allows a fluid data management. For this purpose, let us resort to a dynamic up-loading and down-loading of the scene according to the position and direction of the user at each moment. This process is carried out with a database that paginates the different scene areas and allows us to decide which parts are necessary to bear in mind at each moment. At a theoretical level, the database limit is not defined, but in practice, the larger the size, the less performance, and the dynamic up-loading and down-loading is affected. That is the reason why a database restructuring was carried out in our TVS of La Rioja, regarding communities and provinces.
135
The restructuring consists in searching for a way to limit the database size to the specific needs at each moment according to the zone where the user goes. In this way, it was possible to maintain a more or less constant loading process with a reasonable order for a desktop PC with the following minimum characteristics: Pentium 4 1,7 GHz, 80 GB ATA 100 Hard-Drive, 512 Mb DDRAM, Ati Rage 128 Pro II (Fig. 7).
6 Conclusions and future work In this article we have set out the main steps to be followed for the development of an application for terrain visualization. First, the basic characteristics of a TVS and a diagram of the development process have been presented. Then, a brief study of the different applicable Web3D technologies (VRML, X3D, or Java3D) has been included. With this base, the different necessary steps to realize a TVS based on VRML have been detailed, from the choice of the viewer to the incorporation of external tools in Java for the interaction with the user. Aspects such as DTEM creation and the inclusion of photorealistic textures to the model have been also explained. From the aforementioned, it can be deduced that the use of VRML for the creation of terrain visualization is viable, but always at the expense of depending on an external element that takes over the scene visualization, on which neither real control exists, nor its code is known, nor its program can be modified. In order to overcome these limitations, the development of a specific graphic engine by means of the use of open source libraries have been proposed. To achieve this aim, several available open source graphic libraries and their basic functioning characteristics have been analyzed. Finally, the steps followed in the implementation of a TVS by means of OSG library have been detailed. Several tips and codes are also involved in this paper to illustrate some stages in the development process. One of the potential capabilities of the developed system, which may be implemented in the future, is to include different 3D geometries, with the final purpose of facilitating aspects such as management, distribution and planning of the terrain, as a further onward step in geographical information systems [32]. One practical example may be the inclusion of tracing of roads in the design stage (see Fig. 8). The starting point would be the road design maps, in this particular case, or any other element on which one may be working (canalization, electricity posts and lines, railways and other forms of communication networks, etc.). From these graphic maps a previous treatment should be carried out, with any of the 3D design tools that exist on the market (3D Studio, Mayer, Blender, etc). Acknowledgments To the Autonomous Government of La Rioja, Ministry of Tourism, Natural Environment and Terrain Policy, for making available to us digital orthophotographs and terrain digital models,
123
136 which enabled us to develop this simulation. To GER (Grupo Eólicas Riojanas) for the partial financing of this project and for the interest shown in applying simulation in its own specific field of activity.
References 1. Ayeni, O.O.: Optimum sampling for digital terrain models: a trend towards automation. Photogramm. Eng. Remote Sens. 48(11), 1687–1694 (1982) 2. Barr, R., Haas, Z.J., Renesse, R.van : JiST: an efficient approach to simulation using virtual machines. Softw. Pract. Exp. 35(6), 540–576 (2005) 3. Bell, G., Parisi, A., Pesce, M.: The Virtual Reality Modeling Language: version 1.0 Specification. Technical Inform. (1995) 4. Bernhardt Saini-Eidukata, B., Schwerta, D.P., Slator, B.M.: Geology explorer: virtual geologic mapping and interpretation. Comput. Geosci. 28(10), 1167–1176 (2002) 5. Blow, J.: Terrain rendering at high levels of detail. In: Proceedings of Games Developers Conferences, San Jose, California (2000) 6. Bradley, J.: An Efficient Modularized Database Structure for a High-resolution Column-gridded Mars Global Terrain Database. Softw. Pract. Exp. 29(5), 437–456 (1999) 7. Burns, A., Wellings, A.J.: Real-time Systems and Programming Languages. Addison–Wesley, Reading (2001) 8. Döllner, J., Baumman, K., Hinrichs, K.: Texturing techniques for terrain visualization. In: Proceedings of Conference on Visualization’00, pp. 227–234. Los Alamitos, CA, USA (2000) 9. Duke, D.J., Brodlie, K.W., Duce, D.A., Herman, I.: Do you see what i mean? IEEE Comput. Graph. Appl. 25(3), 6–9 (2005) 10. Ellul, C., Haklay, M.: Requirements for Topology in 3D GIS. Trans. GIS 10(2), 157–175 (2006) 11. Ewiak, I., Kaczynski, R.: True ortho-sat vs. aerial. GEO: Connexion 5(5), 30 (2006) 12. Fairbairn, D., Parsley, S.: The Use of VRML for cartographic presentation. Comput. Geosci. 23(4), 475–481 (1997) 13. Fencík, R, Vajsáblová, M, Vaníková, E.: Comparison of interpolating methods of creation of DEM. In: Proceedings of 16th Cartographic conference, pp. 77–87. Brno, Czech Republic 14. Geroimenko, V., Chen, C.: Visualizing Information Using SVG and X3D, XML-based technologies for the XML-based Web. Springer, London (2005) 15. Gittings, B.M.: Digital Elevation Data Catalogue. [04 January 2007] (1996) 16. Gosling, J., Joy, B., Steele, G.: The Java Language Specification. Addison–Wesley, Reading (1996) 17. Guedes, L.C., Gattass, M., Carvalho, P.C.P.: Real-time rendering of phototextured terrain height fields. In: Proceedings of SIBGRAPI 97, pp. 18–25. Campos de Jordao, SP, Brazil (1997) 18. Hay, R.J.: Visualisation and presentation of three dimensional geoscience information. In: Proceedings of 21st International Cartographic Conference, Durban, South Africa (2003) 19. Heckbert, P.S.: Survey of texture mapping. IEEE Comput. Graph. Appl. 6(11), 56–67 (1986) 20. Hirtz, P., Hoffmann, H., Nuesch, D.: Interactive 3D landscape visualization: improved realism through the use of remote sensing data and geoinformation. In: Proceedings of Computer Graphics International, pp. 101–108. Cannmore, Alberta, Canada (1999) 21. Hirtz, P., Hoffmann, H., Nuesch, D.: Evaluating X3D for use in software visualization. In: Proceedings of ACM Symposium on Software Visualization, pp. 161–162. Brighton, UK (2006)
123
E. Martínez et al. 22. Höhle, J.: Experiences with the production of digital orthophotos. Photogramm. Eng. Remote Sens. 62(10), 1189–1194 (1996) 23. Huang, B.: Web-based dynamic and interactive environmental visualization. Comput. Env. Urban Syst. 27(6), 623–636 (2003) 24. Huang, B., Lin, H.: GeoVR: a web-based tool for virtual reality presentation from 2D GIS data. Comput. Geosci. 25(10), 1167– 1175 (1999) 25. Huang, B., Lin, H.: A Java/CGI approach to developing a geographic virtual reality toolkit on the Internet. Comput. Geosci. 28(1), 13–19 (2002) 26. Jin, B., Bian, F., Zuo, X., Wang, F.: Study on visualization of virtual city model based on Internet. Geo-Spatial Inf. Sci. 8(2), 115– 121 (2005) 27. Kersting, O., Dollner, J.: Interactive 3D visualization of vector data in GIS. In: Proceedings of tenth ACM International Symposium on Advances in Geographic Information Systems, pp. 107–112. McLean, VA (near Washington, DC), USA (2002) 28. Kreuseler, M.: Visualization of geographically related multidimensional data in virtual 3D scenes. Comput. Geosci. 26(1), 101–108 (2000) 29. Kumler, M.P.: An intensive comparison of triangulated irregular networks (TINs) and digital elevation models (DEMs). Cartographica 31(2), 1–99 (1994) 30. Lindstrom, P., Pascucci, V.: Visualization of large terrains made easy. In: Proceedings of IEEE Visualization, pp. 363–371. IEEE, Piscataway, NJ (2001) 31. Lin, H., Gong, J., Wang, F.: Web-based three-dimensional georeferenced visualization. Comput. Geosci. 25(10), 1177–1185 (1999) 32. Longley, P.A., Goodchild, M.F., Rhind, D.W.: Geographic Information Systems and Science. Wiley, Chichester (2001) 33. Luebke, D.P. et al.: Level of Detail for 3D Graphics: application and Theory. Terrain Level of detail. Morgan Kaufmann, San Francisco, CA (2003) 34. Lukas, S., Bailey, M.: FlySanDiego: a web-aware 3D interactive regional information system. In: Proceedings of SPIE—The International Society for Optical Engineering, pp. 368–378. San Diego, CA, USA (2002) 35. Marner, J.: Evaluating Java for Game Development (2002) 36. Mason, W. et al.: OpenGL Programming Guide. Addison–Wesley, Reading (1999) 37. Moore, K., Dykes, J., Wood, J.: Using Java to interact with georeferenced VRML within a virtual field course. Comput. Geosci. 25(10), 1125–1136 (1999) 38. Sowizral, H.A., Deering, M.F.: The Java 3D API and virtual reality. IEEE Comput. Graph. Appl. 19(3), 12–15 (1999) 39. Sowizral, H.A., Deering, M.F.: Virtual university three-dimension query system based on VRML and Java technology. Comput. Eng. 31(6), 173–175 (2005) 40. Sowizral, H., Rushforth, K., Deering, M.: The Java 3D API Specification. Addison–Wesley, Reading (1998) 41. Wellings, A.J.: Concurrent and Real-Time Programming in Java. Wiley, Chichester (2004) 42. Yu, C., Wu, M., Wu, H.: Combining Java with VRML worlds for web-based collaborative virtual environment. In: Proceedings of IEEE Networking, Sensing and Control, pp. 299–304. Tucson, Arizona, USA (2005) 43. Zhu, C., Tan, E.C., Chan, K.Y.: 3D Terrain visualization for Web GIS. In: Proceedings of Map Asia, Kuala. Lumpur, Malaysia (2003)