3 a x2. −1. 1 +. 1 + c1 + c2 + c3 + c4 + c5 + ¯. ,. 6 where denotes the gamma
function and the complex ... camera JVC TK-C921EG connected via an analog-to
-.
THE JOURNAL OF CHEMICAL PHYSICS 129, 185103 共2008兲
Viscoelasticity of entangled -phage DNA solutions Xiaoying Zhu, Binu Kundukad, and Johan R. C. van der Maarela兲 Biophysics and Complex Fluids Group, Department of Physics, National University of Singapore, 2 Science Drive 3, Singapore 117542, Singapore
共Received 3 June 2008; accepted 6 October 2008; published online 10 November 2008兲 The viscoelastic moduli of -phage DNA through the entanglement transition were obtained with particle tracking microrheology. With increasing frequency, the viscous loss modulus first increases, then levels off, and eventually increases again. Concurrently, the elastic storage modulus monotonously increases and eventually levels off to a constant high frequency plateau value. Once the DNA molecules become entangled at about ten times the overlap concentration, the elastic storage modulus becomes larger than the viscous loss modulus in an intermediate frequency range. The number of entanglements per chain is obtained from the plateau value of the elasticity modulus. The longest, global relaxation time pertaining to the motion of the DNA molecules is obtained from the low shear viscosity as well as from the lowest crossover frequency of the viscous loss and elastic storage moduli. The concentration dependencies of the low shear viscosity, the number of entanglements per chain, and the relaxation time agree with the relevant scaling laws for reptation dynamics of entangled polyelectrolytes in an excess of simple, low molecular weight salt with screened electrostatic interactions. © 2008 American Institute of Physics. 关DOI: 10.1063/1.3009249兴 I. INTRODUCTION
The dynamical properties of DNA have an impact on many biological processes such as transcription of the genome and the segregation of the intertwined sister chromatids during mitosis. At high concentration, DNA molecules become entangled, and they form a temporary dynamic network. Entanglements are topological constraints resulting from the fact that the DNA molecules cannot cross through each other. As a result of these entanglements, concentrated solutions of DNA have a complex viscoelasticity. The motion of the DNA molecules is strongly hindered by the presence of the neighboring DNA molecules, and the relaxation times may become very long. Polymer dynamics under entangled conditions can be described by the reptation model, in which the polymer is thought to move in a snakelike fashion along the axial line 共primitive path兲 of a tube formed by the entanglements.1 The reptation model gives specific scaling laws for the longest, global relaxation time, self-diffusion coefficient, high frequency limiting value of the elastic storage modulus, and the zero shear limit of the viscosity of neutral polymers in the entangled regime. For a polyelectrolyte in an excess of simple, low molecular weight salt with screened electrostatic interactions, the scaling laws are the same as for neutral polymers, albeit with different prefactors related to an ionic strength dependent persistence length and excluded volume.2 The viscoelastic properties of entangled DNA solutions have been reported in the literature before. Musti et al. reported the low shear viscosity and relaxation times of solutions of T2-DNA 共164 kbp, contour length of 56 m兲. It was shown that the reduced zero shear viscosity obeys the same a兲
Electronic mail:
[email protected].
0021-9606/2008/129共18兲/185103/6/$23.00
scaling law as the one for synthetic, linear polymers and that the entanglement concentration is 0.25 g of DNA/l. For solutions of 1 g of DNA/l, the relaxation times become very long on the order of 1000 s.3 For -phage DNA 共48.5 kbp, contour length of 16.3 m兲 similar scaling behavior of the zero shear viscosity was observed, but the relaxation times are two orders of magnitude shorter because of the lower molecular weight.4 Smith et al. showed that the selfdiffusion coefficient of -phage DNA follows the reptation prediction for concentrations exceeding 0.63 g/l.5 The viscous loss and the elastic storage moduli of polydisperse calfthymus DNA 共average molecular weight of 13 kbp兲 through the entanglement concentration were reported by Mason et al.6 For concentrations exceeding the entanglement concentration, the loss modulus is crossed by the storage modulus at a crossover frequency c and the storage modulus levels off at a limiting high frequency plateau value. A region of weak dependence of the steady state shear stress of T4DNA 共166 kbp兲 on the shear rate has been reported by Jary et al.7 The concentration dependence of the lower boundary frequency scales as the reciprocal tube renewal or disengagement time, whereas the upper boundary corresponds with the Rouse relaxation time of the entire DNA molecule within the tube. Although these previous investigations are important in their own right, a comprehensive characterization of the viscoelasticity of solutions of rigorously monodisperse DNA with increasing concentration through the entanglement transition in terms of the viscous loss and elastic storage moduli seems to be lacking. In the present contribution, we report the elastic storage and viscous loss moduli of -phage DNA dispersed in 10 mM tris/EDTA 共TE兲 buffer. We have employed particle tracking microrheology, which requires minute samples of no more than 15 l each.8 This methodological approach is
129, 185103-1
© 2008 American Institute of Physics
Downloaded 06 Jan 2011 to 137.132.123.69. Redistribution subject to AIP license or copyright; see http://jcp.aip.org/about/rights_and_permissions
185103-2
J. Chem. Phys. 129, 185103 共2008兲
Zhu, Kundukad, and van der Maarel
hence particularly promising for the investigation of biological samples of which only small quantities are available. The effect of DNA concentration through the critical entanglement concentration on the viscoelastic properties was systematically explored. We derive the number of entanglements per chain from the limiting high frequency plateau value of the elastic storage modulus. The longest, global relaxation time is obtained from the crossover frequency c for entangled solutions as well as from the ratio of the low shear viscosity increment and the high frequency elasticity modulus for all samples. Finally, the results for the viscosity increment, number of entanglements per chain, and the longest relaxation time are compared with the relevant scaling laws for reptation dynamics of salted polyelectrolytes. II. PARTICLE TRACKING MICRORHEOLOGY
The viscoelastic properties of the DNA solution are probed by monitoring the one-dimensional mean square displacement 具⌬x2共t兲典 over a time t of an embedded colloidal and spherical bead of radius a. We first assume that the structures of the fluid which give rise to the viscoelastic properties are much smaller than the size of the bead. The onesided, complex Fourier transform of the mean square displacement 具⌬x 共兲典 = ˜2
冕
⬁
dt exp共− it兲具⌬x 共t兲典 2
共1兲
0
is related to the elastic storage G⬘共兲 and viscous loss G⬙共兲 moduli of the medium through the generalized Stokes– Einstein equation G⬘共兲 + iG⬙共兲 =
k BT , ˜ 2共兲典 3ai具⌬x
共2兲
where kBT is the thermal energy.8 The generalized Stokes– Einstein equation is valid under the same conditions as the Stokes equation for the friction experienced by the bead, i.e., no slip boundary conditions on a sphere in an isotropic, incompressible fluid, and neglect of the sphere’s inertia. Furthermore, it is assumed that the Stokes drag for a viscous fluid may be extended to viscoelastic materials over all frequencies and that the fluid surrounding the bead can be treated as a continuum. The latter condition requires that the structures of the fluid, which give rise to the viscoelastic properties 共e.g., the mesh size or correlation length of the semidilute DNA solution兲, are much smaller than the size of the bead. In our range of concentrations, the mesh size is typically less than 100 nm and on the order of the DNA persistence length 共the bead size is in the range 1.0– 3.2 m兲.9 The effect of a depletion in DNA concentration in the interfacial layer surrounding the bead will be considered below. The formalism also requires no hydrodynamic interactions among the beads, so that individual beads need to be separated over sufficiently large distances. In order to evaluate the viscoelastic moduli, the onesided Fourier transform of the mean square displacement can be algebraically estimated by expanding ln具⌬x2共t兲典 around the value of ln具⌬x2共t⬘兲典 at t⬘ = −1, i.e., ln具⌬x2共−1兲典 in powers of ln t.10 Since in the double logarithmic representation
2Dt
(µm 2)
10 0
10 −1
10 −2
10 − 3 10
−1
10
0
t (s)
10
1
10
2
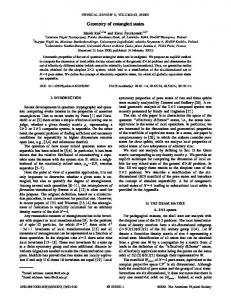
FIG. 1. 共Color兲 Mean square displacement 具⌬x2共t兲典 vs time t. The DNA concentrations are 0.8 g 共䊐兲, 0.6 g 共䉮兲, 0.4 g 共䊊兲, 0.3 g 共䉭兲, and 0.2 g 共〫兲 of DNA/l. The solid lines represent the diffusion behavior 具⌬x2共t兲典 = 2Dt with D the diffusion coefficient of the colloidal bead for long times. The dashed lines represent fourth order polynomial fits.
the mean square displacement shows some curvature 共see Fig. 1兲, we have carried the expansion up to and including third order in ln t, 具⌬x2共t兲典 ⬇ 具⌬x2共−1兲典共t兲␣+ ln t+␥ ln
2 t
.
共3兲
The frequency dependent coefficients are defined by the first, second, and third order derivatives
␣=
冉
冊
=
1 2 ln具⌬x2共t⬘兲典 , 2 ln t⬘2 t⬘=−1
␥=
1 3 ln具⌬x2共t⬘兲典 , 6 ln t⬘3 t⬘=−1
ln具⌬x2共t⬘兲典 , ln t⬘ t⬘=−1
冉 冉
冊 冊
共4兲
respectively. In the case of diffusive behavior ␣ = 1, because according to Einstein’s equation 具⌬x2共t兲典 = 2Dt with D being the diffusion coefficient of the bead. For fully elastic response with a constant mean square displacement, one obviously has ␣ = 0, so that 0 ⱕ ␣ ⱕ 1. The integral transform equation 共1兲 with the power series expansion equation 共3兲 for 具⌬x2共t兲典 cannot be solved in closed analytical form. However, since  and ␥ are small with respect to the leading term ␣, Eq. 共3兲 can be expanded in powers of  and ␥, 具⌬x2共t兲典 ⬇ 具⌬x2共−1兲典共t兲␣共1 +  ln2 t + ␥ ln3 t + 2/2 ln4 t + ␥ ln5 t + ␥2/2 ln6 t + ¯兲. 共5兲 We will retain the terms up to and including second order in  and ␥. The one-sided Fourier transform of the mean square displacement equation 共1兲 can now be evaluated in analytical form by transforming Eq. 共5兲 term by term 共higher order terms can also be calculated if desired兲. The complex viscoelastic modulus follows then from Eq. 共2兲 and takes the form
Downloaded 06 Jan 2011 to 137.132.123.69. Redistribution subject to AIP license or copyright; see http://jcp.aip.org/about/rights_and_permissions
185103-3
G共兲 =
J. Chem. Phys. 129, 185103 共2008兲
Entangled DNA solutions
kBT共cos共␣/2兲 + i sin共␣/2兲兲 , 3a具⌬x 共 兲典⌫共1 + ␣兲共1 + c1 + c2 + c3 + c4 + c5 + ¯兲 2
−1
where ⌫ denotes the gamma function and the 共complex兲 coefficients c1 through c5 are given in the Appendix. The latter coefficients are related to  and ␥, which describe the deviation from linearity of the mean square displacement in the double logarithmic representation. To lowest order, it is sufficient to include c1, which is proportional to the second order derivative . For the analysis of data, which show a strong deviation from linearity, it is necessary to include the higher order coefficients. Although the corresponding expressions are quite lengthy, they can be implemented without computational difficulties. III. EXPERIMENTAL SECTION A. Sample preparation
Bacteria -phage DNA was purchased from New England Biolabs, Ipswich, MA and used without further purification. Single stranded DNA with a base pair sequence complementary to the -phage DNA overhang was purchased from Sigma-Aldrich. As received from the manufacturer, the -phage DNA stock solution has a concentration of 0.5 g of DNA/l. The solvent is TE buffer, which is composed of 10 mM tris-HCl, pH 8.0, and 1 mM EDTA. Water was de-ionized and purified by a Millipore system and has a conductivity less than 1 ⫻ 10−6 ⍀−1 cm−1. The DNA stock solution was concentrated to a concentration of about 1 g of DNA/l by freeze drying and subsequently extensively dialyzed in microdialyzers against TE buffer. The DNA concentration of the stock solution was determined by ultraviolet spectrometry. A series of samples with DNA concentrations in the range 0.2–0.8 g/l was subsequently prepared by dilution of the stock solution with TE buffer. The samples were spiked with polystyrene microspheres 共Polysciences, Warrington, PA兲 of 0.99⫾ 0.03 m diameter with a final concentration of less than 0.1 wt %. In order to check a possible bead size dependence of the viscoelastic moduli, we have also done some experiments with a bead of 3.16⫾ 0.03 m diameter. For each particle tracking experiment, a droplet of solution was deposited on a microscopy slide and sealed with a coverslip separated by a 0.12 mm spacer. B. Particle tracking
Particle tracking experiments were carried out at ambient temperature 共296 K兲 with a Leica DM EP microscope equipped with a 50⫻ long working distance and 100⫻ oil immersion objectives. In order to minimize hydrodynamic interactions, care was taken that the imaged beads are separated by at least 20 bead diameters 共20 m兲. Furthermore, the height level of the focal plane was adjusted so that it is situated right between slide and coverslip with maximum separation. Video was collected with a charge coupled device camera 共JVC TK-C921EG兲 connected via an analog-to-
共6兲
digital video converter 共Canopus, ADVC55兲 to a computer. For each sample, at least ten movies with a total duration exceeding 100 min of at least ten different beads were recorded with a rate of 25 frames per second and stored on hard disk. The video was analyzed with MATLAB 共Natick, MA兲 using an AVI file reader and the particle trajectories were obtained with public domain tracking software 共http://physics.georgetown.edu/matlab/兲. All further data analysis was done with home developed software scripts written in MATLAB code. The pixel resolutions in the x and y directions were calibrated with the help of a metric ruler. We have checked our setup by measuring the diffusion of colloidal beads dispersed in a concentrated solution of glycerol as well as by monitoring immobilized beads adsorbed at a glass slide. IV. RESULTS AND DISCUSSION A. Mean square displacement
From the bead trajectories, the probability distributions for displacements in the x and y directions were extracted for a range of displacement times t. The minimum displacement time t = 40 ms is determined by the frame rate of the video camera. The maximum time is in principle unbound, but in practice it is set by the rheological properties of the sample because the particles eventually diffuse out of the field of view and/or they are subjected to long time coherent flow. For our samples, we found a practical upper limit of the displacement time of about 100 s. A Gaussian was fitted to both probability distributions by optimizing the mean square displacements. The mean square displacements in the two orthogonal directions were checked to be equal within experimental error, and we henceforth report the average value. Some typical results are displayed in Fig. 1. For the sake of clarity, we have not included the results pertaining to 0.7 and 0.5 g of DNA/l. The latter results fall perfectly between the marks set by the 0.8, 0.6, and 0.4 g of DNA/l solutions. Note that we use the symbol 具⌬x2共t兲典 to stress that we are referring to the mean square displacement in one dimension, albeit the experimental results are obtained by statistically averaging the widths of the distributions obtained in the x and y directions 共these widths are identical within experimental error because the fluid is isotropic兲. In the double logarithmic representation and with increasing time, the mean square displacement of a dispersed colloidal bead first increases, after which it levels off to a certain extent depending on the DNA concentration, and eventually increases again. For very long times, diffusive behavior is recovered with 具⌬x2共t兲典 proportional to the time t. The deviation from diffusive behavior for shorter times is typical of a viscoelastic, complex fluid. Due to temporary entanglements formed by the DNA molecules, the solution
Downloaded 06 Jan 2011 to 137.132.123.69. Redistribution subject to AIP license or copyright; see http://jcp.aip.org/about/rights_and_permissions
185103-4
J. Chem. Phys. 129, 185103 共2008兲
Zhu, Kundukad, and van der Maarel 10
0
G‘, G‘‘ (Pa)
τ−1 10
−1
10
−2
10
−3
ηω
10
−2
10
−1
10 ω (s−1 )
0
10
1
FIG. 2. 共Color兲 Elastic storage G⬘ 共open symbols兲 and viscous loss G⬙ 共closed symbols兲 vs frequency . The DNA concentrations are as in Fig. 1. The solid lines represent the low frequency limiting behavior G⬙ = with the low shear viscosity . The arrows denote the lowest crossover frequencies corresponding with the inverse relaxation times.
exhibits an elastic response at short times. As we will see shortly, the longest, global relaxation time of the -phage DNA molecules is on the order of a second. For longer times entanglements are relaxed, the molecules can move over their molecular dimensions, and the solution behaves as a viscous fluid. With increasing DNA concentration, the mean square displacement decreases and the range of times with a subdiffusive scaling exponent less than one becomes wider. These phenomena are obviously related to changes in the number of entanglements per chain, which are more conveniently discussed in terms of the viscous loss and the elastic storage moduli to be presented below. For a viscous fluid, the mean square displacement is given by Einstein’s law 具⌬x2共t兲典 = 2Dt with D being the diffusion coefficient. With the Stokes–Einstein equation D = kBT / 共6a兲, we can thus derive the low shear viscosity of the DNA solution from the limiting long-time diffusive behavior of the mean square displacement. The measured viscosity increments ⌬ = − s with respect to the one of the solvent s = 0.001 Pa s are displayed in Fig. 3共a兲. The viscosity increment increases by more than two orders of magnitude if the DNA concentration increases from 0.2 to 0.8 g/l. Furthermore, it follows a power law ⌬ ⯝ c3.93 pertaining to an entangled polyelectrolyte solution in an excess of simple salt and derived with a Flory exponent = 0.588.2,3 B. Viscoelastic moduli
The elastic storage and viscous loss moduli can be obtained from the mean square displacement according to Eq. 共6兲. For this purpose, it is also necessary to determine the derivatives ␣, , and ␥ as defined in Eq. 共4兲. We have obtained the values of ␣, , and ␥ by a fourth order polynomial fit to the data. The polynomial fits are also shown in Fig. 1, and they describe the smooth variation of the mean square displacements well. The resulting viscoelastic moduli are displayed in Fig. 2. The results for 0.7 and 0.5 g of DNA/l fall perfectly between the marks set by the 0.8, 0.6, and 0.4 g
of DNA/l solutions and are not shown. We have checked that the second order approximation in  and ␥ calculated with coefficients c1 through c5 gives results which are only slightly different than the ones obtained with a first order expansion with coefficients c1 and c2. It should be noted that we have derived the viscoelastic moduli based on the assumption that the DNA solution is homogeneous. In particular, we have neglected a depletion in DNA concentration in an interfacial region surrounding the bead with a thickness on the order of the mesh size. For concentrations in the range 0.03–0.4 g of -DNA/l, Chen et al. have quantified the submicron scale variation in the viscoelastic response by using one and two-point tracking microrheology.11 It was shown that the viscoelastic moduli, as measured by the single-particle method, are somewhat underestimated due to depletion. This effect becomes progressively less important with increasing DNA concentration 共smaller mesh size兲 and/or larger bead diameter. We have checked that the viscoelastic moduli of a solution with a concentration of 0.35 g of DNA/l, as obtained from the tracking of 1.0 as well as 3.2 m sized beads, are very close 共data not shown兲. This can be understood on the basis of the small values of the correlation length less than 100 nm for concentrations exceeding 0.3 g of DNA/l.9 It is possible to correct for the effect of depletion by using the shell model of Levine and Lubensky.12 We observed that the moduli obtained from the tracking of the 1.0 and 3.2 m sized beads collapse to single curves by assuming a layer of water surrounding the beads with a thickness of the correlation length. In principle, all our viscoelasticity data can be corrected according this procedure. We found that the correction does not result in a change in qualitative behavior of the viscoelastic response, including the scaling behavior of the low shear viscosity, the number of entanglements per chain, and the relaxation time. Furthermore, the correction becomes vanishingly small due to the decrease in correlation length to a value around the persistence length for higher DNA concentrations in the entangled regime. Under the present experimental conditions, the effect of depletion is hence relatively unimportant and is not further pursued. The low shear viscosity can be derived from the behavior of the viscous loss modulus at low frequencies. If the mean square displacement is given by 具⌬x2共t兲典 = 2Dt, an analytical calculation of the one-sided Fourier transform gives for the viscoelastic moduli G⬙ = and G⬘ = 0. As can be seen in Fig. 2, for low frequencies, G⬙ approaches the linear scaling . The fitted values of the low shear viscosity agree with those obtained above from the long time diffusive behavior of the mean square displacement. With increasing frequency, the viscous loss modulus first increases, then levels off a bit, and eventually increases again. Qualitatively similar behavior has been observed in the shear stress versus shear rate of T4-DNA at comparable concentrations.7 Concurrently, the elastic storage modulus monotonously increases and eventually levels off to a constant high frequency plateau value. For a concentration exceeding 0.3 g of DNA/l, the elastic storage modulus becomes larger than the viscous loss modulus in an intermediate frequency range. This transition concentration is about ten
Downloaded 06 Jan 2011 to 137.132.123.69. Redistribution subject to AIP license or copyright; see http://jcp.aip.org/about/rights_and_permissions
J. Chem. Phys. 129, 185103 共2008兲
Entangled DNA solutions
C. Entanglements and reptation dynamics
With increasing frequency, the elastic storage modulus increases and approaches a limiting plateau value G. The number of entanglements per chain can be derived from the ratio of G and the elasticity modulus pertaining to the 共hypothetical兲 nonentangled Rouse chain GR = kT evaluated at the same molecular density . The ratio G / GR is proportional to the number of segments per chain divided by the average number of segments between entanglements, so that the number of entanglements per chain is given by G / GR − 1.1,2,14 We have obtained G from the high frequency limiting values of the elastic storage moduli and the ratio G / GR is set out in Fig. 3共b兲. The experimental values can be considered as under limits because the elastic storage moduli might increase a bit for even higher frequencies outside our observation window. At low concentration, G / GR is around unity in agreement with nonentangled dynamics. For concentrations exceeding 0.3 g of DNA/l, G / GR increases and follows the scaling law for an entangled polyelectrolyte with
10 1 10
0
10
−1
10
1
(b)
(a)
(c) τ (s)
G/GR
times the overlap concentration from the dilute to the semidilute regime. From self-diffusion experiments of fluorescence labeled -phage DNA in TE buffer, the entanglement concentration was estimated to be around 0.6 g of DNA/l.5 As we will see shortly, the formation of entanglements for DNA concentrations exceeding, say 0.3 g/l can also be inferred from the high frequency limiting values of the elastic storage modulus 共as well as from the concentration scaling of the low shear viscosity increment and the longest relaxation time兲. The development of plateau elasticity for large frequencies and a crossing of the viscous loss by the elastic storage modulus at a crossover frequency c for concentrations exceeding a critical entanglement concentration have been reported before for calf thymus DNA of polydisperse length.6,13 The viscous loss modulus shows dispersion at two different frequency scales. One process is characterized by a relaxation time on the order of a second, which becomes longer with increasing concentration. This process is the reptation dynamics of the DNA molecules in the entangled solution. Its correlation time can be considered as an entanglement disengagement time or tube renewal time. For T2 or T4-DNA at comparable concentrations, the corresponding relaxation times are two orders of magnitude longer, in agreement with the higher molecular weight 共164 or 166 versus 48.5 kbp兲.3,7 The other process occurs at higher frequencies with a correlation time on the order of 0.1 s and is relatively insensitive to the DNA concentration. The high frequency dispersion is related to the Rouse dynamics of the entire DNA molecule inside the tube formed by the entanglements. Similar high frequency dispersion has been observed in the shear stress versus shear rate of T4-DNA.7 Unfortunately, the frame rate of our industrial video camera is not high enough to map out the Rouse dynamics at high frequencies. Accordingly, we do not further pursue the viscoelastic behavior at high frequencies, but we focus on the formation of the entanglements and reptation dynamics in the lower frequency range.
∆η (Pa s)
185103-5
10 0 c
10
−2
c
3.93
1.31
c 0
10
−1
c (g/l)
1.62
10
0
10 −1 10
c (g/l)
10
0
10−1 −1 10
c (g/l)
10
0
FIG. 3. 共a兲 Low shear viscosity increment ⌬ vs DNA concentration c. The solid line represents the scaling law for a salted and entangled polyelectrolyte ⌬ ⯝ c3.93. 共b兲 High frequency elasticity modulus divided by the Rouse modulus G / GR vs DNA concentration c. The solid line represents the scaling law of the number of segments per chain divided the average number of segments between entanglements N / Ne ⯝ c1.31. 共c兲 Relaxation time vs DNA concentration c. The open circles refer to the values obtained from the low shear viscosities, whereas the closed circles represent the reciprocal lowest crossover frequencies. The solid line represents the scaling law ⯝ c1.62.
screened electrostatics G / GR ⯝ c1.31 共 = 0.588兲.2,3 The number of entanglements per chain at a concentration of 0.8 g of DNA/l is about 7. For a sample of 2 g of -phage DNA/l, approximately 22 entanglements per chain has been reported in the literature based on bulk rheology measurements.15 The latter value agrees with our number of entanglements per chain, provided they are extrapolated to the relevant concentration according to c1.31 scaling. The longest, global relaxation time can be obtained from the lowest crossover frequency of the viscous loss and elastic storage moduli c = −1 indicated by the arrows in Fig. 2. The results are displayed in Fig. 3共c兲. As an alternative, can be derived from the increment in the low shear viscosity and the high frequency limiting value of the elastic storage modulus ⌬ = 2 / 12G.14 The corresponding results are also displayed in Fig. 3共c兲. The values of the relaxation times obtained with both procedures agree within experimental accuracy. Note that the crossover frequency is only observed for entangled solutions 共hence for concentrations exceeding 0.3 g of DNA/l兲, whereas the method based on the low shear viscosity is general and can also be used to derive the global relaxation of DNA molecules in the dilute and nonentangled semidilute regimes. The relaxation time increases by about an order of magnitude from 0.4 s for nonentangled DNA to about 4 s at the highest concentration in the entangled regime. Furthermore, the relaxation time follows the scaling law for reptation dynamics of a salted polyelectrolyte ⯝ c1.62 共 = 0.588兲.2,3 For concentrations below the entanglement concentration, we do not observe the transition to Rouse dynamics with a much weaker concentration dependence R ⯝ c0.31. For this purpose, the measurements need to be extended to lower values of the DNA concentration. V. CONCLUSIONS
We have obtained the viscoelastic moduli of -phage DNA through the entanglement transition with the help of particle tracking microrheology using minute samples of no more than 15 l each. With increasing frequency, the viscous loss modulus first increases, then levels off, and even-
Downloaded 06 Jan 2011 to 137.132.123.69. Redistribution subject to AIP license or copyright; see http://jcp.aip.org/about/rights_and_permissions
185103-6
J. Chem. Phys. 129, 185103 共2008兲
Zhu, Kundukad, and van der Maarel
tually increases again. Concurrently, the elastic storage modulus monotonously increases and eventually levels off to a constant high frequency plateau value. Once the DNA molecules become entangled at about ten times the overlap concentration, the elastic storage modulus becomes larger than the viscous loss modulus in an intermediate frequency range. The number of entanglements per chain is obtained from the plateau value of the elasticity modulus. We cover the range from the nonentangled, semidilute to the moderately entangled regime with about seven entanglements per chain. The longest, global relaxation time pertaining to the motion of the DNA molecules is obtained from the low shear viscosity as well as from the lowest crossover frequency of the viscous loss and elastic storage moduli. In the entangled regime, both relaxation times agree and can be identified with the entanglement disengagement time or tube renewal time. The concentration dependencies of the low shear viscosity, the number of entanglements per chain, and the relaxation time agree with the relevant scaling laws for reptation dynamics of entangled polyelectrolytes with screened electrostatic interactions. The high frequency dispersion in the viscous loss modulus is relatively insensitive to the DNA concentration and is related to the Rouse dynamics of the DNA molecule inside the tube formed by the entanglements.
ACKNOWLEDGMENTS
We thank Chorng Haur Sow for his advice in the initial phase of this research, Koo Huey Sian and Santosh Kumar for experimental support, and J.-L. Sikorav for discussions and critical reading of the manuscript. APPENDIX: COEFFICIENTS
Coefficients in the expression of the viscoelastic moduli pertaining to the curvature in the mean square displacement up to and including second order in  and ␥. 共n兲 denotes the nth order polygamma function, c1 = /4共4共1兲共␣ + 1兲 − 共2i共0兲共␣ + 1兲 + 兲2兲,
共A1兲
c2 = ␥/8共i共2i共0兲共␣ + 1兲 + 兲3 + 12共− i + 2共0兲共␣ + 1兲兲 ⫻共1兲共␣ + 1兲 + 8共2兲共␣ + 1兲兲,
共A2兲
c3 = 2/32共8共2共0兲共␣ + 1兲4 − 4i共0兲共␣ + 1兲3 − 3共2 − 4共1兲共␣ + 1兲兲共0兲共␣ + 1兲2 + 共i共2 − 12共1兲共␣ + 1兲兲 + 8共2兲共␣ + 1兲兲共0兲共␣ + 1兲 + 6共1兲共␣ + 1兲2 − 32共1兲共␣ + 1兲 − 4i共2兲共␣ + 1兲兲 + 4 + 16共3兲共␣ + 1兲兲,
共A3兲
c4 = ␥/32共32共0兲共␣ + 1兲5 − 80i共0兲共␣ + 1兲4 − 80共2 − 4共1兲共␣ + 1兲兲共0兲共␣ + 1兲3 + 40i共− 12共1兲共␣ + 1兲 + 3 − 8i共2兲共␣ + 1兲兲共0兲共␣ + 1兲2 + 10共− 8共3共1兲共␣ + 1兲共2 − 2共1兲共␣ + 1兲兲 + 4i共2兲共␣ + 1兲兲 + 4 + 16共3兲共␣ + 1兲兲共0兲共␣ + 1兲 − i共240共1兲共␣ + 1兲2 − 40共3 − 8i共2兲共␣ + 1兲兲共1兲共␣ + 1兲 + 5 + 80共共3兲共␣ + 1兲 − i共2兲共␣ + 1兲兲 + 32i共4兲共␣ + 1兲兲兲,
共A4兲
c5 = ␥2/128共4共16共0兲共␣ + 1兲6 − 48i共0兲共␣ + 1兲5 − 60共2 − 4共1兲共␣ + 1兲兲共0兲共␣ + 1兲4 + 40i共− 12共1兲共␣ + 1兲 + 3 − 8i共2兲共␣ + 1兲兲共0兲共␣ + 1兲3 + 15共− 8共3共1兲共␣ + 1兲共2 − 2共1兲共␣ + 1兲兲 + 4i共2兲共␣ + 1兲兲 + 4 + 16共3兲共␣ + 1兲兲 ⫻共0兲共␣ + 1兲2 − 3i共240共1兲共␣ + 1兲2 − 40共3 − 8i共2兲共␣ + 1兲兲共1兲共␣ + 1兲 + 5 + 80共共3兲共␣ + 1兲 − i共2兲共␣ + 1兲兲 + 32i共4兲共␣ + 1兲兲共0兲共␣ + 1兲 + 5共48共1兲共␣ + 1兲3 − 362共1兲共␣ + 1兲2 + 3共− 32i共2兲共␣ + 1兲 + 4 + 16共3兲共␣ + 1兲兲共1兲共␣ + 1兲 + 4共8共2兲共␣ + 1兲2 + 2i3共2兲共␣ + 1兲 − 32共3兲共␣ + 1兲兲兲 − 48i共4兲共␣ + 1兲兲 − 6 + 64共5兲共␣ + 1兲兲.
P.-G. de Gennes, Scaling Concepts in Polymer Physics 共Cornell University Press, Ithaca, NY, 1979兲. 2 J. R. C. van der Maarel, Introduction to Biopolymer Physics 共World Scientific, Singapore, 2008兲. 3 R. Musti, J.-L. Sikorav, D. Lairiez, G. Jannink, and M. Adam, C. R. Acad. Sci., Ser. IIb: Mec., Phys., Chim., Astron. 320, 599 共1995兲. 4 Y. Heo and R. G. Larson, J. Rheol. 49, 1117 共2005兲. 5 D. E. Smith, T. T. Perkins, and S. Chu, Phys. Rev. Lett. 75, 4146 共1995兲. 6 T. G. Mason, A. Dhopple, and D. Wirtz, Macromolecules 31, 3600 共1998兲. 7 D. Jary, J.-L. Sikorav, and D. Lairiez, Europhys. Lett. 46, 251 共1999兲. 8 T. G. Mason, Rheol. Acta 39, 371 共2000兲. 9 R. Verma, J. C. Crocker, T. C. Lubensky, and A. G. Yodh, Phys. Rev. 1
共A5兲
Lett. 81, 4004 共1998兲. T. G. Mason, K. Ganesan, J. H. van Zanten, D. Wirtz, and S. C. Kuo, Phys. Rev. Lett. 79, 3282 共1997兲. 11 D. T. Chen, E. R. Weeks, J. C. Crocker, M. F. Islam, R. Verma, J. Gruber, A. J. Levine, T. C. Lubensky, and A. G. Yodh, Phys. Rev. Lett. 90, 108301 共2003兲. 12 A. J. Levine and T. C. Lubensky, Phys. Rev. E 65, 011501 共2001兲. 13 R. Bandyopadhyay and A. K. Sood, Pramana, J. Phys. 58, 685 共2002兲. 14 M. Doi and S. F. Edwards, The Theory of Polymer Dynamics 共Oxford University Press, New York, 1986兲. 15 R. E. Teixeira, A. K. Dambal, D. H. Richter, E. S. G. Shaqfeh, and S. Chu, Macromolecules 40, 2461 共2007兲. 10
Downloaded 06 Jan 2011 to 137.132.123.69. Redistribution subject to AIP license or copyright; see http://jcp.aip.org/about/rights_and_permissions