Visibility Map for Global Illumination in Point Clouds Rhushabh Goradia Anil Kanakanti Sharat Chandran Indian Institute of Technology Bombay Email: {rhushabh,kanil,sharat}@cse.iitb.ac.in
Amitava Datta University of Western Australia
[email protected]
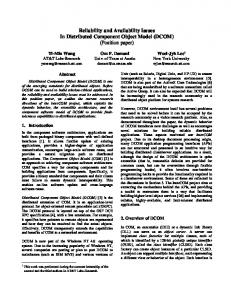
Figure 1: Point models rendered with global illumination effects. Pair-wise visibility information is essential in such cases. Note that the Cornell room as well as the models in it are input as point models.
Abstract Point-sampled geometry has gained significant interest due to their simplicity. The lack of connectivity touted as a plus, however, creates difficulties in many operations like generating global illumination effects. This becomes especially true when we have a complex scene consisting of several models. The data is often hard to segment as individual models and hence not suitable for surface reconstruction. Inter-reflections in such complex scenes requires knowledge of visibility between point pairs. Computing visibility for point models is all the more difficult (than for polygonal models), since we do not have any surface or object information. We present in this paper a novel, hierarchical, fast and memory efficient algorithm to compute a description of mutual visibility in the form of a visibility map. Ray shooting and visibility queries can be answered in sub-linear time using this data structure. We evaluate our scheme analytically, qualitatively, and quantitatively and conclude that these maps are desirable. Keywords: Point models, visibility map, radiosity, global illumination CR Categories: I.3.7 [Computer Graphics]: Three-Dimensional Graphics and Realism—Radiosity; I.3.3 [Computer Graphics]: Picture/Image Generation
1
Introduction
Points as primitives have come to increasingly challenge polygons for complex models [Pfister et al. 2000; Rusinkiewicz and Levoy
2000]; as soon as triangles get smaller than individual pixels, the raison d’etre of traditional rendering can be questioned. More important, however, is the considerable freedom points enjoy. The independence of connectivity and topology enable filtering operations, for instance, without having to worry about preserving topology or connectivity [Zwicker et al. 2001]. Simultaneously, modern 3D digital photography and 3D scanning systems [Levoy et al. 2000] acquire both geometry and appearance of complex, realworld objects in terms of (humongous) points. Points are a natural representation for such data acquired by range scanners, and directly rendering them without the need for cleanup and tessellation makes for a huge advantage.
1.1
Inter-Visibility for Points
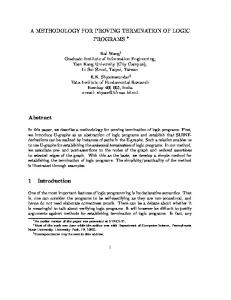
We wish to see the effects of Global Illumination (GI) – the simulation of the physical process of light transport that captures interreflections – on point clouds. For example, these three-dimensional point models may be scans of cultural heritage structures (see Figure 2) and we may wish to view them in a virtual museum under various lighting conditions. Note that the point clouds of interest are not solitary models, but may consist of hard to segment entities thereby inhibiting a surface reconstruction algorithm that produces meshes. Interesting methods like statistical photon tracing, directional radiance maps, and wavelets based hierarchical radiosity [Wald 2005; Gortler et al. 1993] have been invented for the purpose of global illumination. Traditionally all these methods assume a surface representation for the propagation of indirect lighting. Surfaces are either explicitly given as triangles, or implicitly computable.The absence of connectivity between points inherent in point based models now hurts computation, especially in hard to segment models. C HALLENGES : An important aspect of capturing this radiance (be it a finite-element based strategy or otherwise) is an object space view-independent knowledge of visibility between point pairs. A view-independent visibility solution cannot (in general) use the popular hardware-based z-buffering technique. Further, since points are zero-dimensional with no connectivity information, we do not have knowledge of any intervening surfaces occluding a pair of points. Thus, only approximate invisibility between points can be inferred.
Figure 2: Grottoes form a treasure for mankind. When such data are available as point samples, it’s hard to segment individual objects, and hence build an accurate surface representation that might be needed for pairwise visibility.
1.2
Contributions
1. We propose a novel, atomic point-pair visibility algorithm. Further, using the atomic algorithm, we define and build a hierarchical visibility map data structure, termed V-map. The visibility problem, in general, has a worst-case Θ(n2 ) time complexity for n primitives. Given the fact that point models are complex, dense, and consists of millions of points, visibility algorithms are highly time consuming. In real scenes, we might have partitions that are completely unoccluded, or hopelessly obscured. Hierarchical visibility is often used to discover unoccluding portions, and prune uninteresting parts of the mutual-visibility problem. With the V-map, visibility queries are answered quickly whether we have lots of unoccluded space (such as the Cornell room without any boxes) or densely occupied space (the same room packed with boxes). 2. Our main use of the V-map is for GI. Here given a node in a hierarchy, and a list of interacting nodes (possibly pruned from the universe based on a form factor principle), we need to further prune based on visibility. The V-map works as an efficient pre-processing step for any hierarchical global illumination method. 3. We theoretically prove the optimality of our method in terms of memory & computational requirements. We follow with quantitative & qualitative results by incorporating it in our GI solution.
1.3
Related Work
Many global visibility (both view-dependent and viewindependent) solutions like discontinuity meshing[Drettakis and Sillion 1996; Stewart and Karkanis 1998], visibility skeleton and complex [Durand et al. 1997; Durand et al. 1996] and many others [Teller and Hanrahan 1993; Landa et al. 2006] have previously been designed for polygonal models. [Bittner 2002] provides a visibility map for an input scene given in terms of polygons. However, the V-Map structure presented in our paper is different from the visibility map of [Bittner 2002], which specifies the Potential Visible Set from a given view (unlike view-independent in our case) and uses it specifically for occlusion culling. Points were used as display primitives for the first time in [Levoy and Whitted 1985]. [Kobbelt L. 2004] contains an overview of using point-based representation in acquisition and modeling. The methods described in [Kobbelt L. 2004] consider only viewdependent visibility and do not consider the problem we tackle. An early reference to visibility for point clouds is in [Grossman J. 1998] where visibility cones are constructed locally on a per-need basis. The mutual visibility problem for points was first considered
(to our knowledge) in a technical report [Dutre et al. 2000] where the focus was on constructing the approximate visibility value between two points using point cloud representation of the surfaces in the scene. Although our atomic algorithm is inspired from [Dutre et al. 2000], there are several performance enhancements due to the explicit use of hierarchy in our method. Visibility has also been considered by [Dobashi et al. 2004; Wald and Seidel 2005; Wald 2005] for radiosity on point models, but their primary focus was on computing radiance than visibility. We, on the other hand, focus on computing mutual visibility in the context of point clouds. Some other notable differences with [Dobashi et al. 2004] are the way the hierarchy is constructed and also the fact that we pre-compute the visibility information and store it in a form of V-map. It is not clear how visibility is handled at the coarser levels (near to root) of the hierarchy in [Dobashi et al. 2004].
1.4
Roadmap
The rest of the paper is organized as follows. We start with the introduction of the V-map in Section 2. Section 3 provides details of an “atomic” point–pair visibility algorithm which is independent of the V-map. We then extend this basic point–pair visibility algorithm in a hierarchical setting to construct the desired V-map in Section 4. Quantitative and qualitative results appear in Section 5. We also provide a brief overview of the Fast Multipole Method (FMM) used for solving the radiosity kernel in close to O(N ) time for the purpose of computing diffuse global illumination on point models in Section 5. We used FMM as a test bed for asserting the correctness of our generated V-map in the context of global illumination. We follow it up with some concluding remarks and work to be done in future in Section 6.
2
The Visibility Map
The construction of the V-map starts assuming a hierarchy is given. For the purpose of illustration of our method, we use the standard octree-based subdivision of space. Figure 4 shows a two dimensional version to illustrate the terminology. The V-map for a tree is a collection of visibility links for every node in the tree. The visibility link for any node p is a list L of nodes; every point in any node in L is guaranteed to be visible from every point in p. Figure 3 provides different views of the V-map. (The illustration shows directed links for clarity; in fact, the links are bidirectional.) The V-map entertain efficient answers to the following queries. 1. Is point x visible to point y? The answer may well be, “Yes, and, by the way, there are a whole bunch of other points near y that are also visible.” This leads to the next query.
LEVEL 0 (ROOT )
LEVEL 1
LEVEL 2
LEVEL 3 (LEAF) With respect to
at any level,
−− COMPLETELY INVISIBLE −− COMPLETELY VISIBLE −− PARTIALLY VISIBLE
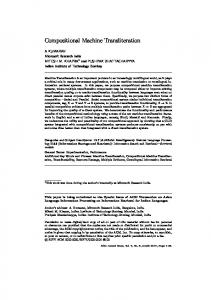
Figure 3: Views of the V-map (with respect to the hatched node in red) is shown. Every point in the hatched node at the first level is visible from every point in only one node (the extreme one). At level 2, there are two such nodes. The figure on the left shows that at the lowest level, there are three visible leaves for the (extreme) hatched node; on the other hand the figure on the right shows that there are only two such visible leaves, for the second son (hatched node). The figure also shows invisible nodes that are connected with dotted lines. For example, at level 1, there is one (green) node G such that no point in G is visible to any point in the hatched node. Finally the dashed lines shows “partially visible” nodes which need to be expanded. Partial and invisible nodes are not explicitly stored in the V-map since they can be deduced.
2. What is the visibility status of u points around x with respect to v points around y? An immediate way of answer this question is to repeat a “primitive” point-point visibility query uv times. With a V-map, based on the scene, the answer is obtained more efficiently with O(1) point-point visibility queries. 3. Given a point x and a ray R, determine the first object of
intersection. 4. Is point x in the shadow (umbra) of a light source? All the above queries are done with a simple traversal of the octree. For example for the third query, we traverse the root to leaf O(log n) nodes on which x lies. For any such node p, we check if R intersects any node pi in the visibility link of p. A success here enables easy answer to the desired query.
3
Point–Pair Visibility Algorithm
Level 3
Level 2
Level 1
Level 0
Since our input data set is a point model with no connectivity information, we don’t have knowledge of any intervening surfaces occluding a pair of points. Theoretically, it is therefore impossible to determine exact visibility; but only approximate visibility. For practical purposes we, however, restrict ourself to Boolean visibility based on the results of the following approximate visibility tests. Consider two points p and q with given normals np & nq as in Figure 5. Given any such point, a natural tangent plane is defined as the one passing through that point and orthogonal to its normal. We now run the following tests to efficiently produce O(1) possible occluders. 1. Cull backfacing surfaces not satisfying the constraint np ·pq > 0 and nq · qp > 0
Figure 4: Leaf nodes (or cells, or voxels) are at level three.
2. Determine the possible occluder set X of points close to pq
greater than
n4 n1
x4
c2
nq
x1 np p
cZ
q x3
x2 n2
n3
n5 c1
x5
(a) A potential occluding set of leaves are generated given centroids c1 and c2 . The dotted leaf contains no point and is dropped.
Figure 5: Visibility between points p and q is to be determined. Only points (x1 , x2 , x3 , x4 , x5 ) (out of the whole point model) are considered as potential occluders. Further, only points x2 and x3 will be considered as actual occluders.
c2 c2 cZ4 cZ3 c1
c1
which can possibly affect their visibility. As an example, in Figure 5, points (x1 , x2 , x3 , x4 , x5 ) ∈ X. An efficient way to obtain X is to apply a 3D Bresenham’s line segment algorithm between p and q. This will output a set Y of points which are collinear with and between p and q. Using the hierarchical structure, we add to X all points from the leaves containing any point from Y . The resolution or the step-length is based on the sampling resolution of the original point dataset.
(b) cZ3 is rejected because the tangent plane is parallel to c1 c2 . Similarly, we reject cZ4 as the intersection point of the tangent plane lies outside the line segment.
3. We now prune the set X further by applying a variety of tangent plane intersection tests (Figure 5). We consider the distance of the occluder from the line segment, along the tangent plane of the occluding point. The intuition is that the tangent plane gives a local approximation of a surface, and a possible occluder, at that point. Hence, we reject point x1 as the intersection point of the tangent plane lies outside segment pq, point x4 because it is more than a distance ∆ away from pq, and point x5 as its tangent plane is parallel to pq.
(c) cZ2 is rejected because the line segment c1 c2 doesn’t intersect the tangent plane within a circle of radius determined by the farthest point from the centroid. Only cZ1 is considered as a potential occluder.
Any point from X which fails any of the tangent tests is considered an occluder to pq. If we find K such occluders, q is considered invisible to p. Parameters ∆ and K are user defined; in our work (see below) we do not need these per se.
4
Constructing V-Map for Point Clouds
We now extend our point–pair visibility algorithm to the hierarchical structure (Octrees) constructed on the input point model.
4.1
Octree Depth Considerations
In a hierarchical setting, and for sake of efficiency, we may terminate the hierarchy with each leaf containing several points. The point–pair visibility algorithm of the previous section is now applicable to a leaf–pair where we compute visibility between the centroids (c1 and c2 , Figure 6) of the points in those leaves. Note that the centroid is not the same as the geometrical center of the leaf. Considering centroids (and not center) essentially allows us to take into account the distribution of points in the leaf. The line segment c1 c2 now intersect a set of leaves and the set X (Section 3) comprises of the centroids of the points in these intersecting leaves. Our occlusion criteria is modified as follows: • If an intersecting leaf contains no point, the centroid of the points in that leaf is dropped from set X (Figure 6(a)). • Define a normal at the centroid by averaging the normals of the points belonging to that leaf. A tangent plane is then suitably defined as before. If this tangent plane is parallel to c1 c2
c2
c2 cZ1 c1
c1
cZ2
R
Figure 6: Leaf-pair visibility is obtained by performing a number of tests.
or intersects outside (Figure 6(b)), we drop the centroid in that leaf. • A final pruning happens based on the data dependent distance R (loosely similar to ∆ in Section 3) of the centroid in the intersecting leaf to the farthest point in the leaf. (Figure 6(c)). Any intersecting leaf which fails any of the above tests is deemed to be an occluder for the centroid-pair c1 c2 . We consider c1 c2 as invisible, if there exists at least one occluding leaf (corresponds to K=1 from Section 3). Finding the first occluder enables us to exit immediately thereby avoiding unnecessary computations. Although this algorithm involves approximation, the high density of point models results in no significant artifacts. (See Section 5.1). Further, note that the value of R is dependent on the distribution of points in a leaf and not on the actual size of the leaf (a large leaf can have a very small R). Also, every leaf might (and most likely will) have a different value of R. Finally, the approximation is made only at the leaf level, and never at any internal node of the octree.
4.2
Point Model Visibility Maps
We now extend the leaf–pair algorithm (subsection 4.1) to determine visibility between internal nodes in the hierarchy. We start with the given hierarchy and, optionally for each node, a list of interacting nodes termed o-IL (a mnemonic for Old Interaction List). If the o-IL is not given, we initialize the o-IL of every node to be its seven siblings. This default o-IL list ensures that every point is presumed to interact with every other point. Note
Algorithm 1 Construct Visibility Map procedure OctreeVisibility(Node A) 1: for each node B in old interaction list (o-IL) of A do 2: if NodetoNodeVisibility(A,B) == VISIBLE then 3: add B in new interaction list (n-IL) of A 4: add A in new interaction list (n-IL) of B 5: end if 6: remove A from old interaction list (o-IL) of B 7: end for 8: for each C in children(A) do 9: OctreeVisibility(C) 10: end for
that there is no node common between an o-IL of some node, say A, and any of the descendants of A (Referring Fig 3, the lightly shaded nodes – cyan colored – at level 2 belong to the o-IL of the hatched node in red at the same level. Similarly the cyan nodes at level 3 belong to the o-IL of hatched node at level 3). The V-Map is then constructed by calling OctreeVisibility() initially for the root node (present at level 0), which sets up the relevant visibility links in New Interaction List(n-IL). This algorithm invokes NodetoNodeVisibility(A,B) which constructs the visibility links for all descendants of A w.r.t all descendants of B (and vice-versa) at the best (i.e. highest, near to the root) possible level. This ensures an optimal structure for hierarchical radiosity. The links in n-IL of a node, signifying the nodes visible to the current node, are then used while performing hierarchical radiosity calculations. The recursive procedure of NodetoNodeVisibility(A,B) essentially performs pointpair visibility calculations only at the leaf level, between all leaves of A and B, using the algorithm of Section 4.1. Depending on the results between these leaf pairs, we go up the tree and decide on the visibility links of the nodes at upper levels via a simple look-up. Note that the point-pair visibility calculations using average normal and centroids only happens at the leaf level and not at any other intermediate level of the tree. Further, the visibility between the same node pair or a leaf pair is calculated exactly once. Computational Complexity: The visibility problem may well call for the answer to N = Θ(n2 ) pair-wise queries. Any algorithm must therefore spend atleast Ω(N ) time. As a result, we measure the efficiency with respect to the parameter N especially since the V-map purports to answer any of these N queries. We shall see later that NodetoNodeVisibility() is linear with respect to N . OctreeVisibility() then has the recurrence relation T (h) = 8T (h − 1) + N (where A is at height h) which results in an overall linear time algorithm (w.r.t. N ) which is the best possible for any algorithm that builds the V-map.
Algorithm 2 Node to Node Visibility Algorithm procedure NodetoNodeVisibility(Node A, Node B) 1: if A and B are leaf then 2: return the status of leaf–pair visibility algorithm for A & B (subsection 4.1) 3: end if 4: Declare s1=children(A).size 5: Declare s2=children(B).size 6: Declare a temporary Boolean matrix M of size(s1 ∗ s2) 7: Declare count=0 8: for each a ∈ children(A) do 9: for each b ∈ children(B) do 10: state=NodetoNodeVisibility(a,b) 11: if equals(state,visible) then 12: Store true at corresponding location in M 13: count = count + 1 14: end if 15: end for 16: end for 17: if count == s1 ∗ s2 then 18: free M and return VISIBLE 19: else if count == 0 then 20: free M and return INVISIBLE 21: else 22: for each a ∈ children(A) do 23: for each b ∈ children(B) do 24: Update n-IL of a w.r.t every visible child b (simple look up in M ) & vice-versa, free M 25: end for 26: end for 27: return PARTIAL 28: end if
in Algorithm 4.2) during runtime. The constructed V-Map is also a memory efficient data structure as (apart from the basic octree structure) it requires to store only the link structure for every node. For quantitative details, refer Table 1. Visibility Map + GI algorithms: 1. Given a V-Map, ray shooting queries are reduced to searching for primitives in the visibility set of the primitive under consideration, thereby providing a view-independent preprocessed visibility solution. 2. Both diffuse and specular passes on GI for point models can use V-Maps and provide an algorithm (similar to photon mapping), which covers both the illumination effects.
5
Experimental Results
We now turn to NodetoNodeVisibility(A,B), a recursive procedure that sets up the n-IL list of all its proper descendants provided the relationship between A and B is neither visible nor invisible. The computational complexity of this procedure is determined by the call to the leaf–pair visibility algorithm (subsection 4.1). Assuming that this is O(1), we have the recurrence for this procedure as T (h) = 64T (h − 1) + O(1) (where A is at height h). The resulting equation is linear in N (defined earlier).
In this section, we discuss the validity and application of the proposed method to various point models. All examples shown are calculated using a Pentium4 2.6 GHz. Note that all input such as the models, the light source, and the walls of the Cornell room are given as points.
In addition, the algorithm presented is the most efficient and optimized algorithm for constructing the V-Map for the given point model since no extra computations are repeated between the same node or leaf pairs at any level of the octree, whenever there is a case of partial visibility between them. The overall algorithm consumes a small amount of memory (for storing the temporary matrix M as
We validate our proposed method here using an adaptive octree structure (similar results are available even if the octree is not adaptive). Figure 7(a) shows a point model of an empty Cornell room. Note the default colors of the walls. We now introduce a pink Stanford bunny. In Figure 7(b), the eye (w.r.t. which visibility is being computed) is on the red wall (on the left), marked with a cyan col-
5.1
Visibility Validation
ored dot. The violet (purple) colour indicates those portions of the room that are visible to this eye. Notice the “shadow” of the bunny on the green wall and on the floor. The same idea is repeated with the eye placed at different locations for the Buddha (Figure 7(c) and Figure 7(d)) in the Cornell room. Figure 8(a) shows a point model of a different (empty) Cornell room. Note the default colors of the walls. We repeat similar tests with point models of the Indian god Ganesha (Figure 8(b)), the Indian goddess Satyavati (Figure 8(c)) and a blue Bunny (Figure 8(d)) placed in a Cornell room. The quality of results indicate that the approximations made in Section 4.1 do not impact the correctness. We remark that the user divides the octree adaptively depending on the input scene density and complexity and the particular computer used. Increasing or decreasing the levels of subdivision for a given scene is essentially a trade-off between quality of the visibility (user driven), and the computational time. We found that an octree of depth 8 gave us accurate visibility results as shown in Figure 7 and Figure 8.
5.2
Quantitative Results
Having established that the visibility is correctly computed, we turn to a quantitative estimate of the efficacy of the V-map. Table 1 has been given for this purpose. In this table, we show that the actual number of visibility links (column 5) is a small fraction of the quadratic possibilities. For example, the decrease in the number of visibility links in the empty Cornell room is the fraction (1.4 − 0.27)/1.4 (roughly 80%), when the hierarchy is expanded adaptively to level 8. It is interesting to note that this situation persists whether the scene is sparse, or dense. The VMap computation roughly takes approximately 20 − 25 secs for about a million points (refer Table 1). Once constructed, they allow for an interactive walkthrough of the point model scene (Refer supplementary videos at: http://www.cse.iitb.ac.in/ ∼rhushabh/graphite07/videos/).
5.3
Visibility Map in Global Illumination
illuminated even though the back is not directly visible to the light source. Finally, the V-map works well even in the case of aggregated models given as input (for example, point models of both Ganesha and Satyavati placed in a point model of a Cornell room in Figure 9). Recall that the input is a single, large, mixed point data set consisting of Ganesha, Satyavati, and the Cornell room. These models were not taken input as separate entities nor were they segmented into different objects during the whole process.
6
Conclusion and Future Work
Point-to-point Visibility is arguably one of the most difficult problems in rendering since the interaction between two primitives depends on the rest of the scene. One way to reduce the difficulty is to consider clustering of regions such that their mutual visibility is resolved at a group level. Most scenes admit clustering, and the visibility map data structure we propose enables efficient answer to common rendering queries. In this paper, we have given a novel, provably efficient, hierarchical, visibility determination scheme for point based models. By viewing this visibility map as a ‘preprocessing’ step, photo-realistic global illumination rendering of complex point-based models have been shown. As future work we note that the V-Map algorithm can be parallelized. Hence, a good idea would be to extend our algorithm to GPUs.
Acknowledgements We would like to thank the Stanford 3D Scanning Repository as well as Cyberware for freely providing geometric point models to the research community. We would also like to thank Biswarup Choudhury and all other members of Vision, Imaging and Graphics laboratory (ViGIL) at Indian Institute of Technology, Bombay for their invaluable support and feedback.
Having established the correctness of the V-map, and the reduction of the scene complexity (in terms of the number of visible links), we now use the V-map in a global illumination(GI) algorithm, where the Fast Multipole Method [Greengard and Rokhlin 1987] is used to solve the radiosity kernel. The inherent notion of points in the FMM blends very well with hierarchical point models as input. We therefore use the FMM as a test bed for the proof of our concept of V-maps when applied for GI. For every node in an octree, FMM defines an “interaction” list consisting of all possible nodes which can contribute energy to this node. The V-map data structure is therefore needed to assert the visibility between these nodes belonging to the interaction lists.
References
Note that the the purpose of this paper is to highlight the usage and capabilities of a V-map. Hence we do not emphasize on the details of the global illumination algorithm used. Also note that the usage of the V-map is not restricted to FMM based GI but can also be incorporated in existing hierarchical GI algorithms for point models.
D URAND , F., D RETTAKIS , G., AND P UECH , C. 1996. The 3d visibility complex: A new approach to the problems of accurate visibility. In Eurographics Rendering Workshop, 245–256.
Figure 1 and Figure 9 shows results where the subdivision of hierarchy is performed till 50 points per leaf (maximum depth of 8). Figure 9 shows the front view, the back view and the close up of the point models placed in the Cornell room. The color bleeding effects and the soft shadows are clearly visible. The shadows can be made more smoother by increasing the level of subdivision but one compromises on the computation time. The user decides the trade-off. Also worth noting is that the back of Ganesha (Fig 9) is
B ITTNER , J. 2002. Hierarchical Techniques for Visibility Computations. PhD thesis, Czech Technical University. D OBASHI , Y., YAMAMOTO , T., AND N ISHITA , T. 2004. Radiosity for point-sampled geometry. In Proc. Pacific Graphics 2004, 152–159. D RETTAKIS , G., AND S ILLION , F. 1996. Accurate visibility and meshing calculation for hierarchical radiosity. In Rendering Techniques, 7th EG Workshop on Rendering, 269–278.
D URAND , F., D RETTAKIS , G., AND P UECH , C. 1997. The visibility skeleton: a powerful and efficient multi-purpose global visibility tool. Computer Graphics 31, 89–100. D UTRE , P., T OLE , P., AND G REENBERG , D. P. 2000. Approximate visibility for illumination computation using point clouds. Tech. rep., Cornell University. ¨ G ORTLER , S. J., S CHR ODER , P., C OHEN , M. F., AND H ANRA HAN , P. 1993. Wavelet radiosity. In Proc. of SIGGRAPH-93: Computer Graphics, 221–230.
(a) An empty Cornell room.
(b) Visibility test on pink Bunny with (c) The pink Buddha (eye on the floor) (d) The blue Buddha (eye on the red eye on the red wall. wall)
Figure 7: Various visibility tests where purple color indicates portions visible to the candidate eye (marked cyan/brown).
(a) An empty Cornell room.
(b) Visibility test on a saffron Ganesha with eye on the red floor.
(c) The blue Goddess
(d) A blue Bunny (eye on the floor)
Figure 8: Various visibility tests where purple color indicates portions visible to the candidate eye (marked green/cyan). Model
Points (millions)
N 2 possible links (millions)
V-Map Links (millions)
% Decrease
Memory(MB) N 2 links
Memory(MB) V-Map links
Build V-Map Time(secs)
ECR
0.1
1.4
0.27
79.5%
5.35
1.09
20.6
PCR
0.14
3.85
0.67
82.62%
15.43
2.68
23.8
BUN
0.15
1.53
0.38
74.64%
6.09
1.5
21.7
DRA
0.55
2.75
0.43
84.54%
11.0
1.7
23.5
BUD
0.67
1.58
0.39
74.75%
6.33
1.6
23.9
GAN
0.15
1.56
0.38
75.64%
6.2
1.55
22.0
GOD
0.17
1.62
0.4
75.31%
6.4
1.63
22.9
Table 1: V-Map details for sparse scenes such as the Empty Cornell Room(ECR), dense scenes such as the Cornell Room Packed(PCR) to capacity with a large box, or ‘typical’ scenes such as the Bunny(BUN), the Dragon(DRA), the Buddha(BUD), one of the Indian God’s, Ganesha(GAN), and an Indian Goddess(GOD), placed in Cornell room. N represents no. of leafcells. The reduced number of visibility links essentially signify less computations for GI radiosity algorithm. We see the decrease is significant. Further, the maximum memory required for V-Map was 2.68MB for PCR, but was still very less compared to storage for N 2 links. Also, the V-Map roughly took only 20–25 seconds for its construction even for such highly dense point models.
G REENGARD , L., AND ROKHLIN , V. 1987. A fast algorithm for particle simulations. Journal of Computational Physics 73, 325– 348. G ROSSMAN J., D. W. 1998. Point sample rendering. In Rendering Techniques, 181–192. K OBBELT L., B. M. 2004. A survey of pointbased techniques in computer graphics. In Computers & Graphics 28, vol. 6, 801–
814. L ANDA , Y., T SAI , R., AND C HENG , L. 2006. Visibility of point clouds and mapping of unknown environments. In ACIVS06, 1014–1025. L EVOY, M., AND W HITTED , T. 1985. The use of points as a display primitive. Tech. rep., University of North Carolina at Chapel Hill.
Figure 9: Use of V-Maps for GI effects. The hierarchy was constructed till we had less than 50 points per leaf (maximum depth of 8). The images were rendered using a custom point-based renderer. Soft shadows, color bleeding and parts of models indirectly visible to the light source being lit can be observed. Three different set of images, corresponding to different point models, are shown. Each set shows a front view, a back view and a close up of the point model/s placed in the point based Cornell room.
L EVOY, M., P ULLI , K., C URLESS , B., RUSINKIEWICZ , S., K OLLER , D., P EREIRA , L., G INZTON , M., A NDERSON , S., DAVIS , J., G INSBERG , J., S HADE , J., AND F ULK , D. 2000. The digital michelangelo project: 3D scanning of large statues. In Siggraph 2000, Computer Graphics Proceedings, ACM Press, K. Akeley, Ed., 131–144. P FISTER , H., Z WICKER , M., VAN BAAR , J., AND G ROSS , M. 2000. Surfels: Surface elements as rendering primitives. In Siggraph 2000, 335–342. RUSINKIEWICZ , S., AND L EVOY, M. 2000. QSplat: A multiresolution point rendering system for large meshes. K. Akeley, Ed., 343–352. S TEWART, A. J., AND K ARKANIS , T. 1998. Computing the approximate visibility map, with applications to form factors and discontinuity meshing. Eurographics Workshop on Rendering (June), 57–68. T ELLER , S., AND H ANRAHAN , P. 1993. Global visibility algorithms for illumination computations. In Proc. of SIGGRAPH93: Computer Graphics, 239–246.
WALD , I., AND S EIDEL , H.-P. 2005. Interactive Ray Tracing of Point Based Models. In Proceedings of 2005 Symposium on Point Based Graphics. WALD , I. 2005. High-Quality Global Illumination Walkthroughs using Discretized Incident Radiance Maps. Technical Report, SCI Institute, University of Utah, No UUSCI-2005-010 (submitted for publication). Z WICKER , M., P FISTER , H., VAN BAAR , J., AND G ROSS , M. 2001. Surface splatting. In SIGGRAPH ’01, 371–378.