hard to learn. For example, Microsoft Word shows poor learnability ... Hierarchical
Task Analysis [Hollnagel 2003], essential use case. [Constantine 1999], etc.
VisTool A user interface and visualization development system
Shangjin Xu
IT University of Copenhagen Rued Langgaards Vej 7, DK-2300 Copenhagen S
Abstract Although software usability has long been emphasized, there is a lot of software with poor usability. In Usability Engineering, usability professionals prescribe a classical usability approach to improving software usability. It is essential to prototype and usability test user interfaces before programming. However, in Software Engineering, software engineers who develop user interfaces do not follow it. In many cases, it is desirable to use graphical presentations, because a graphical presentation gives a better overview than text forms, and can improve task efficiency and user satisfaction. However, it is more difficult to follow the classical usability approach for graphical presentation development. These difficulties result from the fact that designers cannot implement user interface with interactions and real data. We developed VisTool – a user interface and visualization development system – to simplify user interface development. VisTool allows user interface development without real programming. With VisTool a designer assembles visual objects (e.g. textboxes, ellipse, etc.) to visualize database contents. In VisTool, visual properties (e.g. color, position, etc.) can be formulas that compute appearance values, access records from the database, etc. This is a new way of development different from programming. So the designer does not program an object-relational mapping layer, which requires in-depth knowledge about programming and database. He directly maps relational data to user interface objects and properties. We built visualizations such as Lifelines, Parallel Coordinates, Heatmap, etc. to show that the formula-based approach is powerful enough for building customized visualizations. The evaluation with Cognitive Dimensions shows that the formula-based approach is cognitively simpler than the state-of-art tools. Usability test shows that VisTool is accessible to designers. Furthermore, it indicates that expert designers can do faster than with other tools. Our comparison with the traditional rapid development approach shows that VisTool reduces development time about 80%. A performance test shows that VisTool performance is adequate. Keywords: user interface development, graphical presentation, visualization, usability, the formula-based approach
Table of Contents Abstract ................................................................................................ 2 Table of Contents................................................................................. 3 Acknowledgements.............................................................................. 6 Chapter 1 Introduction ......................................................................... 7 1.1 Problems ............................................................................................... 7 1.2 Why a user interface development tool is important .......................... 10 1.3 Solution .............................................................................................. 16
Chapter 2 Background ....................................................................... 18 2.1 What is usability and why is it important? ......................................... 18 2.2 What usability specialists suggest – a classical approach................... 21 2.3 What are appropriate prototypes? ....................................................... 23 2.4 Difficulties with prototyping .............................................................. 26 2.5 Problems with ensuring usability in the waterfall model .................... 29 2.6 Difficulties with ensuring usability in agile methods ......................... 32 2.7 Graphical presentation – a problem amplifier .................................... 35 2.8 Research goal ..................................................................................... 40
Chapter 3 Previous research and tools ............................................... 42 3.1 State-of-the-art tools ........................................................................... 44 3.2 Tools for developing graphical presentations ..................................... 52 3.2.1 Protovis – a component-based toolkit ......................................... 52 3.2.2 Prefuse – a development toolkit for visualizations with realistic data ....................................................................................................... 56 3.3 Model-based prototyping tools ........................................................... 62
Chapter 4 VisTool Introduction ......................................................... 65 4.1 An example scenario .......................................................................... 65 4.1.1 The design phase ......................................................................... 66 4.1.2 The first prototype ....................................................................... 73 4.1.3 Improve the prototype ................................................................. 73 4.1.4 The first release ........................................................................... 78 4.1.5 Deployment ................................................................................. 79 4.1.6 After the deployment of the first release ..................................... 79 4.2 The theory behind the story ................................................................ 81 4.3 Design rationale .................................................................................. 82 4.3.1 Formula Language ...................................................................... 83 4.3.2 Formula usability ........................................................................ 84 4.3.3 Templates .................................................................................... 86 4.3.4 Interface builder .......................................................................... 87 3
Chapter 5 How VisTool works .......................................................... 89 5.1 Basic Concepts ................................................................................... 89 5.1.1 Control instance .......................................................................... 89 5.1.2 Control template ......................................................................... 91 5.2 Multiple instances of a control ........................................................... 94 5.3 Property formulas............................................................................... 95 5.3.1 Walking from one data entity to another .................................... 96 5.3.2 Walking from control to data (>-) .............................................. 97 5.3.3 Walking from data to control (-=)............................................... 97 5.3.4 Interaction ................................................................................... 99 5.3.5 An example of complex interaction .......................................... 100 5.4 Implementation rationale ................................................................. 104 5.4.1 Integrate database query into Formula Language ..................... 104 5.5 Formula Language Semantics .......................................................... 113 5.5.1 Notation .................................................................................... 113 5.5.2 Join-many (--) ............................................................................. 115 5.5.4 Control-join (-=) ....................................................................... 117 5.5.5 Dot (.) ....................................................................................... 118 5.5.6 Bang (!) ..................................................................................... 119 5.5.7 Control indexing ([ ]) ................................................................ 119 5.6 DataSource semantics ...................................................................... 119
Chapter 6 VisTool Implementation ................................................. 122 6.1 Formula Language syntax ................................................................ 122 6.2 Path compilation .............................................................................. 124 6.3 Dynamic Typing .............................................................................. 127 6.4 VisTool user interface description language .................................... 128
Chapter 7 Evaluation ....................................................................... 132 7.1 An evaluation of expressive power .................................................. 134 7.1.1 Expressive power ...................................................................... 149 7.2 Cognitive Dimensions ...................................................................... 153 7.2.1 Closeness of mapping ............................................................... 154 7.2.2 Hidden dependencies ................................................................ 162 7.2.3 Abstraction gradient ................................................................. 164 7.2.4 Viscosity ................................................................................... 167 7.2.5 Error-proneness ........................................................................ 169 7.2.6 Hard mental operations ............................................................. 172 7.2.7 Premature commitment ............................................................. 174 7.2.8 Secondary notation ................................................................... 177 4
7.2.9 Diffuseness ................................................................................ 178 7.2.10 Juxtaposability ........................................................................ 179 7.2.11 Summary ................................................................................. 180 7.3 Usability tests of VisTool interface builder ...................................... 181 7.3.1 Usability test with a tutorial and non-programmers .................. 182 7.3.2 Usability test with designers working in the domain ................ 183 7.3.3 Usability test with expert designers .......................................... 185 7.4 Comparative development effort ...................................................... 186 7.4.1 The background ......................................................................... 187 7.4.2 ThermoVis ................................................................................ 188 7.4.3 TreemapVis ............................................................................... 190 7.4.4 Summary ................................................................................... 192 7.5 Performance test ............................................................................... 194
Chapter 8 Discussion and Conclusion ............................................. 195 8.1 Conclusion ........................................................................................ 198
Chapter 9 Future Research............................................................... 200 Appendix A A syntax tree example ................................................. 201 Appendix B Comparison source code ............................................. 205
5
Acknowledgements Shangjin Xu was enrolled as a Ph.D. student at IT University of Copenhagen and joined the Electronic Health Record project and VisTool for data visualization in 2009. Soren Lauesen invented the basic VisTool principles, including the basic formula principle. The rest of the VisTool ideas, the implementation architecture and the implementation itself are the joint intellectual work of Mohammad A. Kuhail, Soren Lauesen, Kostas Pantazos and Shangjin Xu (in alphabetical sequence). My research is supported by many people, and I record my work and experience in this thesis. First of all, I thank the Danish Strategic Research Council (NABIIT) and IT University of Copenhagen. Secondly, I thank my mentor and friend Professor Soren Lauesen. His rich knowledge, scientific attitudes for solving practical problems, and the meticulous way of working impress me. I believe that I have learned some of these, and this experience has a far-reaching effect on my future work. I also enjoyed the work with our Vis-teammates: Mohammad A. Kuhail, Soren Lippert, and Kostas Pantazos. We had candid talks, fruitful discussions, effective collaborations, and interesting tiredness-killers e.g. football. All of you helped me realize some blind spots in my research, and made my work "alive". In the end, I thank my family and wife. Sometimes, I may give you the impression that I was a robot who focused only on work. I may answer your request after one minute or even longer, because I was thinking about my work and a spark was just firing. Sorry, a single-threaded robot. I am so lucky to have all of you. You understand and support my work, and make my life vivid. In the future this "robot" will be much more intelligent!
6
Chapter 1 Introduction Software usability has long been emphasized. People in Usability Engineering and Software Engineering seek many ways [Abras 2004][Barnum 2001][Baecker 1993] and invent tools [Carroll 1992][Pyla 2006][Arroyo 2006] to improve software usability, but few tools can be used by user interface designers with limited programming skills. Usability Engineering specialists prescribe the classical usability approach to improving software usability. However, software engineers do not follow it, because contemporary development tools do not support it in the waterfall model and prototyping tools do not fulfill needs for agile methods.
1.1 Problems In Usability Engineering, a lack of suitable user interface prototyping tools is a major problem. The classical usability approach relies on user interface prototyping and usability testing. In general, there are two kinds of prototyping techniques: low-fidelity prototyping and high-fidelity prototyping [Nielsen 1993][Preece 2002]. Low-fidelity prototypes (e.g. screen mock-ups) are easy to make, but lack functions, and thus cannot test interactions. It is also cumbersome for designers to show realistic data with low-fidelity prototypes. Some applications (e.g. the Gantt chart) may even require domain expertise for imagining realistic data, so user interface designers usually fill in imaginary data. A high-fidelity prototype has functions and is close to the final user interface. However, programming is needed to develop a high-fidelity prototype. The cost of high-fidelity prototyping is as expensive as the eventual user interface development [Rudd 1996]. In addition, software engineers rarely reuse the prototypes that are developed by user interface designers. Instead, they build real user interfaces from scratch. So user interface designers do not directly 7
1.1 Problems
contribute to the eventual application, and their efforts are wasted in this sense. Hence, user interface designers need a low-cost prototyping tool that requires little programming and can implement high-fidelity user interfaces with most of interactions and real data. In Software Engineering, the classical usability approach from Usability Engineering might not be followed. The result is that software functionality meets the user's needs, but usability might be poor. That is because "the way in which the functions are implemented will have a significant impact on system usability"[Goodwin 1987]. The current tools do not support the classical usability approach in Software Engineering. For example, in the design phase of the waterfall model, classes are not designed yet. So user interface designers do not know what kinds of data they have, and cannot design the user interface. Furthermore, functionality for interactions and real data requires programming. Consequently, designers cannot usability test user interfaces before programming, and thus the classical usability approach is not followed in the waterfall model. In agile methods, traditional prototypes turn out to be outdated. They are not suitable for rapid software development. For instance, nowadays mainstream prototyping tools are still art design tools such as Adobe Photoshop, etc. [Carter 20120]. Those prototypes do not implement interactions and are not deployable. In addition, software is developed in a rapid pace in agile methods. However, the traditional prototyping tools do not develop prototypes fast enough, in particular, for graphical presentations. As a result, the classical usability approach is not followed in agile methods either. Graphical presentations show data by means of visual properties such as color, size, shape, etc. Examples are Lifelines, Scatterplot, etc. Because our retina is quite sensitive to those visual properties [Mazza 2009], graphical presentations give a better overview than text forms [Keim 2001], and it can improve users' task efficiency. However, graphical presentations amplify the problems. It is more time-consuming and more error-prone for user interface designers to draw low-fidelity visualization prototypes. It is also more 8
1.2 Why a user interface development tool is important programming-intensive to implement a graphical presentation than a simple user interface presentation. Even a seasoned software engineer feels it difficult to program a graphical presentation such as Lifelines. Consequently, user interface designers cannot implement functional graphical presentations, and cannot determine if the presentation in the software product is useful and usable. Nor do software engineers tend to utilize graphical presentations in software products.
9
1.2 Why a user interface development tool is important
1.2 Why a user interface development tool is important User interface designers design user interfaces, but do not implement them. They have good knowledge about user interface design and know the principles for ensuring usability. However, user interface designers have limited knowledge of programming. As a result, they cannot use development tools that require intensive programming. Nowadays, there are many tools that can be used for drawing screens (low-fidelity prototyping) such as Adobe Photoshop, Microsoft Expression Blend, etc. However, those screens are non- functional. Programmers have to program to make the screens "alive" so that the screens can respond to user interactions, show real data from the database, and so forth. Microsoft Expression Blend is one of the state-of-the-art tools. It facilitates a user interface designer to draw aesthetic screens like in Adobe Photoshop. To some extent it also makes the programmers' work easy, because programmers can reuse the user interface specification code that has been drawn by the designers. Based on the designer's work, the programmers integrate programming code such as C# to make the screen functional. In short, Expression Blend supports the division of work: user interface designers design a non-functional user interface, and programmers program functions later. However, in the author's opinion, this division of work sounds nice for user interface development, but performs awfully for ensuring usability. The fact that designers cannot implement functional user interfaces for early usability testing is an obstacle to improving usability. With the current tool, functions for real data and interactions are overlooked in usability testing. For instance, designers might usability test non-functional screens, and thus cannot test interaction details. More severely, usability tests might not be carried out until the end of programming. At that time, it is too difficult to fix critical usability problems.
10
1.2 Why a user interface development tool is important
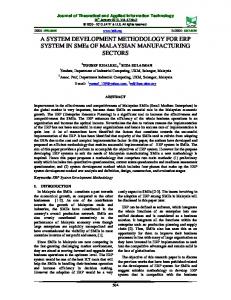
Figure 1–Many properties are not easy to use for non-programmers.
11
1.2 Why a user interface development tool is important The feasible way of ensuring usability is that, before programming the system, user interface designers design the screens with most of the functionality, and also usability test and improve them iteratively [Lauesen 2005]. With state-of-the-art tools, can user interface designers do it? We will take Microsoft Expression Blend as an example to show. Expression Blend is a user interface development tool on Windows Presentation Foundation (WPF) and Silverlight. Designers use the drawing tools to draw user interfaces on the Design Panel. The way of drawing the screen is similar to many other professional picture-drawing tools such as Photoshop. But unlike those drawing tools, Expression Blend generates code behind the scene rather than a picture. During the design, the designers switch among various panels to configure appearance and position of the user interface. Designers configure appearance and position in the graphical components' properties. Some properties are intuitive to set such as BackColor. Some require in-depth knowledge about WPF or Silverlight. For example, to show data on the user interfaces, the designer should find out the suitable control for the DataContext property. Before setting a DataContext, the designer has to prepare data in the Data Panel. These are the steps where a non-programmer is hindered. Figure 1 shows the Data Panel. There are many objects that can be used. However, can a non-programmer figure out which objects to use and how to use? The difficulties do not stem from configuring them with Expression Blend but from the concepts themselves e.g. what DataContext is, which control's DataContext to set, and how to set, etc. Note that DataContext is merely an example, and there are many other properties and concepts that the designer should be familiar with.
12
1.2 Why a user interface development tool is important
Figure 2–Programming is unavoidable.
13
1.2 Why a user interface development tool is important Even with this state-of-the-art tool, programming is unavoidable for implementing a functional user interface. For example, in Figure 2 we show that the designer specifies the name of the Click event handler for the button. Behind the scene, Expression Blend generates code for the user interface specification. The user interface specification is an Extensible Application Markup Language (XAML) file. Frequently, the designer has to switch between the graphical design on the Design Panel and the XAML user interface specification. Even worse, where is the content of that event handler? Expression Blend generates the code in another C# programming file. We show the C# code in Figure 3. The designer should grasp solid programming knowledge to understand the event handler and change it. In conclusion, there are large cognitive gaps between graphical appearance on the Design Panel, user interface specification (XAML) and functional code (e.g.: C#, VisualBasic.NET, C++, etc.). The designer has to switch among various panels and gain substantial knowledge to develop a functional user interface. Few designers are able to use those tools. We should free user interface designers from the programming bondage, and help them devote more efforts to user interface design rather than the programming details and tricks. Most important of all, the user interface designers have insufficient programming knowledge to use those complex tools.
14
1.2 Why a user interface development tool is important
Figure 3–Another generated C# file for the content of the event handler
15
1.3 Solution
1.3 Solution We propose a formula-based approach to develop user interfaces and visualizations. We also implemented VisTool – a user interface and visualization development system – to test if the formula-based approach can be used for user interface development without introducing extra programming. VisTool has two groups of users. (1) User interface designers working in the application domain such as hospitals, insurance companies, etc. can use VisTool to design and implement user interfaces for the domain users' daily work. Designers have great knowledge about user interface design and some knowledge about usability, but they have limited programming experience. For example, they can write some spreadsheet formulas, but they cannot write scripts for creating visualizations, and cannot program classes for data transformation, database programming, etc. (2) The end user, such as domain users, uses the VisTool application to do their daily tasks. The VisTool application is developed by user interface designers. Some of the domain users are also the test users, when the designer designs the user interface and carries out usability testing. VisTool supports the classical usability approach: the user interface designer first does rapid prototyping with real data and interaction. Then the designer carries out usability testing with real users and improves the user interface iteratively. With VisTool the designer combines various visual objects e.g. label, bar, spline, etc. to visualize database contents. The designer can implement most of the functionality such as screen update, form navigation, etc. Some advanced functions require programming. Programmers implement those specialized functions, and the designer integrates them into the VisTool application.
16
1.3 Solution VisTool provides a high-level approach to user interface development. Four improvements contribute to the high-level approach.
A system with an interface builder for constructing graphical presentations such as 2D visualization.
The elimination of low-level programming primitives while retaining direct manipulation on user interface "pragmatics"
Formula Language – a new approach to mapping relational data onto user interface objects
The avoidance of intermediate steps and data in the visualization pipeline during the design process
17
Chapter 2 Background Usability professionals propose several approaches to ensure usability, such as user-centered design [Baecker 1999], usage-centered design [Constantine 1999], Usability Engineering life cycle [Nielsen 2002], participatory design [Schuler 1993][Ellis 2000], etc. However, there is still an abundance of software with poor usability, although the software products meet functional requirements [Göransson 2004]. It is because software engineers who develop the software product do not follow them.
2.1 What is usability and why is it important? There are several usability definitions. A frequently referenced one is ISO 9241-11 [ISO 1998] [Stewart 2000]. Usability: the extent to which a product can be used by specified users to achieve specified goals with effectiveness, efficiency and satisfaction in a specified context of use. Usability professionals define usability as factors including learnability, efficiency, memorability, satisfaction, and understandability [Lauesen 2005][Nielsen, 1993][Ferre 2001]. Learnability: How easy is the system to learn for various groups of users? Efficiency: How efficient is it for the frequent user? Memorability: How easy is it to remember for the occasional user? Satisfaction: How satisfied is the user with the system? Understandability: How easy is it to understand what the system does? Errors: How many errors do users make, how severe are these errors, and how easily can they recover from the error? 18
2.1 What is usability and why is it important?
Software Engineering defines usability as a quality of a system. In the Software Engineering standard ISO/IEC FDIS 9126-1, usability is defined in this way. Usability: the capability of the software product to be understood, learned, used and attractive to the user, when used under specified conditions. Usability is important to users. A user grapples with software that is hard to learn. For example, Microsoft Word shows poor learnability in formatting paragraphs. Can an inexperienced user figure out where to set the paragraph indentation, hanging, and the spacing between paragraphs? It is not so easy. The user has to ask an expert for help, or may give up and try another word processor, or has to learn how to use it by scrutinizing how-to documents. Software that rates low in efficiency is cumbersome to use. For instance, it is cumbersome to set a paragraph format using Microsoft Word. The user has to open the paragraph option dialog and change the settings. If the user is not satisfied with the change, he has to repeat the same steps, which degrades task efficiency. The cumbersome steps of setting paragraph formats are also difficult to remember. Figure 4 shows a screenshot of another word processor as an example of good usability. A user can intuitively figure out how to do formatting. This design improves task efficiency in formatting paragraphs and it is easy to learn for an occasional user. Usability is important to business. It pays in many ways such as
Figure 4–An example of good usability in formatting paragraphs
19
2.1 What is usability and why is it important?
reducing training costs [Lund 1997][Nielsen 1993][Mayhew 1994], enhancing customer adherence, increasing the product market share and sales [Boehm 1994][Mayhew 1994]. Software that is easy to learn reduces training costs for employers [Constantine 1999][Mayhew 1994]. For example, usability improvement spared AT&T $2.5 million that were used for training employees [Mayhew 1994][Donahue 2001]. A highly usable website is a necessity for e-business to survive [Nielsen 2008][Chi 2002]. A customer will stay long on a website that guides him to find the intended products, and the immediate benefits are increased sales. In the mobile market, Orlowski argues that Apple iPhone surpasses Nokia Symbian because the iPhone operating system has much better usability [Orlowski 2011]. However, software engineers do not develop software in a way that ensures usability. The next sections explain what usability specialists suggest and why software engineers do not follow them.Roles in software development We define three typical roles involved in user interface development: usability specialists, user interface designers and software engineers. Figure 5 shows those roles. A user interface designer overlaps a few tasks that the other two roles do. Usability specialists, user interface designers and software engineers work together to produce software that serves the user's needs.
Figure 5–Roles in developing user interface
20
2.1 What is usability and why is it important?
Usability specialists are excellent at analyzing users, doing field studies, and carrying out usability activities such as usability testing [Barnum 2001] and heuristic evaluation [Nielsen 1990]. Usually, usability specialists do not design user interfaces and cannot program software either. Some usability specialists may have knowledge of programming and user interface design, but user interface development is not their job. User interface designers are good at designing user interface. They are aware of graphical design and interaction design techniques, and often know usability. For instance, they are aware of usability testing and user interface design guidelines for improving usability. User interface designers have limited programming background. For instance, they are able to write HTML and program a few java scripts, but they rarely program system functions such as committing a payment transaction, sending an email, etc. Software engineers develop programs, but know little about usability. They focus on software design, programming, and software testing e.g.: unit testing, functional testing, etc.
2.2 What usability specialists suggest – a classical approach Usability specialists suggest a classical approach to ensure usability [Lauesen 2005]. As shown in Figure 6, the classical usability approach
Figure 6–a classical approach to ensure usability
21
2.2 What usability specialists suggest – a classical approach
consists of analysis, user interface design, usability testing, and programming. The essential idea is that the user interface is designed and usability tested before programming and testing. Next, we will see what user interface designers do in each step. In the analysis phase, usability specialists analyze users and learn user tasks. Usability specialists propose many ways to do it such as Hierarchical Task Analysis [Hollnagel 2003], essential use case [Constantine 1999], etc. In the user interface design phase, usability specialists suggest that user interface designers should build user interface prototypes [Nielsen 1993][Preece 2002][Lauesen 2005]. The prototype should be developed for a full system rather than only a part of the system. Researchers working in both Usability Engineering and Software Engineering propose systematic ways such as the Virtual Window technique [Lauesen 2005] and the usage-centered design approach [Constantine 1999] to design user interfaces for a full system that can sufficiently support the user’s tasks with high usability. Usability specialists suggest that usability testing should be done after each user interface prototype is made [Lauesen 2005]. Based on the test results, user interface designers or usability specialists revise the user interface prototype to remove usability problems. User interface designers should work in several rounds of the designing-testing-redesigning cycle to find and fix usability problems. This process is known as iterative design [Gould 1985]. After the user interface is usability tested and several revisions are made, software engineers program the user interface. In the classical usability approach, usability testing plays a crucial role to ensure usability. Usability testing is an effective technique to reveal usability problems. It does not require a finished software product and it can be carried out at any phase of the development. Before the usability test, usability specialists plan the tasks to be tested and select test users. Ideally, these tasks have been specified in the analysis 22
2.2 What usability specialists suggest – a classical approach phase, and should be related to the test users’ background. During the test, usability specialists collect feedback from the test users and record usability problems. If the user interface prototype is non-functional, a human facilitator simulates the computer response. The facilitator knows the system thoroughly. On the way of usability testing, he must not guide the user to use the system, because any hint may hide usability problems. After the test, usability specialists analyze test results and may suggest solutions.
2.3 What are appropriate prototypes? In the classical usability approach, prototypes are the artifacts produced and tested. "A prototype is a tangible artifact, not an abstract description that requires interpretation"[Beaudouin-Lafon 2003]. Usability specialists have various ways of classifying prototypes. For instance, Nielsen categorizes prototypes into horizontal and vertical prototypes [Nielsen 1993]. A horizontal prototype covers a wide range of features, but those features can be simulated. A vertical prototype realizes only a few features, but those features are functional and realistic. Some features in a high-fidelity prototype will be reused in the final product. Beaudouin-Lafon categorizes prototypes into off-line and on-line prototypes [Beaudouin-Lafon 2003]. Off-line prototypes are paper prototypes, and on-line prototypes are functional prototypes. Usability specialists also use fidelity to categorize prototypes [Nielsen 1993][Preece 2002]. Fidelity means "the degree to which the prototype accurately represents the appearance and interaction of the product"[Rudd 1996]. In this thesis, we will discuss prototypes with different fidelities. Generally, functions in a low-fidelity prototype are simulated. Hand-drawn sketches are an example of the prototype with the lowest fidelity. Low-fidelity prototypes are fast to make and cheap to throw away. They are non-functional. While a high-fidelity prototype is functional and can be close to the final system, but it is quite expensive to develop. The effort for developing a high-fidelity prototype can be as costly as the final product [Rudd 1996]. The final 23
2.3 What are appropriate prototypes?
software product has the highest fidelity. Between low-fidelity and high-fidelity, there are prototypes in various degrees of fidelity. A clickable user interface can be in the medium-fidelity. They can be produced with presentation tools such as PowerPoint. Designers use them to show the flow of screens. Usability specialists suggest low-fidelity prototypes in the analysis phase [Rudd 1996][Beaudouin-Lafon 2003][Lauesen 2005][Nielsen 1993]. In this phase, usability specialists and designers use prototypes to elicit requirements and explore design directions [Rudd 1996]. A case study shows that, in the analysis phase, low-fidelity prototypes facilitate better communication with the user than high-fidelity prototypes [Bryan-Kinns 2002]. Many usability researchers suggest that the first user interface design should be low-fidelity prototypes [Nielsen 1993][Lauesen 2005][Rudd 1996]. A designer may compare several prototypes for the same task side by side. Or they may demonstrate the prototypes to users to obtain their feedback. For example, they may see if the screens meet the user's needs. Usually radical changes will be made. So prototypes should be produced in an easy and fast way. Low-fidelity prototypes are suitable for those purposes. Usability specialists have much debate on the prototype fidelity for the iterative design (i.e. the design-test-redesign cycle). Some specialists suggest that high-fidelity prototypes should be used to discover problems, because low-fidelity prototypes miss many details such as interactions, error checking, etc. [Rudd 1996][Beaudouin-Lafon 2003]. Some claim that low-fidelity prototypes should be sufficient to test the system [Constantine 1999][Sommerville 2006].
24
2.3 What are appropriate prototypes? Usability specialists agree that usability testing should reveal usability problems with interactions. However, a low-fidelity prototype cannot show interaction details. When usability specialists carry out usability tests with low-fidelity prototypes, a facilitator simulates the computer's responses. Some interactions are so sophisticated that a facilitator is unable to simulate. As a consequence, usability problems with interactions may not be revealed in usability tests. Therefore, a high-fidelity prototype should be used when such interactions are needed [Beaudouin-Lafon 2003].
High-fidelity prototypes are useful for checking if particular usability problems can be removed [Lauesen 2005]. Usually, high-fidelity prototypes are developed in the later iterations. Usability specialists The development progress
Prototype Fidelity
Examples
Analysis
Low-fidelity
Sketches
Low-fidelity or medium-fidelity
(1) Hand-drawn screens (2) Photoshop-drawn screens (3) Clickable mock-ups produced with PowerPoint, HTML, etc.
Iterative design
High-fidelity
Prototypes created by Adobe Flash
Entering the programming phase
High-fidelity
Prototypes created by Microsoft Visual Basic
Design (the 1 round)
st
Figure 7–An overview of the suggested prototypes in the classical approach
25
2.3 What are appropriate prototypes?
suggest that designers should develop incomplete functions for testing, since it is cheaper and faster to program a function just enough for testing than the full-featured function in the final software product. When the development is entering the programming phase, user interface prototypes are handed over to software engineers. Usability specialists suggest that high-fidelity prototypes should be used at this time. Software engineers will program the user interface based on those high-fidelity prototypes. Why high-fidelity prototypes? It is because with low-fidelity prototypes software engineers have to personally decide how to implement interaction details [Rudd 1996]. If these decisions are not usability tested, usability cannot be ensured. In summary, prototypes in only one level of fidelity are not good enough in the classical usability approach. "HCI literatures report that low fidelity prototypes are generally more appropriate in the early stages of design, and that high-fidelity prototypes are more appropriate in the later stage of design" [Carter 2010][Precce 2011][Rudd 1996]. Figure 7 shows an overview of suggested prototypes for each phase. The prototypes are initially low-fidelity. When the user interface development progresses, high-fidelity prototypes become more and more desirable.
2.4 Difficulties with prototyping Although usability specialists suggest the classical usability approach and the appropriate prototypes in the approach, they do not suggest tools to follow it. There are some difficulties with prototyping. First, it is time-consuming to develop data presentations with both low-fidelity and high-fidelity prototypes. Some applications are data presentations such as Gantt charts for scheduling project activities, a screen showing room status for hotel reservation application, and a word processor for showing formatted texts in hundreds of pages. These kinds of user interfaces usually involve a significant amount of data. 26
2.4 Difficulties with prototyping Nowadays graphical editing tools such as Adobe Photoshop are still the most preferred tools for low-fidelity prototyping [Carter 2010]. With those tools, it is error-prone and time-consuming for a designer to draw data presentations. For instance, to draw a Gantt chart, a user interface designer has to convert an activity date into the position on the mock-up, and to convert the activity duration to the activity box's width on the screen, and so forth. Because data may be numerous, it is overwhelming to draw a graphical presentation.
It is much more time-consuming to develop data presentations with high-fidelity prototypes than low-fidelity ones. For example, a case study shows that a low-fidelity mockup takes 15-30 minutes to draw, while a high-fidelity prototype takes 8 hours per screen [Lauesen 2005]. If the designer overdevelops the functions required in usability tests, for instance, by making the functions more maintainable for future tests, it takes more time. Second, programming is required to develop high-fidelity prototypes.
Designers should gain solid programming skills to implement high-fidelity prototypes. Most designers rarely program sophisticated prototypes themselves [Myers 2008]. They have to ask for help from software engineers. In particular, designers report that it is much more difficult to prototype interactions than user interface appearance [Myers 2008]. Furthermore, some high-fidelity prototypes cannot be developed before the programming phase, because required system functions are unavailable. A system function will be programmed later by software engineers. For instance, the system function for calculating the critical path is not implemented yet when a user interface designer is designing the Gantt chart user interface. Third, programming is required to show real data. Realistic data presentation requires real data. It is important to fill realistic data on prototypes for testing. Researchers show that using real data in usability tests reveals usability problems much earlier than using artificial data. It is because 27
2.4 Difficulties with prototyping
users may encounter some real but extreme data [Genov 2009]. For example, a company name with 35 characters is extreme, but it happens in reality. Artificial data may not cover those extreme cases. Another reason is that the participants in the usability tests feel burdened by remembering fictional scenarios such as typing faked credit card numbers, etc, but they feel much comfortable with real data [Genov 2009]. Real data is necessary for testing whether the prototypical data presentation is suitable for the domain. For instance, with a hotel application, users need to see the relationship between room price fluctuation and room occupancy. Without real data, designers are unable to see if the prototype shows it in a usable way. Data can be presented in different ways. Should the designers present data in text forms, or curves, or bar charts, or other means? Designers should show real data on the prototype and conduct usability tests to decide the suitable presentation. However, programming is required to show real data, and it is unrealistic for a designer to imagine all real data, especially some extreme data. Consequently, the user interface designer usually shows imaginary data on prototypes. Last, prototypes with different fidelities are developed with different tools [Carter 2010]. Designers can produce low-fidelity prototypes with paper and pencils. More formally, graphical editing tools such as Adobe Photoshop are used to produce low-fidelity prototypes with realistic appearance [Carter 2010]. Designers use presentation software such as Microsoft PowerPoint to develop medium-fidelity prototypes [Carter 2010]. Medium-fidelity prototypes are clickable to show the flow of screens. High-fidelity prototypes are functional. Designers have to program to develop high-fidelity prototypes [Carter 2010][Myers 2008]. The most preferred programming environment for prototyping is Adobe Flash and Microsoft Expression Blend [Carter 2010]. Those difficulties are also barriers for software engineers to follow the classical usability approach. We will explain how software engineers 28
2.4 Difficulties with prototyping develop software and why they do not follow the approach in practice.
2.5 Problems with ensuring usability in the waterfall model In this section, we will explain why software engineer working in the waterfall model cannot follow the classical usability approach. The waterfall model is a widely used software development process [Sommerville 2006]. Figure 8 shows that the model consists of several phases including analysis, design, programming, integration, testing and operation. In the waterfall model, the development process does not enter into the next phase until the current phase is completed. We will explain how software engineers deal with usability and the problems in design, programming, and testing. In the system design phase, software engineers may not carry out usability tests. In this phase, software engineers design the system in terms of functions and data rather than the user interface. For instance, they decompose a system solution into the functions and objects that will be implemented rather than the user interface components, because many functions do not need user interfaces. Software engineers tend to think that it is unrealistic to design the user interface if functions are not implemented yet [Bä umer 1996]. Thus, user interfaces for a full system are either designed in parallel with other system development [Sommerville 2006], or is delayed to
Figure 8–the waterfall model
29
2.5 Problems with ensuring usability in the waterfall model
the end of development. Some software engineers may argue that prototypes are produced in this phase. However, those Software Engineering prototypes are low-fidelity. They show only a few screens of the system rather than the full system. The purpose of producing those prototypes is to elicit user requirements [Bygstad 2008] and to explore design directions, rather than making user interfaces. Moreover, software engineers might be unaware that prototypes should also be usability tested in this phase. It is widely known that prototypes are used to collect requirements and solicit user feedbacks in the early development phases, but few software engineers know that prototypes can reveal many usability problems with usability testing. The object-oriented programming approach may inhibit an early user interface design, because objects are obstructs between data and its presentation. In object-oriented programming, software engineers do not directly access data from the database. Instead, they access data from objects, because the database contents are encapsulated in objects. In the system design phase, software engineers do not have a complete class design. It is usually enriched and designed in the programming phase. Due to this encapsulation, it is not straightforward to see the data and data relationships, because some objects can be directly mapped to the underlying data such as data from a database. User interface design in an object-oriented background is to explore the ways of mapping objects on the user interface. There are some design patterns for data presentation. For example, single-axis scatterplots and bar charts are common techniques to visualize linear data. If data is in a networked structure, graphs such as concept maps and mind maps are possible ways. If data is hierarchical e.g. File System, a tree view is a common presentation. With an incomplete class design, it is difficult to map data on the user interface. Furthermore, intermediate objects further obscures mapping between data and user interface. For instance, some objects transform raw data into intermediate structures. Those intermediate data deviates from the original structure and format. The designer must decide which data he should map, the original or 30
2.5 Problems with ensuring usability in the waterfall model the intermediate one. As a result, software engineers may not design user interface early in the object-oriented approach.
As a result, software engineers may not design user interface early, and usability testing is ignored in the design phase. During the phases of programming, software engineers may not conduct usability testing, due to prototyping difficulties that programming is required for interaction and real data. In this phase, software engineers program user interfaces based on designers' deliverables. Designers report that current tools are programming-intensive to use [Myers 2008]. Nowadays, the most preferred deliverables for user interface design are still low-fidelity prototypes with length documents [Myers 2008][Carter 2010]. Usually low-fidelity prototypes describe user interface screens. Those screens are static, and thus cannot respond to user's interactions. Designers write documents to explain how software behaves when the user manipulates the screens [Myers 2008]. Those deliverables cannot be used for testing interactions. The situation is that many interactions are not prototyped until the end of programming [Myers 2008]. As a result, software engineers cannot prototype user interface with real data and interactions, and usability testing is ignored in the programming phase. During the phases of testing, usability testing may be ignored either. Software engineers carry out various tests, such as unit testing and release testing, to ensure that functions work properly and few bugs exist, but these tests can seldom reveal usability problems. At the end of development, software engineers rarely consider usability testing. If someone asks usability specialists to perform usability tests in this phase, the result is that plenty of usability problems are found [Lauesen 2005]. Few people know how to fix these usability problems, except some problems that can be fixed by changing texts, restructuring screens, etc. [Lauesen 2005]. Software engineers would have to redesign the software product to correct
31
2.5 Problems with ensuring usability in the waterfall model
some of the critical usability problems. It is too costly to correct usability problems at this point of time, and time is running out. In summary, the classical usability approach is not followed in the waterfall model. Software engineers may delay user interface design until the other work is finished. For example, in the object-oriented programming, the user interface design cannot be started until the class design is finished. Moreover, it requires programming to prototype user interface with real data and interaction. As a result, usability testing is carried out just before the software product delivery. The result is poor software usability.
2.6 Difficulties with ensuring usability in agile methods In this section, we will explain why software engineer working in agile methods cannot follow the classical usability approach. Agile is an umbrella term. There are many variants of agile methods. Some say that requirements, design and programming are concurrent in agile methods [Sommerville 2006]. Some say that the requirements phase may be missing and the others are carried out in sequence [Blomkvist 2005]. But all agile methods share some core principles such as incremental development, customer involvement for testing, etc. Incremental development produces a serious of software releases before the entire system delivery [Sommerville 2006]. Each release has full functionality and may be put into use, but a release is only a subset of the final system. Users test the release and give feedback for the future releases. A later release is built on previous ones. The last release covers all features and functions. Software engineers may follow the waterfall model to develop each small release [Lauesen 2005]. Many researchers investigated how to improve software usability in the agile field. They agree on many development principles such as incremental development. However, they have much debate on whether prototypes should be built. Some researchers suggest that, in agile methods, iterative user interface design should be done before 32
2.6 Difficulties with ensuring usability in agile methods any programming [Ferreira 2007], which is the same as the classical usability approach from Usability Engineering. Other researchers suggest that the agile team produces working software with minimal functionality, and do not produce prototypes [Ferreira 2007]. Then the team tests the working software with the users to gather feedback. Problems will be corrected in the next iteration. Researchers explain that it is to avoid "Big Design Up Front, suggesting that the more the design is determined up front, the more difficult it is to change later on" [Ferreira 2007].
The cause of the debate on whether to build prototypes is that traditional prototyping techniques are not suited to the agile methods. There are two reasons. First, prototypes are not intended for deployment, but agile methods deploy software products very early. Most agile methods such as Scrum, eXtreme Programming (XP), etc. reuse previous software releases in the incremental development. However, in the classical approaches, user interface prototypes rarely evolve into the final user interface [Sommerville 2006][Constantine 1999][Lauesen 2005]. Some sensible parts of the prototypes should be reusable, but are not reused in practice. Prototypes are usually thrown away or reprogrammed. For instance, with a data presentation, engineers should reuse the functionality for representing data. But prototypes do not connect to a database for real data. Instead, designers draw some artificial data on the prototypes. Consequently, prototypes are not reused in the actual software. The waste of prototypes results from a prototyping difficulty – different tools for developing prototypes in different fidelities. For low-fidelity prototypes, programmers transform the prototypes, such as paper prototypes, into code. For high-fidelity prototypes, programmers usually reprogram the functions to make the software stable, secure, maintainable, etc. Or prototypes are developed in a different platform, and it is difficult to implement the same appearance and interaction. For example, high-fidelity prototypes are usually developed in Adobe Flash [Carter 2010]. In Adobe Flash, it is very easy to realize a shape transformation from a rectangle to a 33
2.6 Difficulties with ensuring usability in agile methods
circle. However, such shape transformations are quite difficult to implement in .NET Windows Forms. Usually much code in high-fidelity prototypes is wasted. As a result, software engineers start user interface development from scratch, or they redo parts of the work that designers have done [Chatty 2004]. Second, in agile methods, a working software product is developed in short iterations. For example, in Scrum, an iteration lasts 30 days. In UP, an iteration lasts 2-6 weeks. In XP, it takes one week. It means that, for example in XP, a working software release should be produced in one week. So in agile methods, prototypes should be produced rapidly so that usability tests can be carried out early, but, as we discussed in the prior section, it is time-consuming to prototype data presentations with both high- and low-fidelity prototypes. Due to those two difficulties, the traditional prototyping techniques turn out to be insufficient in the agile approach. Apart from the insufficient prototyping techniques, usability testing is missing in agile methods. Researchers point out that software engineers working in the agile methods should be easier to do usability testing than in the traditional waterfall model. "The completion of iterations and releases were seen as valuable opportunities to test the usability of the real working software" [Ferreira 2007]. Unfortunately, typical agile tests are not usability tests, because expert users participate in agile tests. Expert tests are not typical users [Bygstad 2008]. The purpose of typical agile tests is to find problems with functionality such as finding bugs, acceptance testing for features, etc. Expert users are good candidates for typical agile tests. However, expert users should not participate in usability tests. "Testing with real users is the most fundamental usability method and is in some sense irreplaceable, since it provides direct information about how people use computers and what their exact problems are with the concrete interface being tested"[Nielsen 1993]. Why cannot an expert replace a real user? It is because an expert user is aware of what functions the system provides and how to use them. 34
2.6 Difficulties with ensuring usability in agile methods A real user does not know that. If a system is intended for novice users, usability testing with expert users will miss some usability problems because of their familiarity with the system. Some expert users may participate in the system development and they know what the system is doing. As a result, when testing the system, an expert user may not observe the problems that a real user encounters. For example, payment processing in an e-commerce website usually takes longer time than ordinary operations. If the system gives no response for some time and does not give any hints about the payment processing status, a real user may mistakenly click the pay button several times, which results in duplicate billings. An expert user may not observe that usability problem, since the expert user knows that it is a long operation. For instance, the system may communicate with the server on another continent, back up the transaction, etc.
In summary, in agile methods software is deployed and produced rapidly. Traditional prototypes are not intended for deployment and may not be created fast enough in the agile background. Apart from those, expert users' involvement in the tests cannot reveal usability problems with typical users. Therefore, software with good functionality can be still unusable to use [Lee 2007].
2.7 Graphical presentation – a problem amplifier
35
2.7 Graphical presentation – a problem amplifier
Graphical presentations are a problem amplifier. In this section, we explain the difficulties with following the classical usability approach for developing graphical presentations. Simple user interfaces are tables and forms with texts. For example, Figure 9 shows screenshots from commercial systems. One shows lab results in text-based presentations. The other shows medication records as a simple user interface by means of a table with texts. Graphical presentations show data by means of color, size, shape, etc. Figure 10 shows medicine prescription records with a graphical presentation. The medicine overview utilizes a timescale metaphor and resembles the famous LifeLines [Plaisant 1996]. There are white
Figure 9–An example of simple UIs
36
2.7 Graphical presentation – a problem amplifier boxes below the timescale. Each box corresponds to a medicine prescription. To show which medicine a box represents, the form aligns the box to its respective medicine name. The left position of a medicine box is aligned to the starting date according to the timescale. The width of a medicine box indicates the length of the prescription.
Graphical presentations help the user derive information from data. Data alone is not information and lacks meaning [Green 1996][Mazza 2009]. "Data must be presented in a usable form before it becomes information, and the choice of representation affects usability"[Green 1996]. Graphical presentations are a good choice to present data, as it
Figure 10–An example of advanced visualizations developed in VisTool
37
2.7 Graphical presentation – a problem amplifier
can boost the cognitive process of developing mental models of data [Card 2005]. Cognitive psychology uses the term mental model to describe how we build knowledge [Mazza 2009]. In a broad sense the term mental model is something in our mind about the external world [Lauesen 2005]. Research shows that visual properties such as color, shape, etc. help us build a mental model of data, and we expand the mental model and then produce the information [Spence 2000]. Research also confirms the graphical presentations' effectiveness in boosting cognitive processes. An empirical study shows that diagrams are more expressive than textual descriptions [Larkin 1987][Mazza 2009]. As an example, previous research shows that the Lifelines has many advantages over the text-form presentation such as "Reduce the chances of missing information", "Facilitate the spotting of anomalies and trends", "Streamline the access to details", etc [Plaisant 1996]. In this sense, graphical presentations can be an effective means of improving a user’s task efficiency. Note that task efficiency is a usability factor. Furthermore, a graphical presentation can better present an overview than textual descriptions. Psychologists find that some activities require our full attention [Lauesen 2005][Baumeister 2010], which means that when we are doing them, we cannot do other things that also require full attention. For instance, reading texts and talking are activities that require our full attention. We cannot read texts and talk at the same time. Nygren observed activities that “we can do while doing something else” [Lauesen 2005]. Nygren defined them as automatic activities. For instance, walking is an automatic activity, because we do not consciously control the movements of our legs and feet [Baumeister 2010]. Reading a graphical presentation is an automatic activity, since our retina is quite sensitive to visual properties e.g. shapes, color, etc. [Mazza 2009]. We can see a graphical presentation at a glance. Graphical presentations take many forms. The simplest form is traditional business graphics such as pie charts, line graphs, radar views, etc. They can be easily created by means of spreadsheet applications, business report systems such as CrystalReport, etc. More 38
2.7 Graphical presentation – a problem amplifier sophisticated graphical presentations are within the Information Visualization field. Researchers in the field invent many techniques to visualize data. The techniques improve a user's task efficiency of exploring and analyzing data [Ahlberg 1994][Shneiderman 1994]. For example, the dynamic querying technique allows a user to adjust "a query (with sliders, buttons, and other filers) while continuously viewing the changing results" [Ahlberg 1994]. Research proves that it improves a user's performance significantly and results in a high level of user's satisfaction when a user is exploring database contents [Ahlberg 1994][Shneiderman 1994].
However, after introducing graphical presentations into the design, the difficulties with following the classical usability approach become more severe and acute. The root cause is that it is costly to prototype and program graphical presentations. First, it is hard to implement graphical presentations. Unlike traditional user interfaces, a graphical presentation can be highly interactive. For instance, in the medicine overview example (Figure 10), a user can drag on the timescale to expand and shrink the period on the timescale. When the user is dragging, medicine boxes are realigned and the sizes of the boxes are changed by means of the timescale. When the user prefers a narrow span of period (e.g. one week), medicine boxes scatter sparsely on the screen. When the user prefers a wide span of period (e.g. one year), many boxes can clutter the screen. This dragging interaction enables the user to see the changing density of the medicine boxes on the available screen. The user will be able to stop dragging when he feels satisfied with the density. This kind of interactions is non-trivial and requires substantial efforts to implement. Second, it is more programming intensive to develop a high-fidelity prototype with a graphical presentation than a simple user interface. Graphical presentation development usually requires solid programming skills. Some development work is low-level graphical programming such as drawing pixels for the presentation e.g.: arc, shape, etc [Tissoires 2011]. Apart from those, it requires that the developer should be aware of accessing data, processing data, data 39
2.7 Graphical presentation – a problem amplifier
structure, algorithm design, etc. to develop a realistic presentation for data [Tissoires 2011]. Graphical presentations make this programming requirement more demanding, because they make the code more complex. If the prototype with graphical presentations will be intended for deployment, programmers should apply suitable programming patterns. Otherwise, the code will be unmanageable [Beaudouin-Lafon 2003]. Such skilled programming is done by seasoned software engineers. Consequently, the difficulty with developing graphical presentations may inhibit usability testing, because user interface designers are incapable of developing a graphical presentation. Note that many designers have limited programming knowledge [Tissoires 2011]. Some designers may be willing to program, but their role is to design rather than implement it [Carter 2010]. Thus, designers cannot determine if the preferred graphical presentation is useful and usable for the specific domain and users. However, "visualizations are often a critical presentation method for complex information systems. There is a need, therefore, to study the usability of specific ways of visually representing specific types of data for specific types of users"[Redish 2007]. Some readers may argue that systems such as Microsoft Expression Blend provides common graphical library to support some kinds of graphical presentations. However, the designers cannot develop a non-built-in presentation with such tools. After usability testing, the designer cannot make radical changes on the presentations either. Usually, software engineers program their own graphical library to fulfill their needs, which is beyond a designer's ability.
2.8 Research goal Researchers conclude that user interface development tools are important to the success of developing usable user interfaces, because development tools reduce the time of user interface development, and hereby allow for more iterations for iterative design [Myers 2000]. Research confirms that in practice designers desire a tool that enables 40
2.9 Research goal
rapid prototyping and interaction [Carter 2010][Myers 2000][Myers 2008]. We outlined that there is a large gap between low-fidelity prototyping tools and programming tools. Designers can use low-fidelity prototyping tools, but cannot develop user interfaces with interactions and real data. Programming tools used by software engineers are powerful, but designers cannot use them. More precisely, this is a gap between what a designer needs to do and what a designer can do. My research goal is to invent a tool to bridge this gap. The research questions are (1) Is it possible to develop user interfaces and customized visualizations with spreadsheet-like formulas? (2) Is this formula-based approach accessible to user interface designers?
41
Chapter 3 Previous research and tools There is little research in development tools that allows for the classical usability approach in Software Engineering. Many tools [Kieras 1995][Brinck 2002][Arroyo 2006] proposed from usability research are used for usability evaluation rather than user interface development. There are many user interface development and prototyping tools [Sa 2008][Signer 2007][Klemmer 2000][Bostock 2009] invented from research and industry. However, these tools are generally programming-intensive or build non-functional prototypes. It is quite difficult to integrate non-functional prototypes into the software product. So we do not discuss those tools here. In this chapter, we will review tools and development methods that can be used to support the classical usability approach. Some tools are programming-free, but they generate poor user interfaces. In general we can categorize them into model-based and programming-based approaches. Both of them provide means of reducing development efforts.
42
3
Previous research and tools
Figure 11–Expression Blend user interface
43
3.1
State-of-the-art tools
3.1 State-of-the-art tools Microsoft Expression Blend is the state-of-art tool based on the scripting+component+interface builder approach. It is a user interface development tool on Silverlight and Windows Presentation Foundation (WPF). It is one of the mainstream user interface development tools. Silverlight and WPF separate user interface specifications from programming. The platform combines user interface specification files (XAML) and functional code files (e.g. C# files) to produce software. XAML is an extensible scripting language. The user interface of Expression Blend is shown in Figure 11. Expression Blend provides existing components e.g. Border, BulletDecorator, Button, etc. and some drawing tools such as the brush tool, the timeline panel, the color pallets, etc. In Expression Blend, a designer drag-and-drops components to paint the screen, and uses drawing tools to specify user interface properties such as Color. Expression Blend generates user interface specification (XAML) behind the scene. For instance, a designer can specify a background in gradient colors by means of the Brush tool and the color pallets. The designer can drag the user interface on the design surface to change the component's size and position, and Expression Blend modifies the XAML behind the scene.
Figure 12–An example of a simple UI
44
3.1 State-of-the-art tools
With the interpretive user interface specification language (i.e. XAML) and the interface builder, a designer can see the resulting user interface appearance when he is designing. Functional code (e.g. C#) programs interactions. This separation of user interface specification and functional code allows user interface designers and software engineers to work independently. With Silverlight and WPF, user interface designers focus on graphical design such as drawing screens. It means that, in principle, user interface designers can ignore interactions. Programming the interactions can be left to the software engineers. An interesting approach in Expression Blend is data templating for presenting data. In Silverlight and WPF, data is objects. With Expression Blend, the designer should know two concepts to build a data presentation: data templates and data binding. A data template "describes the visual structure of a data object" [Microsoft Data Template]. Data binding binds data to the control properties. We will show an example to explain data templates and data binding. Figure 12 is the screen that we develop. It presents several objects
for medicine prescription. A row corresponds to a prescription object. The code for the prescription class is shown in Figure 13. Expression Blend does not generate this code. Usually software engineers design this kind of classes for data in software design phase.
45
3.1 State-of-the-art tools public class Prescription { public string medID;// medicine ID public int length; public DateTime startTime; } Figure 13. An example of the class for data
The essential step is to create a data template. With Expression Blend, a designer can define a data template to combine various controls to present an object. The author does not find a way to draw a data template automatically with Expression Blend, so he manually writes the code for the data template. The template code is shown in Figure 14. The result screen for that data template is Figure 12. This template specifies a grid to present a prescription object. The grid holds columns for showing medicine IDs, the starting dates and the prescription lengths. The first column holds a label control to show the medicine ID. The second column holds a date time picker to show the prescription length. The third column holds a label to show the starting date. Note that a data template does not contain functional code. For example, it does not include the functions such as accessing data, transforming data, etc. Data binding is used to present object properties by means of user interfaces. The code in line 1 Content="{Binding medID}" binds medID of the class Prescription (Figure 13) to the Content property of the label. So the label shows Prescription medID. Similarly, line 2 binds length to the Slider's Value, and line 3 binds startTime to the DatePicker's SelectedDate. However, if the designer needs more complex data binding such as binding to an arithmetic expression, he has to program. To show multiple objects, the designer has to use a control that creates multiple instances and attaches the data template to that control. With WPF and Silverlight, only a few controls support the 46
3.1 State-of-the-art tools
1 2 3 4 5 6 7 Figure 14 an example of data template
multiple-instance feature. To implement the screen shown in Figure 12, we used an item control. An item control presents objects vertically. The designer may program an ObjectDataProvider to access data from the database, and sets the provider to the item control. As a result, data templating shows several Prescription objects. Next, we discuss with Expression Blend what a designer can do in the waterfall model and agile methods. Expression Blend to some extent reduces programming cost by means of code generation. However, the generated code is for static user interfaces. For example, the user clicks a button, but the application does not respond. To build an interactive user interface, someone e.g. a programmer has to program.
47
3.1 State-of-the-art tools
Figure 15–A Scatterplot example developed in Expression Blend
Data templating and data binding allows a designer to develop several presentations for the same data. This approach may reduce programming effort, if the designer reuses the same functional code for accessing data, processing data, etc. For example, if we want to show the startTime by means of Labels rather than the DatePickers in Figure 12, we can simply change the data template and reuse the code for the ObjectDataProvider. However, the separation of user interface specification (XAML) and interaction code (C# code) still requires programming. Expression Blend does not generate code for basic interaction. A designer has to program event handlers. For instance, Figure 15 shows stock data only in five days. The designer should program an event handler for the interaction that shows the data in the next five days. In the author's opinion, this is a cognitive barrier to designers. Expression Blend usually generates another program file for event handlers. Microsoft calls them code-behind files. Those event handlers are programmed in general purpose languages such as C#, Visual Basic .NET, etc. 48
3.1 State-of-the-art tools
Conclusion: Interactions cannot be built in the design phase of the waterfall with Expression Blend. Interaction development still requires programming. The separation of user interface specification and functional code only allows the designer to build static user interfaces. A designer also programs to access real data, for example, data from a database. Let us see an example. Figure 15 shows a Scatterplot for showing stock data. A bubble represents a stock record. The size of a bubble presents the stock volume. The time line shows the time. A bubble's horizontal position represents the corresponding date according to the time line. Vertically, bubbles are aligned to an axis showing the prices. The data for that Scatterplot is artificial. In this example data is hardcoded in the program as shown in Figure 16. It shows only five StockData objects. Each object has properties date, public class StockDataCollection : Collection { public StockDataCollection() { Add(new StockData { Date = new DateTime(2008, 8, 4), Price=25.25, Volume=30 }); Add(new StockData { Date = new DateTime(2008, 8, 5), Price=26.25, Volume=70 }); Add(new StockData { Date = new DateTime(2008, 8, 6), Price=27, Volume=90 }); Add(new StockData { Date = new DateTime(2008, 8, 7), Price=27.5, Volume=20 }); Add(new StockData { Date = new DateTime(2008, 8, 8), Price=28.25, Volume=60 }); } } public class StockData{ public DateTime Date { get; set; } public double Price { get; set; } public int Volume { get; set; } } Figure 16–Programming code for the sample data
49
3.1 State-of-the-art tools
price, and volume. If the designer wants to show real data from the database, more complex code is needed. Some readers may argue that designers can create sample data by importing an XML file. However, sample data is not real data, unless it can reach the same size as the real data. In other words, sample data approximates the real data but loses details. With Expression Blend, programming is also required for processing data such as filtering, sorting, etc. For example, suppose that the designer has programed the application to retrieve data from the database for the Scatterplot (Figure 15). Now the designer wants to order bubbles according to the prices rather than in the chronological way. In that case, the designer needs to program to order the data. Conclusion: realistic data presentations cannot be built in the design phase with Expression Blend, because programming is still needed. As a result, designers cannot usability test interactions with
realistic data in the design phase. So with Expression Blend, the classical usability approach cannot be ensured in the waterfall model. In the author's opinion, the cost of developing an interactive user interface with Expression Blend is very high to a non-programmer. There are large cognitive gaps between the screen, the user interface specification, and the interaction code. The designer must grasp many technical details to develop an interactive user interface. Conclusion: Expression Blend does not support rapid-prototyping in agile methods due to much programming needed. It is quite dubious whether the prototypes are deployable, as interactions are not implemented.
50
3.1 State-of-the-art tools
With Expression Blend a designer can develop simple user interfaces as well as a few advanced graphical presentations. The platform provides built-in controls for popular graphical presentations such as pie charts, Scatterplot, etc. For example, to implement the Scatterplot in Figure 15, a designer drags a Scatterplot control from the drawing tools. Then he switches to the property panels to configure some properties in the property panel to bind the data to the BubbleSeries' properties. The generated XAML for that Scatterplot is shown in Figure 17. For example, the code at line 6 in Figure 17 binds the Price property to the bubble's horizontal position. The designer can either configure the data binding in the property panel or write the XAML code in the XAML view panel. Although the tool allows a designer to 1 2
3
10 11
12
13 /> 14
…… Figure 21–A social network visualization
Figure 22–A snippet of the XML data
In this example, the programmer applied an operator to the presentation. It rounds the corners of personal boxes. Prefuse performs some other operations on the data such as generating Visual Items. Visual Mapping Transformation: the programmer should specify Action objects in this step. 1. int[] palette = new int[] { ColorLib.rgb(255,180,180), ColorLib.rgb(190,190,255) }; // map nominal data values to colors using our provided palette 2. DataColorAction fill = new DataColorAction("graph.nodes", "gender", Constants.NOMINAL, VisualItem.FILLCOLOR, palette);
59
3.2.2 Prefuse – a development toolkit for visualizations with realistic data // use black for node text 3.
ColorAction text = new ColorAction("graph.nodes", VisualItem.TEXTCOLOR, ColorLib.gray(0));
// use light grey for edges 4.
ColorAction edges = new ColorAction("graph.edges", VisualItem.STROKECOLOR, ColorLib.gray(200));
// create an action list containing all color assignments 5.
ActionList color = new ActionList();
6.
color.add(fill);
7.
color.add(text);
8.
color.add(edges);
9. ActionList layout = new ActionList(Activity.INFINITY); 10. layout.add(new ForceDirectedLayout("graph")); 11. layout.add(new RepaintAction()); // create a new Display that pull from our Visualization 12. Display display = new Display(vis); 13. display.setSize(720, 500); // set display size 14. vis.putAction("color", color); 15. vis.putAction("layout", layout); 16. JFrame frame = new JFrame("prefuse example"); // ensure application exits when window is closed 17. frame.setDefaultCloseOperation(JFrame.EXIT_ON_CLOSE); 18. frame.add(display); 19. frame.pack(); window
// layout components in
20. frame.setVisible(true); // show the window 21. vis.run("color");
// assign the colors
22. vis.run("layout"); // start up the animated layout
60
3.2.2 Prefuse – a development toolkit for visualizations with realistic data Prefuse actions are operators. Some operators are applied on Visual Items (i.e. Visual Abstraction). For instance, at line 2, fill is an operator applied on Visual Items to change background colors. Some operators are applied in the presentation. For example, ForceDirectedLayout at line 10 and RepaintAction at line 11 are applied on the presentation. According to the Data State Reference Model, another important step is to show the presentation of Visual Abstraction. With Prefuse, this is done by creating a display object at line 12 and adding the display into a frame at line 18.
In summary, Prefuse eases visualization programming. A programmer composes operators in the visualization pipeline to implement the desired visualization. Next, we see what Prefuse can support in Software Engineering. Prefuse applies the operator-centric approach from the Data State Reference Model. In principle, a clear classification of operators reduces some code. It is because "between two operators, the more operationally similar they are to each other, the more actual code they can share" [Heer 2005]. Furthermore, Prefuse simplifies data transformations. For example, it automatically converts the source data to Entitles and further converts them to Visual Items for presentation. Interactions are implemented by programming Java event handlers. Furthermore, Prefuse provides many useful operators for interactions such as zooming, animation, etc. Prefuse handles real data. It provides APIs to access databases and a SQL-like query language to process data locally. Prefuse is designed for visualization development. It provides some built-in visualization patterns for graph, tree, and table. More visualization can be extended by programming. Apparently, the programming cost is less than general programming approaches. However, programming is non-trivial and expensive. It requires solid knowledge about Java and Prefuse library. As a result, it does not support the creation of prototypes in the design phase of the 61
3.2.2 Prefuse – a development toolkit for visualizations with realistic data
waterfall. Nor does it support rapid prototyping in agile methods. So the classical usability approach cannot be followed in Software Engineering
3.3 Model-based prototyping tools Volere is a model-driven prototyping tool [Memmel 2008]. The tool supports user interface designers, programmers, and domain experts to collaborate on the user interface development. User interface code is generated from various models. The tool provides a GUI-layout model for specifying the user interface, Content model for specifying data that are shown, and Behavior model for user interface interaction. User interface designers and domain experts work together on the GUI-layout model and the Content model. The tool provides a visual domain specific language for specifying the GUI-layout model and the Content model. The language is used by domain experts. The language uses the concepts that domain experts are familiar with. Programmers define the Behavior model. Volere tries to solve the problem with user interface development from the requirement engineering perspective [Memmel 2008]. It proposes incremental development with the tool. However, the main purpose of Volere is to check if requirements are fulfilled rather than early usability testing. Thus, it may still be expensive to fix usability problems such as changing the screen details, because it requires changes in different models. Probably, user interface designers, programmers and domain experts will all be involved for making the changes. Elkoutbi proposed user interface prototyping by means of UML scenarios [Elkoutbi 2006]. The approach is to generate user interface code from UML artifacts such as class diagram, use case diagram, collaboration diagram, etc. The idea is to find user interface-related objects such as interface object, interface message, and constraints in the class diagram. The tool generates the screen based on some rules. For instance, a rule defines that the tool generates a textfield widget if "an input Data constraint with a dependency to an attribute of type String, Real, or Integer" [Elkoutbi 2006]. The screen navigation is 62
3.3 Model-based prototyping tools
generated by means of pre- and post- conditions of class methods, which involves several UML diagrams such as a use case diagram and a collaboration diagram. This prototyping tool reduces the efforts of user interface programming. However, the usability of the generated user interfaces is quite problematic. It is because the tool relies on user interface-generation rules to generate user interfaces automatically, but those "one-size-fits-all" rules cannot ensure usability in a specific case. If the user wants to modify the generated user interfaces, he has to change the rules rather than the user interface. It can take more effort to do it in an iterative design. In summary, the model-based approaches raise the level of user interface development. A user interface developer uses high-level models such as UML diagrams to develop a user interface instead of low-level programming. Most tools provide basic functionality such as screen navigation, and can integrate more functions by revising the model. Some approaches provide support for real data, some do not. User interface developers may need to find a way to program and integrate code for handing real data with the tool. For the first time use, the cost is low. However, it is quite problematic the approaches generate usable user interfaces. "Model-driven approaches represent a move away from the user-centered design, reducing user involvement to that of the users being informants rather than co-designers"[Bengt 2003]. Another problem is that it is expensive to fix usability problems. After usability testing, the designer must find usability problems. However, it is difficult to revise the generated user interface in the model-based approach. The user interface developer has to change user interface generation rules or high-level models. The complexity of models themselves hinders developers to make changes easily, because "changing a specific model must consistently affect dependent models"[Memmel 2008]. To the author's knowledge, no model-based or model-driven approach provides support for advanced visualization development. 63
3.3 Model-based prototyping tools
Consequently, it is problematic to use model-based approaches to design and implement prototypes in the design phase of the waterfall model. Rapid prototyping might be supported in the agile methods. However, the generated user interfaces cannot fulfill all needs from software engineers, and it is quite difficult to change the generated user interfaces.
64
Chapter 4 VisTool Introduction 4.1 An example scenario We will use an example to show how a designer uses VisTool to develop an application. A hospital has an existing patient health record system, but they want a better user interface. The designer knows Shneiderman's Lifelines [Plaisant 1996]. Lifeline is a renowned visualization that presents an overview of patient records. It is shown in Figure 23. The designer is inspired by it and wants to make something like it.
Figure 23–Lifelines visualization
65
4.1 An example scenario
Figure 24–ER model of the example scenario
The existing database contains four essential tables, tblPatient, tblMedOrder, tblMedIntake, and tblMedType. Figure 24 shows the ER model. TblPatient stores personal information about patients. TblMedOrder stores prescribed medicine treatments. TblMedIntake stores records of medicine intakes. TblMedType stores a record for each type of medicine. A software engineer or the designer has prepared a data map. The data map is a plain text file that tells VisTool the table relationships in the database and where the database is. For instance, in the data map the relationship relMedOrder tells VisTool that it corresponds to the one-to-many relationship from tblPatient to tblMedOrder in the ER model (Figure 24). The designer decides to develop a functional user interface prototype. He will review it with the end users and improve it iteratively.
4.1.1 The design phase The designer selects the data map and opens it. VisTool Studio opens and the screen looks like Figure 25, but the Lifeline form is not there yet. The Lifeline is the screen that the designer will develop 66
4.1.1 The design phase iteratively. VisTool Studio contains several panels. The Design Panel shows what the end user will see. The Toolbox shows available controls. The Property Grid shows properties and formulas. The Solution Explorer shows project files.
The first steps of using VisTool are similar to other mainstream tools for user interface development such as Visual Studio and Eclipse.
Figure 25–VisTool Studio
67
4.1.1 The design phase
Step 1. Create a form: The designer drags a form item from the Toolbox, and drops it on the Design Panel. As a result, VisTool creates an empty form and shows it in the Design Panel. The designer uses the Property Grid to set the Text property, which defines the heading of the form: Form Text: "Health overview"
VisTool updates the screen immediately when the property is changed, and the designer can see the heading text. Step 2. Bind the form to a patient record: The designer sets the form's DataSource property to get a patient from tblPatient in the database: Form DataSource: tblPatient where ptID = 1
PtID is a
tblPatient field. In the first prototype, the designer uses patient 1. In the later versions, the user should be able to select the patient. When the DataSource is specified, VisTool retrieves the corresponding records from the database and creates a form per record. In this example, only one form is created. The Design Panel refreshes the screen immediately, but in this case the screen does not change.
Step 3. Insert the patient name: The designer drags and drops a label item on the form, and sets the Text formula: Patient label Text: parent.ptName
The label becomes a child of the form. The Text formula tells VisTool to first get the form's record (parent) and then access the record's ptName. Now the screen shows the patient name on the top-left corner of the form.
68
4.1.1 The design phase Step 4. Create a timescale: The designer drags and drops a timescale item on the form. He will refer to the timescale from other controls, so he renames it:
Timescale Name: timeScale
Until step 4, VisTool is similar to the mainstream tools for user interface development. However, the next steps show something new. Step 5. Show medicine names: The designer wants to show the medicine names prescribed to the patient. He drags and drops a label item on the form. The designer will refer to it in later steps, so he renames it: Medicine label Name: lblMedName
The designer knows that medicine records are in tblMedOrder, and medicine names are in another table tblMedType. He needs that the label repeats itself for each medicine record. To achieve it, he sets the DataSource formula: Medicine label DataSource: parent -< relMedOrder >- relMedType
The formula tells VisTool to start from the patient record (parent) and then select all tblMedOrder records that belong to that patient (--) to the record. These medicine records make up a bundle. As a result, VisTool creates one label for each medicine record. Parent means the form's record. RelMedOrder is a one-to-many relationship from tblPatient to tblMedOrder. The join-many (--) symbolizes the many-to-one. The designer can use dot (.) operators instead of the join-many (--), but it makes the formula difficult to read. 69
4.1.1 The design phase
VisTool shows all medicine names on top of each other, so the designer can see only one of them. It is because the designer has not specified the position yet. Step 6. Set medicine label position and content: The designer specifies the Top formula, which is the pixel position of the label: Medicine label Top: 80 + Index * (Height + 5)
A control has an index inside the bundle. The first control has index zero, the second is one, and so forth. VisTool evaluates the Top formula for each medicine label. Now the screen shows them as a column of labels. The labels must show medicine names. The designer knows that medicine names are from the field medName in tblMedType. So he specifies the Text formula: Medicine label Text: medName
VisTool automatically figures out which table show the resulting screen in Figure 26.
medName is from. We
Step 7. Show medicine boxes: The designer creates a box. There should be one box for each medicine label. So the designer leaves DataSource unspecified, and specifies that Parent is lblMedName. Medicine box Parent: lblMedName DataSource:
70
4.1.1 The design phase
Figure 26–Medicine name labels
In this case, the box refers to the medicine labels that have medicine order records. VisTool automatically repeats the box for each parent, but at present the boxes are on top of each other. Each box represents a medicine order. Step 8. Bind box position to the label: To show which medicine order a box represents, the designer aligns the medicine box Top to the
corresponding medicine label (parent). Medicine box Top: parent!Top
This formula tells VisTool to select the medicine label (parent) and then selects its Top value. The bang (!) indicates that Top is a property. Now the screen shows the boxes as a column. The designer aligns the boxes by means of the timescale. He specifies the Left formula: Left: timeScale!HPos(startTime)
71
4.1.1 The design phase
Figure 27–The first prototype
The formula tells VisTool to select the timescale and then call the method HPos. The bang (!) calls HPos, which transforms the starting date (startTime) to a pixel value on the screen. As a result, VisTool aligns the left position (Left) of the medicine box to the starting date (startTime) according to the timescale. Starttime is a tblMedOrder field. It records the start time for each medicine order. The designer uses the medicine box width to show the length of the treatment. He specifies the Width formula: Medicine box Width: timeScale!HPos(length + startTime) - Left
Length is a tblMedOrder field. It records prescription length for each medicine order. The formula length + startTime calculates the
termination time of the medicine order. HPos transforms the termination time into the pixel position on screen. The width is the subtraction of that pixel from Left position. The Windows platform only allows the designer to specify Top, Left, Height, and Width. Right and Bottom exist, but they are read-only. 72
4.1.1 The design phase
The designer also paints the medicine box blue: Medicine box BackColor: "Blue"
4.1.2 The first prototype The designer has already finished the first prototype. The screen is shown in Figure 27. He reviews the prototype with users and checks that they understand it. During the review, the user wants to see another patient with more complex medicine prescriptions. The designer changes the constant for the health overview form's DataSource which was specified in step 2. The review result is that the prototype presents a good overview for medicine orders, but there are some problems. For example: No medicine intakes: A doctor complains that he cannot see the intakes for the medicine orders. Actually, the intake records are in the existing database. No way to select the patient: The prototype shows only one patient. A doctor cannot select the other patients.
4.1.3 Improve the prototype The designer decides to add the medicine intakes. He opens the prototype with VisTool Studio. Step 9. Create intake bars: The designer wants to use small bars inside a medicine box to show intakes for that medicine. He creates a box and drags it to make it narrow. He knows that the intake records are in tblIntake, and there will be several intake bars inside each medicine box, because a patient takes the medicine several times during the treatment. So he sets Parent and DataSource: Intake bar Parent: medicineBox
73
4.1.3 Improve the prototype DataSource: parent -< relIntake
This formula tells VisTool that for each medicine box (parent) start in the tblMedOrder record and then select tblIntake records that are related to that tblMedOrder record. These intakes make up a bundle. So there is one bundle for each medicine box (parent). As a result, boxes are created, one box per medicine intake record. Step 10. Set intake bar position and appearance: The intake bars should also be aligned to the timescale. The designer knows that intake time is stored in the field time. So the designer sets Left: Intake bar Left: timeScale!HPos(time)
Afterwards, the designer aligns the intake bar to the medicine box: Intake bar Top: parent!Bottom – Height
The designer uses the bar's Height to present the intake dosage: Intake bar Height: amount * 6
Amount is a tblIntake field.
Figure 28–The patient-search form
74
4.1.3 Improve the prototype The designer uses different colors to show intake states:
Intake bar BackColor: state = 1 ? "Green" : state = 2 ? "Yellow" : state = 3 ? "Red" : "Black"
State is a tblIntake field. It records whether an intake is taken, planned or canceled. The screen now shows intake bars inside medicine boxes. Next, the designer will fix the problem with selecting the patient. The designer creates a patient-search form for selecting a patient. The screen is shown in Figure 28. It shows a list of patients whose name contains the text jo. The list shows patient names and addresses. The end user types in the textbox to search the patient, and clicks the button to see the health record for that patient. Step 11. Create the patient-search user interface: In the same way that we have seen, the designer creates the form, a text box for searching patients, a label for showing patient information, and a "See" button for selecting a patient. The designer knows the patient information is in tblPatient and the label must repeat itself to show different patients, so he sets the patient label DataSource and Name: Patient label DataSource: tblPatient where ptName like "'%" & txtName!Text & "%'" Name: PatientLabel
This formula is a wildcard search for tblPatient records based on the user's input. PtName is a tblPatient field. TxtName is the text box for searching patients. TxtName!Text selects the value of the textbox txtName, which is the text the user has typed. The percent (%) matches any text. The ampersand (&) appends texts. Behind the scene VisTool generates a SQL query for the DataSource. In this case: SELECT tblPatient.ptName , tblPatient.address1 , tblPatient.ptID FROM tblPatient WHERE ptName like '%jo%'
75
4.1.3 Improve the prototype
The "See" button has no DataSource, but its parent is the patient label. As a result, each "See" button refers to a patient record (tblPatient). The designer also sets various properties such as Text, Top, etc. to specify the label's content and position. Step 12. Set Click event: When the user clicks a "See" button, the
health overview must open and show the corresponding patient. To achieve this, the designer sets the Click event handler for the "See" button: "See" button Click: openform("frmOverview", ptID) Parent:
PatientLabel
This formula tells VisTool that when the user clicks, it must open frmOverview and pass ptID to the form. Step 13.
Rename the health overview form and revise the DataSource: The health overview form Form Name: frmOverview DataSource: tblPatient where ptID = param[0]
Param[0] refers to the first parameter passed to the form. In this case,
there is only one parameter, which is ptID. When the form opens, param[0] is the value of ptID. As a result, the form shows the
corresponding patient. The user can click several "See" buttons to show several patients' health records at the same time.
76
4.1.4 The first release
77first release Figure 29–The
4.1.4 The first release
4.1.4 The first release The designer reviews each prototype with the end users, and improves them iteratively with VisTool. The designer fixes usability problems in several rounds. Finally, he has the first release. The first release consists of three forms, the patient search form, the medication overview form, and the biopsy testing form. The screens are shown in Figure 29. An end user types a patient name in the textbox at the top of the patient-search form. The form shows the search result immediately when he presses a key. He clicks a patient name to show the overview form. The medication overview is inspired by the Lifelines and gradually improved through usability testing. It shows an overview of all medication information from a patient's birthdate to some time in the future. Apart from medication records that we have introduced, it also shows notes and diagnosis for the selected patient. A grid panel separates the screen into three segments, one for notes, another for diagnosis, and another for medication records. Each segment arranges its items in a tree. An end user clicks to expand or collapse the tree. This interaction shows and hides the items respectively. In Figure 29, the overview form shows a patient with chronic diseases. In the middle part of the screen, we can see the diagnoses for that patient. In the top area, the shape icons represent notes. Icon colors indicate warning levels. Red means severe, yellow means warning and green means OK. The user such as a doctor clicks an icon to display note details in a box next to that icon. For example, on Jan 16, 2011, this patient got severe infection. In the bottom area, the screen shows medications that the patient received. The end user can drag the timescale to zoom-in and zoom-out, and all boxes, bars and icons will accordingly change their position and size, and align to the new position on screen.
78
4.1.5 Deployment The biopsy testing form shows the lab results that the patient got. The end user can also record bronchoscopy results. He first marks the position where he takes a biopsy, and then changes the color of marks when he receives the testing results.
4.1.5 Deployment A designer uses VisTool Studio to develop the user interface. As we have shown, VisTool Studio is the development environment. VisTool Studio saves the screens developed by the designer in form files (.vis) and a data map file (.vism). This health record application consists of three form files (FindPatient.vis, Overview.vis, and Bronchia.vis) and a data map file (EHR.vism). One form corresponds to one form file. To deploy the health record application, the designer distributes the application files (i.e. form files and a data map file) on the department's machines. Those machines already have the VisTool Kernel installed, but VisTool Studio is not installed. VisTool Kernel is the runtime environment for VisTool applications. A user double-clicks the data map (EHR.vism) like ordinary applications, and the VisTool Kernel reads the application files and shows the patient-search form. The form responds to user actions, shows real data, etc.
4.1.6 After the deployment of the first release Some departments in the hospital may request different user interfaces. Usually, these requests are easy to make for a designer. To meet their requirements, the designer may rewrite a few formulas, and the user interface is changed. Meanwhile, programmers implement advanced functionality such as importing data from other systems, because it requires programming to implement it. The designer can integrate programmer-supplied methods later.
79
4.1.6 After the deployment of the first release
Next, we show an example of function integration with VisTool. After this first release is put into operation, programmers will develop the Service-Oriented Architecture for the hospital. The SOA is used to integrate various existing systems in the hospital. Furthermore, the system developers are concerned with data integrity. They restrict direct modification on the database. So the systems in the hospital can only read records from the database, but cannot modify (update, delete and add) them. The modification can only be done by means of a SOA service, and that service ensures security. Suppose that the designer plans to implement new functionality when SOA is ready for use. The new functionality is to add new medicine orders using SOA. The user clicks a button to add new orders, and a dialog form shows. The form shows medicine names, the default amount, and the start date for the new order. The user can change them in the dialog and click the "New" button to add a new record. Step 1. The designer develops the dialog form. In that form there are three interesting controls. The combo-box MedType represents the medicine names. The user can select a medicine from that combo-box. The textbox StartDate represents the start date. The Length shows the order amount. The user can click the numeric-down buttons to increase or decrease the length for the prescription. Step 2. The designer sets the "New" button's Click in that dialog form: Click: AddMedOrder (MedType!SelectedItem, StartDate!Text, Length!Value, param[0])
AddMedOrder is a web service method. This method is supplied by a programmer. It accepts four parameters: a medicine ID, a start date, a length, and a patient ID. In the formula, param[0] is the patient ID. Now when the user clicks the button, the new record is saved in the database by means of the SOA.
80
4.2 The theory
4.2 The theory behind the story VisTool provides tool support for the Virtual Window technique. "A Virtual Window is a user-oriented presentation of persistent data" [Lauesen 2005]. A user-oriented presentation is the screens that the user sees. Persistent data does not vanish after a user closes the application or turns down the computer. It is stored in a file, a database, etc. The Virtual Window technique guides a designer to design a good data presentation. The goals of the Virtual Window technique are to ensure "(1) all data is visible somewhere and (2) important tasks need only a few windows."[Lauesen 2005] The health record overview achieves the goals. It visualizes data from four tables in only one screen, and supports the user to perform the tasks – select the patient and see the patient's health state. Lauesen proposes three steps using the Virtual Window technique [Lauesen 2005]: First we make a plan for what should be in each window, and next we make a detailed graphical design of the windows. Finally we check with users that they understand the window, and we check against the task descriptions and the data model that everything is covered.
We will see what VisTool can support in these steps. Plan what to show. In this step, the designer applied a design rule from the technique – rooted in one object. This rule suggests that a virtual window should show "data about this object and objects related to the object" [Lauesen 2005]. The health overview follows this rule. Its data originates from the patient (tblPatient), and the overview shows the medicine orders (tblMedOrder) and intakes (tblIntake) that are related to that patient. With VisTool the designer applies that design rule by means of the parent keyword and the relationships. For example, the formula parent -< relMedOrder >- relMedType means that 81
4.2 The theory behind the story
the data originates from the parent (tblPatient) and includes records from tblMedOrder and tblIntake that are related to the parent. Make a detailed graphical design. The designer made a detailed graphical design from the beginning, because he had an idea what the screen should look like. When the graphical design is done, the designer should fill in the screen with extreme but realistic data, which is another rule from the technique. Without VisTool it is a challenge for most designers, because some extreme but realistic data e.g. data for a Gantt diagram may require domain expertise. With VisTool the designer uses formulas to access data from the existing database. So data is realistic. Check against tasks and the data model. The designer should ensure that tasks are sufficiently supported by the screens and the screens should show all necessary data from data entities (tables). For the time being, VisTool does not check this automatically.
4.3 Design rationale The basic trick in user interface design is to find a starting place that is somewhat recognizable, and then help the user grow into the strongest set of tools possible.
— Alan Kay,1998 CHI Conference Keynote Speech[Chi 2010] Considering the limited programming skills of user interface designers, we did some studies on previous approaches. We decided to start from the traditional approach that is proved to be powerful. Combining scripting capabilities with components and an interface builder has proven to be a particularly powerful approach [Myers 2000]. VisTool approach consists of three building blocks: Formula Language, templates, and an interface builder. Formula Language originates from the spreadsheet paradigm, and the template idea is inspired from component systems such as toolkit-based systems. 82
4.3 Design rationale In our case, the strongest set of our tool is the concept of applying formulas in user interface development.
4.3.1 Formula Language Previous research reveals that scripting languages are successful in raising the level of user interface development [Myers 2000][Ousterhout 1998]. It allows a designer to combine existing user interface components to develop a user interface. However, the level of script programming for user interface development is not high enough. Scripting is still in the programming paradigm. Many scripting languages retain some characteristics from system languages such as C, etc. They are not intuitive for user interface design. A designer has to go through several programming intermediates such as variable declaration, loops, etc. to reach the goal for user interface design such as changing colors, positions, etc. Furthermore, the learning curve of a scripting language is not gentle. For the learner, one of the most important requirements is to suppress the 'inner world' of programming, the world of variable declarations, loops and input/output. The spreadsheet may be the model of the future [Green 1990]. Inspired from the spreadsheet paradigm, we invented formula-based approach for user interface development.
the
Previous studies on user interface tools recommend that "it is important to control the low level pragmatics of how the interactions look and feel" [Myers 2000]. From the user interface design point of view, the low-level "pragmatics" is user interface property values. Property values are fundamental to appearance and interaction. Color, position, texture, size, shape, and so on, are values in properties. A value change results in the respective change on the appearance. Conversely, if an interaction changes the user interface, that interaction must change some property values. For example, scrolling a page is an interaction, which changes the value of the scroll bar position. Moreover, research shows that our eyes are quite 83
4.3.1 Formula Language
sensitive to visual properties such as position, length, color, size, and texture, etc. [Mazza 2009]. Therefore, it would be effective for designers to directly define property values of visual objects e.g. textbox, button, arc, etc.
4.3.2 Formula usability In the user interface design world, data is not purely from a database. When a designer is constructing a data presentation, he will deal with data from various places. In general, we can categorize data into two types: data from the user interface itself and data from a database. For instance, in the health overview example (Figure 30), the timescale's position is dependent on the data from the user interface (i.e.: the name label's right). The position of a medicine box is dependent on the field from the database and the user interface data (i.e. Timescale's position). Formulas must be capable of expressing those two kinds of data: (1) User interface data
User interface objects such as textboxes, buttons, arcs, boxes, lines, etc.
Properties of user interface objects such as Color, Height, Width, etc.
(2) Database data
Database fields.
Database tables.
Relationships between database tables.
Formula Language unifies data from the user interface world and the database world. In principle, a designer can use only one operator such as dot (.) to access data. However, with only one operator such as dot (.), the designer cannot easily know from the name whether the data is from user interface or database. For instance, he cannot know whether the ID is a database field or a property: Me . ID
84
4.3.2 Formula usability Our early usability tests show that the readability of using only dot is poor, because it is difficult to deprogram the formulas as Green calls it. Comprehension has been shown to be a complex task,…, of which one facet is conveniently labeled 'deprogramming', meaning that after a portion of the mental representation of the problem has been translated into code …, it is then translated back again into mental representation language, as a check [Green 1990].
As a result, the language syntax must precisely indicate where data is from. We suggest that designers should use a dot (.) operator to access a database field and use a bang (!) to access a user interface property. Those operators tell where data is from. Likewise, with only one operator, the language does not show the cardinality of a relationship. The essence to constructing a data presentation is to reveal data relationships for the end user. Relationship cardinality is a useful facility for data presentation design. It tells whether one or more user interface objects might be created, and can also indicate what belongs to what. So we invented a join-many (--) operator to symbolize a many-to-one relationship. Furthermore, as VisTool unifies the two worlds, naming conflicts inevitably arise. Keywords, table name prefixes, and operators are used to resolve naming conflicts. We have two kinds of naming conflicts: (1) the naming conflict between the database world and the user interface world, and (2) the naming conflict inside the database world. First, let's see the first kind of naming conflicts. For instance, assume that we have a table Parent. The formula is Parent. VisTool cannot know whether the name Parent refers to the table Parent or the property Parent. A designer should use a keyword such as Me and Map to clarify the meaning. Me is the current control. The designer can write Me first, and further accesses a property or a field in the current control. For instance me!Parent refers to the property Parent. Map is 85
4.3.2 Formula usability
the VisTool data map. The designer uses the keyword Map to access a table. For instance Map.Parent refers to the table Parent.
Bang (!) and dot (.) are useful for resolving naming conflicts between user interface properties and database fields. For instance, assume that the current control contains a field called text. The designer writes the formula: text & “Hello”. In this example, VisTool does not know whether the name text refers to a field or a property, but it interprets text as a field by default, because a field has a high priority. The designer should use a dot (e.g. me.text) to mean the field text and a bang (e.g. me!text) to mean the property Text. Second, a table-name prefix is used to resolve naming conflicts resulting from relationships and fields. A full relationship name consists of a table and a relationship. The same table can be involved in joins defined by many relationships. For example, tblPatient.relMedOrder is a relationship from tblPatient to tblMedOrder, where tblPatient is the table and relMedOrder is the relationship. Another relationship tblMedType.relMedOrder is from tblMedType to tblMedOrder. In this case, the name tblMedType must be stated. Hence, a table-name prefix is optional only when no relationship naming conflict arises. Likewise, the same field may exist in several tables. A full field name consists of a table and a field. Hence, a table-name prefix is optional, only when the DataSource does not entail more than one table where the field might be from. To improve usability, keywords are optional and VisTool is fault tolerant with mistyping operators (e.g. bang, join-many, etc.). The interpreter checks a name and its subsequent operator, and can recover from the mistyping. VisTool interface builder also auto-corrects mistakes for the designer.
4.3.3 Templates Component systems are proved successful, and are widely applied in industry [Myers 2000]. Traditionally, a component system provides 86
4.3.3 Templates
several built-in graphical presentation components. For example, one component visualizes data in a scatterplot, another one for treemap, and so on. However, the traditional way limits the kinds of graphical presentations that a designer can build. Thus, he cannot build novel user interfaces unless a new component is embed in the system. However, because of the popularity of component systems, designers are familiar with them. We do not completely discard the component concept, because it will be more productive for designers to learn and use a familiar tool than an unknown one [Beaudouin-lafon 2003]. Our approach differs from traditional component systems. VisTool provides many kinds of visual objects. This is the same as many other component systems such as toolkit- or widget-based systems. But in our approach, a graphical presentation is assembled by various primitive visual objects, unlike the traditional way with one component for each kind of presentation. VisTool lets a designer assemble templates to create visual objects. For example, in our example scenario, the designer dragged an item from the Toolbox. In fact, he created a template. Behind the scene, a template creates visual objects. Those visual objects are fragments of a full picture. When the visual objects are combined on screen, the resulting presentation becomes meaningful. This assembling strategy is also adopted by Protovis. However, Protovis lacks ordinary user interface components such as textbox, button, etc.
4.3.4 Interface builder Indeed, the relationship between the notation and the environment is such that the notation cannot be used except in some kind of environment of use…The fundamental principle is that the way the user behaves is determined by both the notation and the environment. A satisfactory system demands an environment that supports the notation and vice versa [Green 1989]. The successful environment for user interface design is interface builders. Previous research shows that interface builders enable domain experts to implement user interfaces by "moving some 87
4.3.4 Interface builder
aspects of user interface implementation from conventional code into an interactive specification system" [Myers 2000]. So an interface builder is effective to improve a usability factor – learnability. It benefits inexperienced users. User interface designers do not have solid programming skills. A system with a smooth learning curve will be easy to learn. However, we should tailor the builder for our needs. First, designers operate on templates. For example, a designer drags an item from the toolbox and drops it on the design panel. In effect, he creates a template. Second, to help a designer with data presentation design, we need to provide an overview of data model. Entity Relationship diagram is an example. Third, the interface builder should provide intelli-sense for formula suggestions. A full-fledged intelli-sense shows a list of available names e.g. relationship, fields, etc. and methods, and so on. Ideally, it would improve another usability factor – the memorability for Formula Language. The intelli-sense reduces the likelihood of misspellings and speeds up formula writing, which improves the other two factors – reducing errors and task efficiency. Last, it would also be necessary for a designer to see the resultant screen when he is writing formulas and creating templates. This might help the designer understand what he has specified, which improves the usability factor – understandability. An interface builder also benefits experienced users. It increases the speed of constructing user interfaces, which allows for more iterations of user interface design [Myers 2000]. As we discussed before, rapid user interface development is desirable in agile methods. In short, in order for a satisfactory system, we should provide an interface builder.
88
Chapter 5 How VisTool works In the previous chapter we used an example scenario to show how to use VisTool Studio to design a user interface iteratively and we explained a few formulas. In this chapter, we will unravel the concepts and principles. For example, we will explain what happens when a designer is dragging and dropping on the Design Panel, what generates multiple instances of a control and how they are generated, etc. We will also introduce more advanced formulas, and elaborate on the Formula Language semantics.
5.1 Basic Concepts 5.1.1 Control instance An end user sees and interacts with control instances such as forms, timescale, labels, boxes, etc. A control instance has properties such as Left, Top, Color, etc. Control instances show in various positions, colors, sizes, etc., because the property values vary. For instance, in Figure 30 the health overview, the medicine labels have different Top values. So labels locate in different Top positions.
89
5.1.1 Control instance
Figure 30–Templates that create the health overview form
90
5.1 Basic Concepts
5.1.2 Control template A control template is not visible on the user interface, but it creates one or more control instances that are visible on the screen. For instance, Figure 30 shows the templates that create the health overview. The overview is created by six templates: frmOverview, lblPatientName, timescale, medOrderBox, medIntake, orderInfo. FrmOverview is a FormTemplate and it creates a form. TimeScale is a TimeScaleTemplate and it creates a timescale. LblPatientName is a LabelTemplate and it creates several labels that show medicine names, and so forth. Control templates have properties that are constants or formulas. Templates and formulas are visible only to designers. An end user does not see them. In VisTool Studio (Figure 25), the designer drags an item from the ToolBox to create a control template, and specifies formulas in the Property Grid. At runtime when a form is opened or the screen is refreshing, VisTool evaluates formulas for each control instance. VisTool organizes templates in a tree structure. The root of a template tree must be a form template. A template can have child templates. A parent-child relation is defined by the template property Parent. If Parent is unspecified, the default Parent is the form template. Form
Figure 31–The template tree of the patient health record example
91
5.12 Control template
templates are special. A form template cannot have a Parent. For example, Figure 31 shows the template tree that creates the health overview. FrmOverview is the root of the template tree. The Parent of LblPatientName, timescale, medOrderBox, and orderInfo is frmOverview. As a result, they are child templates of frmOverview. Similarly, medIntake is a child template of medOrderBox.
92
5.1.2 Control template
Figure 32–The DataSources for the first release in the example scenario
93
5.2 Multiple instances of a control DataSource is a special template property. It has a formula for retrieving a record set from a database. When DataSource is specified, the template retrieves the record set and creates a control instance for each record in that record set. For instance, in the health overview, frmOverview refers to a record set consisting of one tblPatient record, so one form is created. OrderInfo refers to a record set containing medicine names, so several labels are created to present the records. The designer can write a where clause in the DataSource. Figure 32 shows DataSource formulas in the patient-search form and the health overview form. Unlike SQL, DataSource formulas can refer to the value of a property, a method, etc. For example, in the patient-search form, the designer creates labels (lblPatientNames) for showing patient names and addresses. The DataSource formula is : Patient name labels Label Name: lblPatientNames DataSource: tblPatient where ptName like "%" & txtName!Text & "%"
In the formula, txtName!Text refers to the Text value for the search criteria. The two % characters are wild-card search characters that match any string. At runtime, VisTool translates a DataSource formula into a SQL
query. For instance, if the user types "jo" in the patient-search form, the lblPatientName DataSource is translated into this SQL: SELECT tblPatient.ptName , tblPatient.address1 , tblPatient.ptID FROM tblPatient
94
5.2 Multiple instances of a control WHERE ptName like "%jo%"
The designer does not write fields in a DataSource formula. VisTool collects the fields that are used in the formulas. The designer can also write group-by, order-by and other SQL-style clauses to process data. For example, in the health record (Figure 27) introduced in the previous chapter, there are two repeating chloramphenicol lines on the screen. It is because the patient got chloramphenicol twice. To solve that problem, we rewrite the DataSource and add the group-by clause: Medicine name labels in the health overview Label Name: orderInfo DataSource: parent -< relMedOrder >- relMedType group by tblMedType.medName,tblMedOrder.ptID,tblMedType.medID, tblMedOrder.medID
After VisTool retrieves data based on the generated SQL, the template creates one control for each record. For example, in the health overview form, frmOverview DataSource retrieves one patient record. As a result, frmOverview creates only one form. MedOrderBox DataSource retrieves that patient's medicine order records. As a result, medOrderBox creates several medicine boxes.
5.3 Property formulas A formula is an expression that may contain operators, data references, constants, etc. A formula specifies how to compute a property value.
95
5.3
Property formulas
5.3.1 Walking from one data entity to another In Figure 32, we use gray boxes to present medicine orders. MedOrderBox creates those gray boxes: Medicine box in the health overview Label Name: medOrderBox Parent: frmOverview DataSource: parent -< relMedOrder
MedOrderBox Parent is the form template frmOverview. In the
DataSource formula, parent means the record in the parent template. RelMedOrder is a relationship from tblPatient to tblMedOrder. The join-many operator (-- relMedType group by tblMedType.medName,tblMedOrder.ptID,tblMedType.medID, tblMedOrder.medID
OderInfo Parent is unspecified. By default, the parent is the form template frmOverview. The join-many operator (--) walks from the tblMedOrder records produced by the join-many (--) In the Lifelines [Plaisant 1996], medicine names are shown next to the medicine boxes. We show how to do it with VisTool. We create a label template and set some formulas. The Parent is medOrderBox. The formulas and the screen are shown in Figure 33. An interesting formula is Text: Medicine names besides the medicine boxes Label Name: medOrderBox_Name Text: Me >- relMedType.medName
In this example, the join-one operator (>-) walks from a control (Me) to a tblMedType record bound to Me. The dot (.) accesses the field medName.
The right operand of the join-one operator (>-) must be a many-to-one relationship. It means that the join-one operator (>-) walks to at most one record. If no record is found, the join-one (>-) generates a null record.
5.3.3 Walking from data to control (-=) In the health overview, medicine boxes are aligned to the corresponding medicine names. MedOrderBox Top is calculated by the formulas: Medicine box Box Name: medOrderBox Top: Me >- relMedType -= orderInfo!Top
97
5.3.3 Walking from data to control (-=)
In the Top formula, relMedType is a many-to-one relationship from tblMedOrder to tblMedType. The join-one operator (>-) walks from the current control (Me) to a tblMedType record bound to Me.
Figure 33–A newly created template for showing join-one (>-) usage
98
5.3.3 Walking from data to control (-=)
The control-join operator (-=) walks from that tblMedType record to an orderInfo control whose record is bound to that tblMedType record.
The bang operator (!) accesses the Top property. The right operand of the control-join operator (-=) must be a template name. The left operand of the control-join operator must be a record reference. The control-join operator (-=) navigates to at most one control. If no control is found, the control-join (-=) generates a null control.
5.3.4 Interaction The designer specified statements for interaction. Common event properties are Click, DoubleClick, KeyDown, etc. VisTool provides system methods for basic functionality. We will show two examples. Live search: In the patient-search form (Figure 34), the user can type
Figure 34–The live search
99
5.3.4 Interaction
in the textbox, and the results are shown immediately. The designer specified the textbox Keyup event. Textbox for searching TextBox Name: txtName Keyup: Requery()
Requery is a system method. It enforces a database query. After the user presses a key, VisTool retrieves data from the database, and recalculates formulas. As a result, the screen updates. Change the timescale zooming factor: The user can drag on the timescale to change the time zooming factor. Medicine boxes and intake bars have to be realigned by the timescale after the user’s dragging. Figure 34 shows the original presentation and the one after user interaction. In the original presentation, boxes and bars are cluttered. After the user’s drag, the date interval on screen is wider, and bars and boxes are wider than the original one. The designer specified the timescale BordersChanged event: Change the timescale zooming factor TimeScale Name: timeScale BordersChanged: Refresh()
BordersChanged is an event property. It fires after the user drags on the time scale. Refresh is another VisTool system method. It evaluates formulas and sets property values when a property gets a new value, and the screen updates accordingly.
5.3.5 An example of complex interaction Figure 36 is the screen showing a patient's biopsy testing samples. The screen is invented in the first release introduced in Chapter 4.1.6.
100
5.3.5 An example of complex interaction
Figure 35–Change the timescale zooming factor
The testing samples are shown by glyphs. In this example, the patient got four biopsy tests. We create a Glyph template for biopsy samples. The template for samples Glyph Name: Sample DataSource: parent -< Bronchial
The DataSource collects a specific patient's Bronchial records. As a result, several glyphs are created for sample records. An end user clicks a glyph, and a rectangle marks the glyph to inform the user what has been clicked. This interaction requires dialog data to represent what the end user clicks. Notice that dialog data is not persisted in the database.
101
5.3.5 An example of complex interaction
Figure 36–Select, modify and persist samples
102
5.3.5 An example of complex interaction Create dialog data: We first create a template to represent a marker, and then create a property Selected to represent the dialog data. The marker template Glyph Name: Marker Selected: Init -1 ' The sample selected Visible: Selected >= 0
Initially, the Selected is -1, because a user has not clicked a sample glyph yet. The Visible formula specifies that the maker is visible only when a sample is selected. This dialog data (i.e. Selected) helps us find the selected glyph. The formula for searching the selected glyph Sample[Marker!Selected]
The formula Marker!Selected is the index of that selected glyph. Then we can show detailed information for that sample. For example, at the top right corner, textboxes show sample details. The textbox showing the testing date Text: Sample[Marker!Selected].splDate Default ""
The textbox showing the testing ID Text: Sample[Marker!Selected].splNumber Default ""
The textbox showing the remark Text: Sample[Marker!Selected].remark Default ""
Set dialog data: The user clicks a glyph to select that sample. This interaction should change the dialog data (i.e. Selected) in Marker. Glyph: Sample Click: Marker!Selected = me!Index, Refresh()
Click is an event property, which fires when a user clicks. The formula tells that it first sets Selected as the current Index and then refreshes the screen to show the marker. To record a test result, the end user first marks the position where he takes a biopsy for that patient. When she gets the testing results e.g. 103
5.3.5 An example of complex interaction
Benign, Indeterminate, Malignant, etc., she then changes the color accordingly. This interaction changes the local data. Modify records locally: for example, the user clicks the light-green box representing Benign. It modifies the selected sample. Note that this interaction only modifies a record locally. The change has not been committed to the database yet. A glyph template for showing the Benign box Glyph Name: Ben Click: Sample[Marker!Selected]. bronchial.result = 1, Refresh()
Bronchial.result is a field. The formula sets the field in that selected
glyph, and then refreshes the screen to show the change that has been made. Commit changes to the database: Changes should be persisted in the database. For example, we design that changes are committed in the database when the user closes the form. Commit changes to the database FormClosing: Commit()
Commit is a system method. VisTool commits local changes e.g. row creation, deletion, and modification made in the records to the database. VisTool generates the SQLs accordingly.
5.4 Implementation rationale 5.4.1 Integrate database query into Formula Language Next we will show the design decisions for integrating data query into formulas. Cook discussed some design issues for solving the problem of integrating database query languages and programming languages, known as impedance mismatch [Cook 2006]. We will discuss how the formula-based approach solves them.
104
5.4 Implementation rationale
Data typing. The first issue with data typing is that a primitive type in a programming language may not exist in a database, or vice versa [Cook 2006]. For example, Microsoft SQL 2000 defines a Unicode char type (i.e. nvarchar). We cannot find a type for Unicode strings in C#. A programmer usually does type conversions to make types compatible in the programming language and the database. We consider that type conversion is irrelevant to user interface design and distracts designers. Hereby, the interpreter performs type casting when generating a SQL. The second issue with data typing is object-relational impedance mismatch [Cook 2006]. In a relational database, data is organized in rows and columns. In practice, data can be so complex that a single table can hold only a part of data, and a new table is created to hold additional data [Fin 2001]. For example, if we model that a bundle of medicine records belongs to a patient record, we do not store medicine records in a patient table. Rather we create a new table to hold medicine records. The user interface is within the object paradigm. It is not limited to hold data in rows and columns [Fin 2001]. An object can hold other objects by referencing. For instance, a form is an object. It can be the placeholder of other user interface components such as textboxes, buttons, etc. The problem of addressing data between those two disparate paradigms is known as object-relational impedance mismatch. The design of a data presentation is to map relational data onto user interface objects. We have shown that Formula Language is a new way of solving object-relational impedance mismatch. Interpretation of Null values. "In SQL, null represents 'unknown'" [Cook 2006]. For instance, with a null value in arithmetic operations, null is returned. In many programming languages, the involvement of a null value in calculations results in an exception. To avoid system crash, programmers have to write exception handling in try-catch blocks. However, exception handling is tedious in user interface 105
5.4 Implementation rationale
design, because property calculations are widely performed. Considering that any exception handling would interrupt the design process, we decided to make null interpretation consistent with SQL. In Formula Language, null represents "unknown". Static typing. Static typing means that the type of a value is determined at compile time. It in principle improves system performance, because some optimizations can be made at compile time. However, it makes user interface design difficult. A designer has to keep types in mind and produce values in the correct type. Even worse, a designer might spend plenty of time in trouble-shooting with types rather than user interface design. For the sake of removing these complexities with types, Formula Language has dynamic typing. The principle is that the interpreter detects the type for the target property, and does type conversion when a resulting value does not match the type. Explicit Query Execution. Explicit Query Execution means that a programmer writes and executes SQLs by programming APIs. For example, with Java language, a programmer can embed a SQL query in the java code, and sends the query to the database engine. Explicit query execution improves a programmer's flexibility about interaction with database. For example, the designer can rename a field in the query. But Explicit Query Execution makes a query difficult to compose. For instance, a designer has to collect all field names and find out keys used in a join. This should not be done by a designer and is irrelevant to user interface design. It contradicts our goal of alleviating design complexities. So Formula Language does not require explicit query execution. However, some SQL clauses such as where, order-by, group-by, and having are useful for data processing such as filtering, sorting, etc. They are intuitive to learn and read. So they are applied in many other query languages such as LINQ, SPASQL, etc. Similarly, Formula Language provides those clauses to support data processing. Prefetching Related Objects. This problem is also known as N+1 problem. Let's use an example to explain. In the patient heath record 106
5.4 Implementation rationale
overview (Figure 32), medOrderBox creates medicine boxes. The DataSource formulas for frmPatient and medOrderBox are these: FrmPatient DataSource: tblPatient where ptID = param[0]
MedOrderBox Parent: frmPatient DataSource: parent -< relMedOrder
Semantically, the medOrderBox DataSource means that, for each parent component, start from the parent record and then select tblMedOrder records that are related to that parent record. Behind the scene, VisTool generates a SQL query to retrieve records for the DataSource. If we strictly follow the semantics, it means that if there are N records in frmPatient, we would have N + 1 times database queries to retrieve medOrderBox records. N is for the child-template e.g. medOrderBox, and one is for the parent-template e.g. frmPatient. The N+1 problem imposes a great overhead on performance. David Maier stated a key requirement for solving impedance mismatch: 'Whatever the database programming model, it must allow complex, data-intensive operations to be picked out of programs for execution by the storage manager, rather than forcing a record-at-a-time interface [Cook 2006]. We deal with it by optimizaing the SQL generation. We can reduce the database queries to two. One is for the parent template, the other for the child template. VisTool first analyzes and processes the SQL query in the parent (frmPatient). Clauses such as order-by and group-by are removed, because some SQL engines do not accept those clauses in a nested SQL. Then, VisTool embeds the processed parent SQL in the child template (e.g. medOrderBox) SQL, and appends the used fields and the other SQL-like clauses such as Top, where, etc. Our solution is this: The parent-template's SQL SELECT tblPatient.ptName , tblPatient.ptID FROM tblPatient WHERE ptID=1
107
5.4 Implementation rationale
The child-template's SQL SELECT tblMedOrder.ptID , tblMedOrder.startTime , tblMedOrder.length , tblMedOrder.medID , tblMedOrder.orderID FROM ( (SELECT tblPatient.ptID FROM tblPatient WHERE ptID=1) AS NESTED1 ) LEFT join tblMedOrder on NESTED1.ptID = tblMedOrder.ptID
foreach (Department d in DB.GetDepartments().OrderBy(d => d.name)) { if (d.city == "Austin") { print(d.name); foreach (Employee e in d.employees.OrderBy(e => e.name)) { print(e.name); foreach (Project p in e.projects.OrderBy(p => p.name)) print(p.name); } } } Figure 37–Pseudo code for showing multilevel iteration
Multilevel Iteration. Multilevel iteration means that "several levels of multi-valued relationships are included in the results of a query" [Cook 2006]. The cardinality of a multi-valued relationship is one-to-many. Figure 37 shows Cook's pseudo-code for demonstrating multilevel iteration [Cook 2006]. It is awkward to express multiple navigation with one-to-many relationships in SQL [Cook 2006]. Figure 38 is the corresponding ER model. The Department has a one-to-many relationship to Employee. The Employee has a one-to-many relationship to Project. Cook explained that "If there are n departments in Austin and on average m employees per department in Austin, 1+ n +nm queries would be executed" [Cook 2006].
108
5.4 Implementation rationale
When we were analyzing this problem, we found that our improvement in Prefetching Related Objects was sufficient for solving the Multilevel Iteration. So we did not introduce extra concepts into Formula Language to solve this particular problem. We create three templates to show our solution. txtDepartment Parent: DataSource: department where city = "Austin"
TxtDepartment's parent is not specified. By default, the second template will be rooted in txtDepartment. The DataSource indicates that it collects the Department records whose city matches "Austin".
txtEmployee Parent: txtDepartment DataSource: parent -< relEmployee order by Employee.name Text: name
The DataSource symbolizes a walk from the rooted table Department to the table Employee. Furthermore, the records are sorted by Employee name. The Text shows Employee name. txtProject Parent: txtExployee DataSource: parent -< relProject order by Project.name Text: name
TxtProject's
parent is txtEmployee. For each txtExployee,
the
DataSource walks to Project records. The records are sorted by Project name. The Text shows Employee name. With our improvement in Prefetching Related Objects, the interpreter generates three SQLs to retrieve records, one for each template. Furthermore, VisTool manages the parent-child hierarchy. Children sharing the same parent are grouped in a bundle referring to that parent. 109
5.4 Implementation rationale
Figure 38–The ER model for multilevel iteration
Parameterized Queries. Parameterized queries means that parts of a SQL query can be composed by an end user interaction. For example, Figure 39 shows the patient-search form. An end user can type in the textbox to perform a live search. Those screens in Figure 39 are the first release introduced in Chapter 4.1.4. Let's see the generated SQLs for the patient-search form when the end user interacts. VisTool generates SELECT Patient.ptname, Patient.ptid, Patient.address1 FROM Patient WHERE [ptname] like "%j%"
110
5.4 Implementation rationale
VisTool generates
Figure 39–The patient-search form SELECT Patient.ptname, Patient.ptid, Patient.address1 FROM Patient WHERE [ptname] like "%jo%"
Most parts of the SQLs remain the same. Only the like operand is changing. For instance, when an end user is typing 'j', the resulting like operand is "%j%". Hereby, the like operands are parameters. Cook points out that "query parameters are awkward to specify" with Explicit Query Execution [Cook 2006]. Although VisTool does not support Explicit Query Execution, Formula Language supports parameterized queries. A designer can define query parameters in the where clause. For instance, a designer can use property names as query parameters. He can write this formula: Patient where ptName = txt!Text
The interpreter replaces txt.Text with its runtime value and generates the SQL. 111
5.4 Implementation rationale
Normally, parameters are property values. However, a form is an exception. It cannot have query parameters based on itself and its controls. That's because controls cannot provide values until they come into existence. When a designer defines query parameters for a form, the form as well as its child controls are not created yet. So query parameters for a form must be from the external world, for instance, from another form. What is missing is how a form accepts query parameters from elsewhere. We must provide a new concept to help the designer out of this situation. So we designed a keyword Param so that a form can accept parameters. As we introduced before, Param is an object array, and can be used like a property value. The designer can write this formula: Patient where ptID = param[0]
Dynamic Queries. Dynamic queries mean that SQL queries are constructed at run-time [Cook 2006]. For example, a database usually contains a large amount of data, but the end user's screen cannot show all of them. A popular way is to split the database contents in pages. Each time the screen shows only one page. To support the paging, a designer can bind a page number to the scrolling position of a scroll bar. When an end user scrolls the bar, the page number is sent to a SQL procedure and contents for a new page are retrieved from the database. The application re-renders the screen to show the new contents. Shneiderman shows that the dynamic query technique significantly improves some usability factors such as task efficiency and satisfaction [Shneiderman 1994]. The live search that we have shown is another example of dynamic queries. From the formula point of view, each round of a dynamic query is a formula recalculation, because formulas are the same and what changes are the resulting SQL queries. Several design steps are needed to support dynamic queries:
First, the designer creates a user interface component for providing query parameters. For example, in that live search, the textbox provides a query parameter for ptName.
Second, the designer writes a dynamic expression in DataSource. 112
5.4 Implementation rationale
Third, the designer needs a mechanism of re-querying the database and recalculating property values. This is realized by calling the Requery method in an appropriate event property. For example, in that live search, Requery is specified in the KeyUp property. As a result, whenever an end user types in the textbox, new SQLs are constructed by a typing interaction and property values are re-calculated, which re-renders the patient-search form.
Based on this principle, a designer can implement more sophisticated dynamic queries.
5.5 Formula Language Semantics 5.5.1 Notation Rst is a record set. A record set contains one or more tables. Trst is the set of tables in rst. Prirst is the primary table in Trst. Ctl is a control. Recctl is ctl’s associated record. Tctl is the set of tables in recctl. Prictl is the primary table in Tctl. If ctl has no record, recctl and prictl are null, and Tctl is empty. Rel is a relationship. The relationship rel defines a start table startrel , a target table targetrel , and the key fields in startrel and targetrel to join on. If startrel key fields are a primary key, the rel cardinality is 1:m. If targetrel key fields are a primary key, the rel cardinality is m:1.
Recref is a record reference. The reference recref contains a reference to the target table targetrecref and contains the key fields and the key values.
Tpl is a template. Fld is a field. Tfld is the table that fld belongs to. Aggr is an aggregate.
113
5.5
Formula Language Semantics
5.5.2 Join-many (-- rel
RecordRef
startrel ∈ Tctl
m:1
me >- relMedType
recref >- rel RecordRef
startrel ∈ Trecref
m:1
Me >- relMedOrder >relMedType
rst >- rel: Record set The result is a record set. The rel start table must be one of the rst tables. The rel targetrel key fields are a primary key in the rel target table. The join-one operator (>-) selects a record from the original record set , and left-joins the record with the rel target table record. This process occurs for each record in 115
5.5.3 Join-one (>-)
rst. The individual records are merged. The primary table is the rst primary table. Example: tblMedOrder >- relMedType. TblMedOrder is a set of medicine order records. The formula produces a record set consisting of medicine type records that are related to the medicine order records. Each result record contains fields from tblMedType and from tblMedOrder. If a medicine record does not have a related medicine type, the result record set has one record with fields from tblMedOrder and null for tblMedType fields. The primary table in the new record set is tblMedType .
ctl >- rel : RecordRef The result is a record reference. The rel start table must be one of the ctl tables. The rel target key fields must be a primary key, because the rel cardinality is m:1. The join-one operator (>-) creates a record reference to the rel target table. .
Example: me >- relMedType. The current control record is a medicine order record (tblMedOrder). The formula produces a record reference to tblMedType.
recref >- rel : RecordRef The result is a record reference. The rel start table must be the recref target table. The rel target key fields must be a primary key, because the rel cardinality is m:1. The join-one operator (>-) selects the recref record, and creates a record reference to the rel target table record.
Example: Me >- relMedOrder >- relMedType. The formula produces a reference to tblMedType.
116
5.5.4
Control-join(-=)
5.5.4 Control-join (-=) Expression Result
Condition
Cardinality Example
ctl -= tpl
Prictl = Pritpl
m:1
Me >tplMedOrderType
targetrecref = Pritpl
m:1
Me >ctlJoinMedOrder -= orderInfo
Control
recref -= tpl Control
ctl -= tpl : Control The result is a control. The ctl primary table must be the tpl primary table. The control-join operator (-=) selects the ctl record primary keys, and finds a tpl control by matching the equal tpl primary key values. If there is no matched tpl control, the result is null. Example: Me >- tplMedOrderType. The Me DataSource is parent -< relMedOrder. The current control primary table is tblMedOrder. The template tplMedOrderType DataSource is parent -< relMedOrder >- relMedType. The tplMedOrderType primary table is tblMedOrder. The formula produces a tplMedOrderType control sharing the same medicine order record with the current control (Me).
recref -= tpl : Control The result is a control. The recref target table must be the tpl primary table. The control-join operator (-=) selects the recref keys, and finds a tpl control by matching the tpl primary key values. If there is no matched tpl control, the result is null. Example: Me >- ctlJoinMedOrder -= orderInfo. The ctlJoinMedOrder target table is tblMedOrder. The template orderInfo DataSource is parent -< relMedOrder >- relMedType. So the orderInfo primary table is the ctlJoinMedOrder target table. The formula produces the 117
5.5.4 Control-join(-=) orderInfo control containing the same record reference (Me >ctlJoinMedOrder) key values.
5.5.5 Dot (.) Expression Result
Condition
Example
ctl . fld
Field value
Tfld ∈ Tctl
Me . ptName
recref . fld
Field value
Tfld = targetrecref
Me >- ctlJoinMedOrder . medName
ctl . aggr
Aggregation value
Me . count(*)
ctl . fld : Field value The result is a field value. The fld table must be one of the ctl tables. The dot operator (.) first selects the ctl record and then
selects the fld value. Example: Me . ptName. The current control (Me) record is a patient
record. The dot operator (.) selects the Me record, and then selects ptName value.
recref . fld : Field value The result is a field value. The fld table must be the recref target table. The dot operator (.) first transforms the record reference recref into a record, and then selects the fld value in that record.
Example: Me >- relMedOrder . medName. Assume that the current record is a patient record. The dot operator (.) produces The formula produces the medName value.
ctl . aggr : Aggregation value The result is an aggregate value. Example: Me . count(*). Assume that the current control (Me)
record is a medicine order record. The dot operator (.) selects 118
5.5.5 Dot (.)
the Me record, and then selects the count value. It tells the number of medicine orders.
5.5.6 Bang (!) Expression
Result
Example
ctl ! prop
Property value
Me ! Left
ctl ! prop : Property value The result is a property value. The bang operator (!) selects the
ctl and then selects the prop value. Example: Me ! Left. Me is the current record. The bang operator (!)
selects Left value.
5.5.7 Control indexing ([ ]) Expression Result
Condition
Example
ctl [ expr ]
expr returns an integer
Me . ptName
Control
ctl [ expr ] : Control The result is a control. The expr result must be an integer n. The control indexing operator ([ ]) first selects the ctl bundle
and then selects the nth control in that bundle. Example: me [ Index - 1 ] returns the previous control of Me in Me bundle.
5.6 DataSource semantics DataSource is a template property. It must be a record set or a record reference. The evaluation result is a record set. ctl >- rel DataSource evaluates ctl >- rel for each control created by the ctl template. In each iteration, the evaluation result is a record 119
5.6 DataSource semantics
reference. DataSource merges the record references as one record set. recref >- rel DataSource evaluates it for each control created by the ctl template, and the evaluation result is a record set. ctl -< rel DataSource evaluates ctl -< rel for each control created by the ctl template. In each iteration, the evaluation result is a record set. rst The DataSource evaluation result is the record set rst.
DataSource defines some operations. (1) Collect fields. DataSource collects the fields that are used in all formulas that refer to the current template. The collected fields are used in the SQL select clause. For example, in the health overview (Figure 29), the template frmOverview collects the field ptName,
because ptName is used in the Text formula. Note that fields may be referred by other templates. For example, the ptName is referred by another template lblPatientName. The text formula refers to ptName in its parent template (frmOverview): LblPatientName Text: "Patient: " & parent.ptName Parent: frmOverview
(2) Collect relationships and tables. DataSource collects the relationships that refer to the current template. The collected relationships are used for joining tables in the SQL. For instance, in the previous section we created a new template to show medicine names next to the medicine orders in the health overview (Figure 33). The text formula was:
120
5.6 DataSource semantics
Medicine name labels showing next to the medicine boxes Label Name: medOrderBox_Name Text: me >- relMedType.medName
The relationship relMedType is collected in the medOrderBox_Name DataSource. Note that the relationships should be collected in the target template DataSource, because a relationship may be referred by other templates. In that example, the target template is medOrderBox_Name. From the collected relationships, DataSource derives a list of tables to which the record set refers. For instance, for the formula tblPatient -< relMedOrder -< relIntake, the table list to which the DataSource refers is tblPatient, tblMedOrder and tblIntake. (3) DataSource creates a child control for each record.
121
Chapter 6 VisTool Implementation In this chapter, we will explain the formula interpretation. We will also explain how we generate a SQL for DataSource and show an algorithm for the formula calculation.
6.1 Formula Language syntax Here is an overview of the Formula Language grammar in Backus– Naur Form (BNF).
122
6.1 Formula Language syntax
Figure 40–Overview of the Formula Language grammar
Constant is integer constants, double constants, string constants and date time constants. Ident is a name that can refer to a property, a field, a relationship, etc. For example, a designer can write the name Text to refer to the property Text. SqlExpr accepts anything and produces a string. However, in a SQLExpr if a token is an identifier and is recognized as a property or method, that identifier is substituted with its runtime value. 123
6.1 Formula Language syntax
Otherwise, the token is compiled into a string. We show some examples:
Formula
Expr SQLExpr Comments evaluation evaluation
1+2
3
1+2
1+ me!Height
3
1+2
(1) The value of Height is 2. (2) In the SQLExpr, me!Height is recognized as a property.
1+N
Error
1+N
N is not a property or method.
1 *% 6^^
(1) The Expr does not accept that formula. (2) SQExpr accepts anything, and none of the tokens is a property name or a method name. So SQLExpr takes the formula as it is, and compiles it into a string.
1 *% 6^^
Error
6.2 Path compilation A challenge of the Formula Language compiler is the state machine. In the Formula Language, an identifier can be a table name, a relationship name, a property name, a method name, a field name, etc. Each identifier is compiled into an expression object. Furthermore, the Formula Language supports walking from one object (e.g. a control) to another (e.g. a record reference). For instance, the formula me >- rel walks from a control to a record reference following the relationship rel. The compilation of those kinds of walking links expression objects as an expression tree.
124
6.2 Path compilation
Figure 41 shows the state transition diagram for compiling a Path (Figure 40). A rounded box is a state. An arrow is a state transition. The text along an arrow is the expression that enables a transition.
Field: VisTool collects fields for the SQL select in this state. The state that walks to Field must be Control. In the Control state, we have a control. The template that creates the control is the target template. The target template collects the field.
For example, in the health overview, the Text formula of the patient label (lblPatientName) is this: Label Name: lblPatientName Text: parent.ptName Parent: frmOverview
In Text, parent indicates that frmOverview is the target template and frmOverview collects ptName.
Aggregate: Similar to Field, the target template collects aggregates in this state. VisTool populates the collected aggregates in the select query.
Record: VisTool collects relationships in this state. The state that walks to Record must be Control. The target template collects the relationship in this state. VisTool generates the SQL based on those relationships.
125
6.2 Path compilation
Figure 41–The state transition diagram for compiling Path
126
6.2
Path compilation
Recordset: VisTool collects relationships in this state. If there is a Control involved in the transition, the target template is the one that creates that control. Alternatively, the designer should write map.setName to walk to RecordSet. In this case the target template is the current template that the formula belongs to. The target template collects the relationship in this state. VisTool generates the SQL based on those relationships.
VisTool allows table-name prefixes for fields and relationships. It distinguishes if a table name is a record set or a prefix. VisTool also makes use of operators to resolve naming conflicts. For instance, bang (!) accesses a property when the following name is a property.
6.3 Dynamic Typing Programming languages e.g. C#, VB.NET, etc. are strongly typed. In Windows Forms, any control property has a type. For example, Text is of string, Width is of 32-bit integer, and Background is of Color. If a programmer assigns a string to Width, an exception will be thrown, and the screen will not show correctly. The application may even crash. So programmers usually have to cast the result to the correct type. If a user interface designer considers type casting, the system is cumbersome to use. To overcome it, VisTool is a dynamic typing system. It automatically converts a formula result to the type that a property accepts. For example, the designer writes the formula: BackColor: "Green"
The BackColor result is an expression tree. It is shown in Figure 42. VisTool detects that BackColor is of Color but the formula is a string, so VisTool attaches a ColorConverter as the tree root. ColorConverter takes an expression object as input and converts its evaluation result to Color. In this example, ColorConverter takes an ExpressionList, and the ExpressionList has only one element referring to a constant string. 127
6.3 Dynamic Typing
Figure 42–Color converter for string
Figure 43–Color converter for an integer array
Alternatively, the designer can specify green in the Red-Green-Blue (RGB) model: BackColor: 0, 255, 0
In this case, the formula consists of three integers which correspond to red, green, and blue. Those three additive colors mix together to produce the intended color. The evaluation result of that formula is shown in Figure 43. In this example, the ExpressionList consists of an array. Each element in that array is a constant. The ColorConverter takes the ExpressionList as input and transforms them into the color.
6.4 VisTool user interface description language As we introduced in the section 4.1.5 Deployment, the designer's user interface is saved in a vis file. A vis file is a user interface description file. It specifies the formulas and the templates created by the designer. 128
6.4 VisTool user interface description language
Many advanced HTML designers do not use sophisticated HTML design tools such as Dreamweaver. Instead they like to write HTML directly. Similarly, advanced VisTool designers may not use VisTool Studio, but use a text editor (e.g. Notepad in Windows) to design the user interface. So the readability of the VisTool user interface description language is important to those advanced designers. Many user interface description languages are XML-based such as Extensible Application Markup Language (XAML), User Interface Markup Language (UIML) [Abrams 1999], USer Interface eXtensible Markup Language (USIXML) [Limbourg 2004], etc. XML is suitable for a computer to process. However, XML is quite difficult to read for humans. It contains many noisy mark-ups such as opening and closing brackets, quotes, etc. The user has to match brackets and terms carefully when writing the user interface description in an XML-based language.
129
6.4 VisTool user interface description language
Figure 46–The screen for comparing user interface description languages
We will take XAML as an example. Figure 46 is the screen that we will make with XAML and with VisTool. Figure 44 shows the user interface description in XAML. It starts with complex declarations of namespaces. Those namespaces must match for creating a control. It is quite user unfriendly to non-programmers. It is also error-prone
Figure 44–XAML
Figure 45–VisTool
and cumbersome for a programmer to write those kinds of 130
6.4 VisTool user interface description language
description. Figure 45 is our solution to the same screen. We deliberately align VisTool code to the XAML version so that readers can compare. We show the grammar of VisTool user interface description language in Figure 47. The grammar is straightforward. So unlike XML-based user interface description languages such as Extensible Application Markup Language (XAML), VisTool user interface description language has a high readability.
Vis ::= { identifier
:" ANYButNewLine }
{ NewLine "-" {"-"} NewLine
identifier
":" identifier
{ NewLine identifier
":" ANYButNewLine }
}
Figure 47–The grammar of the VisTool user interface language
131
Chapter 7 Evaluation In Chapter 2.9, we defined the research questions: (1) Is it possible to develop user interfaces and customized visualizations with spreadsheet-like formulas? (2) Is this formula-based approach accessible to user interface designers? To answer these questions we will evaluate VisTool in these ways: (1) VisTool expressive power – what kinds of graphical presentations VisTool can build. (2) VisTool usability. (3) VisTool performance (speed). The expressive power shows how much a designer can do with VisTool. For instance, can they make customized visualizations and create new visualizations? To evaluate VisTool usability, we first use Cognitive Dimensions and compare VisTool with the other state-of-art tools. We use Cognitive Dimensions, because Cognitive Dimensions can be used to evaluate artifacts in the early development phase [Green 1998] at which time VisTool was not stable for usability testing. Furthermore, Cognitive Dimensions are useful for evaluating a system that must consist of notation and its environment [Kutar 2000]. Second, we conducted usability tests. When the author left the project, VisTool was unstable for usability testing. For instance, the system crashed when formulas were wrong and gave no useful error messages. The other team members continued development and conducted usability tests. We will summarize their results. Third, we compare development efforts with VisTool and with the traditional rapid application development. It indicates to what extent VisTool improves development time (i.e. task efficiency). 132
Chapter 7 Evaluation
Software with inadequate performance will never be usable to the end user. For this reason we also evaluate VisTool performance.
Figure 48–The Data State Reference Model [Chi 2000]
133
7.1
An evaluation of expressive power
7.1 An evaluation of expressive power In this section, we will utilize a taxonomy of visualization techniques to evaluate VisTool expressive power – what kinds of graphical presentations that VisTool can build. The taxonomy is based on the Data State Reference Model [Chi 2000]. Figure 48 shows a data flow diagram of the model [Chi 2000]. The model decomposes the visualization pipeline into three data processing steps – Data Transformation, Visualization Transformation and Visual Mapping Transformation, and four data stages – Within Value, Within Analytical Abstraction, Within Visualization Abstraction and Within View. The first data stage (i.e. Value) is raw data. The last stage (i.e. View) is a data presentation that an end user sees. The other data stages are intermediate data between the raw data and the presentation. A contribution of the taxonomy is that it lists the required operators in each step for various visualizations. There are two kinds of operators: (1) operators that change underlying data structure and (2) the ones that do not [Chi 2000].
The operators that do not change underlying data structure are Within Stage Operators – Within Value, Within Analytical Abstraction, Within Visualization Abstraction, and Within View. Each kind of operators corresponds to one data stage. They take data in corresponding stage and produce another data. For example, filtering and sorting are Within Analytical Abstraction operators, and do not change data structures.
The operators that change underlying data structures are Transformation Operators, which correspond to three data process steps respectively. For example, parsing information into records creates a set of records, and data structures are changed.
The table shows the stage descriptions from the Data State Model. We also show what each stage is for VisTool.
134
7.1 An evaluation of expressive power
Stage
Description from the Data State Model
Description in the context of VisTool
Value
The raw data [Chi 2000].
Database rows
Analytical Abstraction
Data about data, or information [Chi 2000]
ADO.NET rows representing database rows, table and field descriptions.
Visualization Abstraction
Information that is visualizable on the screen using a visualization technique [Chi 2000]
ControlInstance objects. A ControlInstance encapsulates .NET controls (i.e. visual objects) with the corresponding Analytical Abstraction (i.e. ADO.NET rows).
View
The end-product of the visualization mapping, where the user sees and interprets the picture presented to her [Chi 2000].
Visual objects on screen
Similarly, we show the processing steps from the Data State Model and what they mean to VisTool.
135
7.1 An evaluation of expressive power
Processing Step
Description from the Data State Model
Description in the context of VisTool
Data Transformation
Generates some form of analytical abstraction from the value [Chi 2000].
Queries the database.
Visualization Transformation
Takes an analytical abstraction and further reduces it into some form of visualization abstractions, which is visualizable content [Chi 2000].
Creates a ControlInstance object for each row. A ControlInstance contains fields, properties for analytical purposes (e.g. Index), and visual object properties. Formulas specify those values.
Visual Mapping Transformation
Information that is visualizable on the screen using a visualization technique [Chi 2000].
Creates zero or more visual objects based on the template selected by the designer.
We cannot directly apply the Data State Reference Model in user interface design. First, the model assumes that each visual object in a View represents a data item from the Value (i.e. raw data). But this is not completely true in user interface design. A user interface object might not represent data, but represents a function. For example, a button represents a function for opening a file. As a result, some visual objects will become a View without going through Data Transformation and Visualization Transformation.
136
7.1 An evaluation of expressive power
Second, the model does not take dependency into account. For example, the position of a View might depend on another View's position. Data Transformation, the 1st processing step in the visualization pipeline, might need the View's data for an end user's input. Third, although the model describes some interaction operators such as dynamic-querying, it does not suggest the impact of interactions on the Value (i.e. raw data). For example, an interaction might change the raw data such as database contents, images on the disk, etc. The model does not suggest what should happen to the visualization pipeline after such changes are made. So we make some assumptions in the model for evaluation.
Each template has its own visualization pipeline.
If a template has an unspecified DataSource, it creates a visual object without Data Transformation and Visualization Transformation.
If a property depends on another template's property, the formula calculation might start the visualization pipeline of the dependency template.
A user interaction might result in new visualization pipelines to re-generate the final presentation (i.e. View).
We will show what operators VisTool provide. After that, we introduce what operators in the taxonomy are supported by VisTool operators. Because the taxonomy classifies operators for various visualizations, we can conclude the VisTool expressive power. This evaluation can also give hints on how to implement various graphical presentations by combining operators, and what operators we can provide in the future to support novel graphical presentations.
137
7.1
An evaluation of expressive power
Operator
An Example of operator specification
Comments
Within Value (Database rows) Query the database
N/A
This is managed by VisTool.
Commit changes into the database
Click: Commit()
In the example, the current template is a Button.
Data Transform (Database query)
Sort records
DataSource: tblPatient order by ptID
In the example, tblPatient is a table. PtID is a field of tblPatient.
Sort records with new pipelines
DataSource: tblPatient order by txt!Text
In the example, txt is another template. Its DataSource is unspecified.
Filter out records
DataSource: tblPatient where ptID=1
Filter out records with new pipelines
DataSource: tblPatient where ptName = txt!Text
In the example, ptName is a field,
Group records
DataSource: tblPatient group by age
In the example, age is a field,
Click: Requery()
All records are deleted first. Re-query the database and create new records. In the example, the
Re-query
138
7.1 An evaluation of expressive power current template is Button. Click is an event property.
Join a table
Create a one-level parent-child hierarchy
Concatenate fields from a new table
DataSource: tblPatient -< relMedOrder
RelMedOrder is a relationship from tblPatient to tblMedOrder.
Parent: chartBox
This operator applies for data hierarchy. In the example, chartBox is a template.
Text: me >- relNote . Decription
In the example, the current DataSource is tblMedOrder. RelNote is a relationship from tblMedOrder to tblNote.
Within Analytical Abstraction (Row)
Access a field or an aggregate field
Text: me . Count(*)
In the example, the Text formula creates an aggregate field. The result is a total number of records.
Access a field or an aggregate field with new pipelines
Text: lblPatient . Count(*)
In the example, lblPatient is a template.
Click: Sample . result = 1
In the example, sample is a template. Result is a field in the sample. Click is an event property.
Change a field value in a row
139
7.1 An evaluation of expressive power Delete/Create a row Visualization Transformation Transform a domain value into a presentation value
BackColor: state = 1 ? "Green" : state = 2 ? "Yellow" : state = 3 ? "Red" : "Black"
In the example, state is a field.
Transform a domain value into a presentation value by a built-in method with new pipelines
Left: timeScale!HPos(startTime)
In the example, timeScale is a template. HPos is a built-in method to transform a DateTime value into the pixel position on screen.
Calculate a presentation value
Height: Me!Index * 10
Calculate a presentation value with new pipelines
Height: Me!Index * 10 + txt!Left
In the example, txt is a template.
Set z-Order
ZOrder: 10
Z-Order is a special operator. Changes on z-Order results in a new parent-child hierarchy of visual objects. This operator applies for the visual hierarchy.
Set z-Order with new pipelines
ZOrder: txt ! Zorder
140
7.1 An evaluation of expressive power Within Visualization Abstraction (Row + Visual object properties) Set container
Container: panel
This operator will result in a new pipeline.
Find a visual object
Example 1: Me -= StationLabel Example 2: Me ! Find ("ptID = 1.2")
This operator will result in a new pipeline. In the second example, Find is a method provided by a template.
Click: Update()
This operator might result in a new screen, because formulas will be re-calculated and visual object properties will be reset. But the operator does not change the underlying row.
Refresh screen
Visual Mapping Transformation Create visual objects based on the template
N/A
This operator is managed by VisTool.
Set presentation values e.g. color, left, etc.
N/A
This operator is managed by VisTool.
Within View Rotate
This operator is supported by some visual objects.
Open a new form/dialog
This operator starts pipelines for the new form.
141
7.1 An evaluation on expressive power
We will give a broad-brush introduction on what taxonomy operators VisTool supports. There are several reasons that we cannot show a comprehensive evaluation for each operator. First, the operators explained in the taxonomy take many forms in VisTool. Some require a designer's specification, some don't. Some are applied by formulas; some are done by templates. Some are realized by VisTool operators (e.g. -), special symbols such as curly braces, etc. A designer must escape them. For instance, he should write "{}{" for an opening curly brace ( { ).
170
7.2.5 Error-proneness The second kind of errors results from grammars for different values. There are many kinds of values in the platform. The designer should specify a value in the correct format. For instance, a mark extension value should be enclosed in curly braces. A literal string should be enclosed in double quotes.
Third, the platform allows programmers to extend XAML by markup extensions. The different grammars for markup extensions results in many inconsistencies. For instance, in a namespace declaration, a semicolon (;) is the delimiter to separate a namespace and an assembly name. Whereas in a data binding specification, a column (,) is delimiters for properties, etc. Last, careless errors are resulted from semantics. The same concept such as a data binding can be described in different ways. For instance, a binding can be specified with a combination of ElementName and Path. Alternatively, the same binding can be specified with Source, Reference, and Path. In fact, a binding is an object. With XAML, the designer can specify a binding by its constructor or by setting its properties. Grammars for those two ways are slightly different in XAML. If an object has several constructors, it is error-prone, because it is quite easy to mix up different ways of combinations. Without in-depth knowledge, the designer easily combine elements (e.g.: Source, ElementName, etc.) in a wrong way. The interface builder helps with the first and the second kinds of mistakes. The builder can generate XAML code, and provides intelli-sense for XAML construction. However, the interface builder does not provide good support for the third kind of mistakes. Some markup extensions are programmed by a third party. So the builder cannot give suggestions on delimiters. For the last kind, the intelli-sense only shows element names, but does not suggest which combination of elements is correct. If a wrong combination is specified, the designer can only know at run-time.
171
7.2.5 Error-proneness
7.2.5.1 Summary VisTool turns out to be the most error-free system among the three. Case-insensitivity and the interface builder achieve this. Protovis and XAML are error-prone. Both are case-sensitive. Misspelling names (e.g. properties) are often. Protovis does not provide intelli-sense. So no remedy is available for Protovis. The XAML interface builders mitigate the viscosity. However, the platform (e.g. WPF) provides many objects with different ways to specify. For instance, an object might be specified by using its constructor or setting properties. The interface builder helps little with this case.
7.2.6 Hard mental operations Definition: High demand on cognitive resource [Green 1996]. Green and Petre suggest that hard mental operations "must lie at the notation level, not solely at the semantic level"[Green 1996]. They further explain that this dimension indicates how to design good notations rather than "the question of which meanings are in themselves hard to express, whatever the notation"[Green 1996].
VisTool
VisTool provides join operators such as join-many (--) for table navigation. A user interface designer can combine several of them to specify complex table navigation from one to another. Join operators are symbolic. -< symbolizes the one-to-many cardinality. It can be understood that the first character (-) symbolizes one and the second (- symbolizes the many-to-one cardinality. So a user interface designer should be able to combine them without difficulty. Some inexperienced designers may have difficulty understanding the cardinality e.g. one-to-many. This problem originates from the 172
7.2.6 Hard mental operations semantics, which is not a problem of the notation design. However, it indicates that some preliminary training about ER models and relationships is necessary.
Furthermore, due to abstraction gradient, some designers might feel difficult in understanding that a formula expresses the look-and-feel of a bundle of controls. A formula represents collective values and the result of a formula evaluation of a specific control is an individual value. This problem can be mitigated by VisTool interface builder. The builder shows the resulting screen whenever the designer finishes a formula.
Protovis
Because Protovis is not limited to relational data, it provides a few functions to transform data from one structure to another. For example, the function Flattern transforms a hierarchical structure into a one-dimensional array. Some transformations are difficult to imagine. It is not unusual for a designer to see examples first and then do transformation in a trial-and-error way. In particular, after several data transformations are performed, it is not easy to follow what the final structure will be.
XAML
The platform provides various objects for functionality. For instance, the platform provides 181 classes for changing property values in animations [Nathan 2010]. A hard mental operation occurs when a designer combines objects to achieve his desired result. For instance, to draw a Bezier curve with XAML, he must figure out the correct objects to use. Those include Path, PathGeometry, PathFigure, QuadraticBezierSegment, and Point. Then the designer must link them in the correct sequence and associate each of them with correct properties.
173
7.2.6 Hard mental operations
7.2.6.1 Summary Hard mental operations steepen the learning curve. With VisTool, walking from one table to another is hard to imagine for beginners. Similarly, data transformation in Protovis is difficult to grasp as well. The problem with XAML originates from notation. It is normal to have more objects when the number of functions grows. VisTool interface builder and the XAML do not improve this dimension.
7.2.7 Premature commitment Definition: Constraints on the order of doing things force the user to make a decision before the proper information is available [Green 1996].
VisTool
With interpretive formulas and the interface builder, VisTool removes Premature Commitment during user interface development process. According to the Data State Reference Model, raw data goes through several steps in the visualization pipeline to become the presentation (i.e. View) on screen. The interface builder shows the presentation values. This reminds the designer that some presentation values are already available. Hidden dependencies allow a designer to refer to that value. Hence, a designer can avoid thinking the intermediate steps and data in a visualization pipeline, when he reuses the pipeline. Those are Premature Commitment in the Cognitive Dimensions. This removal of Premature Commitment frees a designer from intermediate steps in the visualization pipeline to reach his design goal. With VisTool, writing formulas in properties is sequence-free. The designer need not consider the sequence of calculating formulas as in programming languages like C#, Java, etc. VisTool finds a proper sequence for calculating them. This avoids foreseeing the sequence of retrieving data, creating controls, calculating properties, etc. 174
7.2.7 Premature commitment However, a VisTool premature commitment is that the designer should know the template DataSource before referring to a field value in the formula. A sequence of using a field is that the designer looks up which table the field is from, and then checks if the DataSource has records from that table. If not, the designer changes the DataSource, and may change Parent too.
Protovis
Protovis does not support searching for a visual object by means of data and its presentation. For instance, Protovis does not support referring to an arbitrary visual object. A workaround is to compute values for the intended presentation and embed those values into data. This step is Visualization Transformation in the data state reference model [Chi 2000]. Through the step, all necessary values will be available without searching for a visual object. However, if he wants to reuse values, there is a premature commitment to visualization operators – what operators in one pipeline are needed so that another pipeline can correctly process. For instance, one pipeline transforms data and does some data formatting. The difficulty is that the designer cannot predicate precisely what operators he should implement. If the processed data in one pipeline cannot be consumed by another pipeline, he will revise the operators. This difficulty becomes more and more severe when more hidden dependencies are involved, because a dependency is a new visualization pipeline. Procedure code is another kind of premature commitments. For instance, before formatting data, the designer should declare variables, and program in the appropriate sequence, etc. Apparently, at the very outset of programming procedural code, he does not know precisely what variables he declares, and so on. Protovis does not provide an interface builder. The designer frequently switches between code and the presentation (e.g. a
175
7.2.7 Premature commitment
browser). But the lack of interface builder does not make the problem worse.
XAML
XAML is declarative. This avoids the premature commitment resulting from the procedural code. For instance, a designer can show a visual object without considering if its placeholder is created in the previous code. With a style, the designer specifies appearances for a bundle of visual objects by defining property setters. A style collects shared user interface specification. When specifying a style, the designer foresees what visual objects and what properties should be involved. As a result, styles enforce two premature commitments, (1) the commitment to visual objects and (2) the commitment to properties. Since a style can be attached to an arbitrary control, the designer should anticipate the range of controls that apply the style. After a preliminary style is done, he might find out the scope is inappropriate and redefines it. For instance, the designer specifies a style for all controls, but later on he realizes that Textbox and Button should be exempted from the defined scope as they will have a different look. Likewise, the designer cannot precisely foresee property setters in a style. When the list of property setters does not suffice, he will revise it. The interface builder does not help with premature commitments.
7.2.7.1 Summary VisTool avoids some premature commitments in the visualization pipeline. VisTool Interface builder shows values at the end of the pipeline. Hidden dependencies allow for referring to those values. So a designer avoids thinking a series of visualization operators in the pipeline, when he reuses the values. However, the designer must
176
7.2.7 Premature commitment precisely foresee DataSources before he specifies properties. For a complex presentation, he might often revise DataSources.
Protovis has premature commitments to visualization operators, if a designer reuses visualization pipelines. Procedural code is a common source of premature commitments. Protovis retains the commitments introduced by procedural code for advanced functionality. XAML avoids a premature commitment with its declarative style. However, styles, templates, etc. introduce plenty of premature commitments. A designer cannot precisely know what visual objects will be applied to and what properties will be set. Usually, he defines a broad scope of controls and property setters. Iteratively, the designer limits the scope.
7.2.8 Secondary notation Definition: Extra information carried by other means than the official syntax [Green 1996].
VisTool
Green explained that indentation or "pretty-printing" in code was a kind of secondary notation. Secondary notation makes code easy to read and write. It is useful for iterative design, where "the part-finished structure is inspected and re-interpreted."[Green 1998] The Formula Language supports secondary notation. The language is case-insensitive. So a change in capitalization has no adverse impact on the evaluation result. A designer can prefer their favorite coding style. Furthermore, a designer can write comments in the code. It helps the designer understand the formulas composed by another designer.
177
7.2.8 Secondary notation
Protovis
Because of grammar restrictions in JavaScript, Protovis is case-sensitive. So a programmer must adhere to some coding styles. He also can write comments in code.
XAML
XAML supports comments as secondary notation. It is case-sensitive.
7.2.8.1 Summary All systems support secondary notation. VisTool is case-insensitive. Protovis and XAML are case-sensitive.
7.2.9 Diffuseness Definition: Verbosity of language [Green 1996].
VisTool
The Formula Language is as terse as spreadsheet formulas. The language supports reuse of formulas by means of references. The language makes database queries more compact than general SQL.
As an example, in the health record overview (Figure 29), medicine boxes are aligned to medicine label's Top properties. It means that a programmer has to follow this sequence: create medicine labels, calculate label's Top positions, and then calculate medicine box's Top positions. This sequence is explicitly expressed in code. With VisTool a designer specifies the same operation simply in the formula me >- tblMedType -= orderInfo!Top. The interface builder helps with diffuseness. The direct manipulation generates code for template. The intelli-sense speeds up formula writing. 178
7.2.9 Diffuseness
Protovis
Because of abstraction gradient, Protovis is terse to set properties. For example, loops and method declarations are avoided. However, the toolkit still retains a procedural style of programming. For instance, a designer might still declare variables and program loops. So it is not as terse as spreadsheet formulas. Protovis does not provide interface builder.
XAML
The designer specifies styles, templates, skins, etc. and reuses them to shorten code. But if these are not reused, the code is not terse, because many markups and special symbols exist in code. The interface builder generates some XAML code by direct manipulation and intelli-sense.
7.2.9.1 Summary VisTool formulas are as terse as spreadsheet formulas. Hidden dependencies support formula reuse. VisTool Interface builder generates formula to improve diffuseness. Protovis is terse to set properties, but retains a lot of procedural programming. It is not as terse as we expected. XAML is terse only when the designer can reuse styles, templates, etc. Plenty of markups and symbols in XAML make code verbose. However, the interface builder removes this verbosity.
7.2.10 Juxtaposability Definition: Juxtaposability: ability to place any two components side by side [Green 1996].
179
7.2.10 Juxtaposability
VisTool
With VisTool interface builder, the designer can see all information needed for user interface design at the same time. The builder shows one panel for the properties, one for Entity-Relationship diagram, one for the final result, etc. Furthermore, the intelli-sense feature helps the designer select words, which speeds up formulas writing and reduces the likelihood of misspelling names.
Protovis
Protovis does not provide an interface builder.
XAML
XAML interface builder provides good juxtaposability. A designer is free to dock or stack a panel on the builder. He is able to see several panels simultaneously.
7.2.10.1 Summary Both VisTool and XAML provide good juxtaposability.
7.2.11 Summary VisTool rates high on closeness of mapping, abstraction gradient, viscosity, error-proneness, secondary notation, diffuseness, and juxtaposability. VisTool contributes to a high-level approach to user interface and visualization development. This high-level approach consists of several building blocks. First, the closeness of mapping eliminates many programming primitives. The designers think about user interface concepts instead of low-level implementation details. This augments the usability factors – learnability and memorability. Second, hidden dependencies and the removal of a few premature commitments are helpful for reducing development time. Third, the high rating on diffuseness shortens lines of code. These augment the usability factor – task efficiency. 180
7.2.11 Summary However, the evaluation shows that some designers may have difficulty with understanding data relationships. For example, they may find it difficult to find the correct relationship for navigating to fields. An ER diagram may help solve that problem. For example, the designer searches the fields in the ER diagram, and then the diagram suggests a relationship to use based on the formulas that the designer is typing. More investigations are required to see the feasibility and usability of this solution.
Protovis rates high on closeness of mapping, abstraction gradient, diffuseness, and secondary notation. But Protovis retains procedural code for advanced functionality. As a result, the closeness of mapping, diffuseness, and viscosity do not rate as high as VisTool. Protovis provides more abstraction gradients than VisTool. This allows for rapid visualization development. A severe usability defect is that Protovis does not provide an interface builder. It degrades many dimensions such as viscosity, premature commitment, etc. XAML rates high on abstraction gradient, secondary notation and juxtaposability. XAML based on WPF is the most powerful system among the three. For instance, XAML provides more abstraction gradients than VisTool and Protovis. However, the advanced power sacrifices the closeness of mapping. The distant mapping results from plenty of concepts (e.g. what objects to use) and inconsistent ways of specifying them with XAML. Furthermore, due to the XML-based syntax, it is error-prone to program XAML. The interface builder remedies the problem by code generation, but cannot improve the closeness of mapping, viscosity, error-proneness, and diffuseness to the level of VisTool and Protovis.
7.3 Usability tests of VisTool interface builder The other team members usability tested and improved VisTool interface builder. In total the VisTool team has tested with 24 non-programmers and 6 visualization programmers. In this section, we summarize some of the test procedures and the results. 181
7.3
Usability tests of VisTool interface builder We conducted several series of tests with different user profiles and different procedures. All tests classified the observed problems in this way [Lauesen 2000]: Missing functionality: The system cannot support the user's task. Task failure: The user cannot complete the task on his own or he erroneously believes that it is completed. Annoying: The user complains that the system is annoying or cumbersome; or we observe that the user doesn't work in the optimal way. Medium: The user finds the solution after lengthy attempts. Minor: The user quickly finds the solution after a few short attempts.
7.3.1 Usability test with a tutorial and non-programmers One series of tests used a written tutorial. This tutorial introduced VisTool basic concepts including templates, data source, formulas, and VisTool interface builder. At the end of each section of the tutorial, a task was given. Test procedure: During the test, the user read the tutorial in the think-aloud way, and also tried VisTool. Then, the tester asked the user to complete the task that was planned. The tester recorded usability problems that the user encountered. After a test was done, the tester analyzed the results and revised the tutorial for the next test. Each test took around two hours. After each test, the designer also made minor improvements to VisTool. Here is an example. The first two users were confused when they set the Rows (i.e. DataSource) formula. VisTool generated several instances, but the user could only see one, because instances appeared on top of each other. The tester improved VisTool so that it auto-generated formulas that made the instances appear like a staircase. This eliminated the usability problem. User profiles: Five users participated in this test. The users were not programmers, but they had some knowledge of spreadsheet formulas 182
7.3.1 Usability test with a tutorial and non-programmers
or a little programming knowledge. Only one user knew a few database concepts such as tables. None of them had experience in user interface design. These user profiles are below our target users. However, it is still interesting to see to what extent they can learn VisTool. Tasks: The tester designed four tasks. In task 1 and task 2, the users needed to make changes in already-made graphical presentations. In task 3 and task 4, the users needed to implement planned functionality for unfinished graphical presentations. Results: The test showed that all users completed the tasks. For instance, all could write formulas to bind visual properties (e.g. left, color, etc.) to data from the database, and understood the indexing concept, and so on. They could use join operators (e.g. -