housework robots,suddenly find a fallen person in the room, they must call off their cleaning tasks to address the more important problem. Security robots [5], [25] ...
Visual Anomaly Detection from Small Samples for Mobile Robots Hiroharu Kato, Tatsuya Harada and Yasuo Kuniyoshi
Abstract— We propose a novel method of visual anomaly detection for mobile robots in daily real-life settings. Visual anomaly detection using mobile robots is important for security systems or simply for gathering information. However, this task is challenging for two reasons. First, because the number of observed images sampled at the same location is small, anomaly detection systems cannot use standard statistical methods. Second, anomalies must be detected in the presence of other continuous, ambient changes in the visual scene, such as changes in lighting from morning to night. Regarding the former problem, we develop and apply an analysis-bysynthesis-based anomaly detection method for mobile robots. For the latter, we propose a novel definition of anomaly that uses observed samples at other locations to filter out ambient changes that should be ignored by the system. Experimental results demonstrate that our method can detect anomalies from small samples in the presence of ambient changes, which could not be detected by conventional methods.
Fig. 1.
Examples of anomalies in this work.
I. INTRODUCTION In recent years, autonomous mobile robots have been widely developed and they are soon expected to coexist with humans in our day-to-day lives. The action plans for such robots cannot be perfectly programmed in advance. They must develop their action plans on the fly. But, because our environment varies dynamically with time, it is difficult for robots to comprehend their surroundings. For example, how can robots distinguish between natural, ambient changes in lighting versus non-environmental changes in its visual scene? Anomaly detection for the detection of unfamiliar objects is an important task in comprehending environments. The detection of an unfamiliar object in day-to-day scenes should trigger changes in a robot’s action plan. For example, if housework robots,suddenly find a fallen person in the room, they must call off their cleaning tasks to address the more important problem. Security robots [5], [25] or news-gathering robots [16] mainly do visual anomaly detection in the real world. Furthermore, anomaly detection robots are useful in robots which must work in environments that are harmful to humans, such as in nuclear power plants or in outer space. However, visual anomaly detection for robots which physically move around in the real world is more challenging than for surveillance cameras because the number of observed images at any one location is small, so standard statistical anomaly detection methods used in surveillance cameras Hiroharu Kato, Tatsuya Harada and Yasuo Kuniyoshi are with the Department of Mechano-Informatics, Graduate School of Information Science and Technology, The University of Tokyo, 7-3-1 Hongo, Bunkyo-ku, Tokyo, JAPAN 113-9656. {kato, harada,
kuniyosh}@isi.imi.i.u-tokyo.ac.jp
Fig. 2.
Example of normal in this work.
cannot be directly applied. Second, our living space has dynamic variations in appearances caused by environmental changes in lighting, time, weather, and so on. Anomaly detection must be robust against such variations. In this work, we tackle these two problems and propose a novel anomaly detection method for mobile robots. Fig. 1 portrays examples of anomalies we presume to exist in this work. The left images were taken previously and dealt with as normal images; the right images were taken thereafter. The right images include the appearance of a new anomalous object. We want to evaluate the right images as anomalies from the left images. The image on the right side of Fig. 2 is not an anomaly however, because no anomalous object exists even if there are ambient changes such as a form of a illumination change from morning to night. Therefore, there are many definitions of anomalies, and many approaches might be used to address their detection. In the next section, we will discuss them and clarify the main problems addressed in this paper. II. RELATED WORK In this section, we first describe visual anomaly detection systems for robots and point out their problems. Next, we show some anomaly detection systems for fixed cameras and infer from them some useful methods to carry out our
objective.
TABLE I C LASSIFICATION OF V ISUAL A NOMALY D ETECTION .
A. Anomaly Detection Methods for Non-Fixed Cameras Most visual anomaly detection systems for non-fixed cameras compare two or more images taken at the same location to detect an anomaly. Sato et al. [23] aimed to detect appearances or changes of buildings from a vehicle camera. They defined an anomaly as the distance from the feature vector of the current image to that of the past image. Primdahl et al. [20] compared two images more directly to detect unfamiliar objects, seeking unmatched points of both images. Anomaly detection methods to search unmatched points are accurate and sufficient to detect the region of the anomaly from images. However, those methods depend on the difference of two images at the same locations. Therefore, they have a susceptibility to ambient changes caused by changes in lighting, time, weather, and so on. Such changes are common in the real world. Furthermore, generally the location information of non-fixed cameras is not accurate. The ways to get location information such as GPS, acceleration sensor, odometry, and SLAM have more or fewer errors. Therefore, it is difficult to get an image that was taken at exactly the same location. In many cases, seeking matched or unmatched points in two images can yield inaccurate results. There are approaches to transform the image to adjust the error of location information. However, if there are ambient changes projective transformation is difficult. Therefore, it is desirable to treat images as a feature vector than to treat images as raw pixels for comparison. An anomaly detection method for an inspection robot proposed by Neto et al. [25] utilizes no location information of the robot. Their system is free from the small sample problem of the same location, but it cannot detect anomalies depending on their location. Suzuki et al. [24] proposed a statistical approach to attack the temporal and spatial non-uniformity of observed samples. The amount of samples required by their method is large. Though their news-gathering robot can collect sufficiently large samples, it is not necessarily possible to collect. The works described above are anomaly detection systems for mobile robots. The point is that most anomaly detection systems do not take account of ambient changes. The other methods require large image samples because they propose some kind of a statistical anomaly detection method. Conventionally, no method addresses ambient changes from small samples. It is therefore impossible to detect anomalies such as Fig. 1. To solve those problems, we need a new approach to address ambient changes: one which is not based on a comparison of images or a statistical method. B. Anomaly Detection Methods for Fixed Cameras Visual anomaly detection methods for fixed cameras have become far more widely developed along with the popularization of surveillance cameras. They are classifiable into four general groups: classification-based methods, nearestneighbor-based methods, statistical methods, and analysisby-synthesis-based methods. This classification fundamen-
Classification Nearest Neighbor Clustering
Statistical
Analysis-by-Synthesis
Fixed Camera Piciarelli et al. [19] Dong et al. [11] Adam et al. [1] Kim et al. [12] Benezeth et al. [2] Saleemi et al. [22] Mehran et al. [17] Cui et al. [9] Boiman et al. [3], [4] Pruteanu et al. [21] Cong et al. [7] Zhao et al. [27]
Non-Fixed Camera Sato et al. [23] Primdahl et al. [20] Neto et al. [25]
Suzuki et al. [24]
Our work
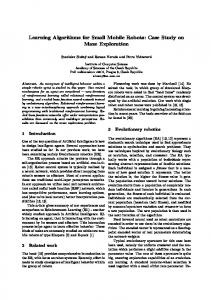
Fig. 3. Visual Image of Anomaly Detection based on Reconstruction. y is the target vector to be reconstructed. D is the matrix which consists of vectors used for a reconstruction. a is a reconstruction weight vector.
tally relies upon [6]. We classified major visual anomaly detection works as Table I. Because the number of available images is comparatively large, statistical [1], [2], [9], [12], [17], [22] or classificationbased [19] methods are often used for anomaly detection at fixed cameras. Though those methods enable flexible and precise anomaly detection, it is difficult to apply them for non-fixed cameras. On the other hand, analysis-by-synthesisbesed methods are recently developed and successful at fixed cameras [3], [4], [7], [21], [27]. Those methods have not been applied for non-fixed cameras yet. However, they seem to be useful at non-fixed cameras since they work robustly from relatively small samples. Therefore, in this work we try to apply analysis-by-synthesis-based methods for robots. Using analysis-by-synthesis-based methods, anomaly is defined as ”a sample that can not be explained using a combination of normal samples.” This notion was introduced early to visual anomaly detection by Boiman et al. [3], [4]. They give the following example. An image of him raising both hands is also normal if an image of a person raising his right hand and a image of him raising his left hand are both defined as normal. Cong et al. [7] and Zhao et al. [27] expand this notion and defined visual anomaly as ”when reconstructing a sample (feature vector) by linear combination of small normal samples (feature vectors), anomaly is the sum of the reconstruction error and the cost to use many samples.” They reported that this definition is robust even if the dimension of feature vectors is high and the number of observed samples is small. We present a visual image of an analysis-by-synthesisbased approach as Fig. 3. Although the top-left image can be
reconstructed from three images shown at right, the bottomleft image, which includes an anomalous poster, cannot be reconstructed unless using an image of the poster. III. METHOD As presented in the preceding section, two problems exist in a visual anomaly detection task for robots. One is shortness of observed samples at one location, which makes it difficult to treat observed samples statistically. The other is ambient changes, which disables image comparison-based approaches mainly developed in robotic works [23], [20]. For the former problem, we develop and apply an analysis-bysynthesis-based approach to compute a reconstruction error for mobile robots. To address the latter problem, we propose a novel definition of anomaly which uses the observed samples at other locations to handle ambient changes. In our method, the robot takes a photograph while moving and computes the difference of the current image and the past image at the same location. Then, the system determines if the difference is anomalous or not from the differences of other locations. In subsection A, we explain the reason to compute the differences from past to present and how to represent them. In subsection B, we describe the means to compute an anomaly from observed samples.
Fig. 4. Previous work attempted to reconstruct the current image from all the images ever observed. This implies abandonment of their location information, and that the flexibility of reconstruction is too high.
A. Method to Utilize Surrounding Information Conventionally, most visual anomaly detection methods for mobile robots with their location information evaluate the anomaly of the current image from past images taken at the same location. However, this approach is weak at ambient changes. It is necessary to utilize surrounding information effectively if there are ambient changes. In such an approach, it might be useful to evaluate a current observed image from all observed images at any locations. The visual image of this notion is presented in Fig. 4. However, when we adopt an analysis-by-synthesis approach, this approach presents a problem: the flexibility of a reconstruction is too high. Free use of many samples can engender the forceful reconstruction of a current image, which reinforces the anomalous image as a normal image. Furthermore, this approach uses no robot location information. Their usable rich information of the environment is abandoned and anomalies are not detected depending on their context. It is clearly undesirable. Therefore, it seems reasonable to introduce a proper restriction using location information for reconstruction. Therefore, we propose a novel notion of anomaly: if the change at the current location can not be reconstructed by changes at other locations, then the change is anomaly and anomalous objects are here. This definition is explainable using the following example. When a robot visits a place at night where he has once visited in the morning, a new anomalous object appeared there. At this place, the change from past to present includes an illumination change caused by the passage of time from morning to night and a visual change attributable to the anomalous object. Around this location, appearance changes only include illumination changes. Therefore, changes (illumination, appearance of
Fig. 5. The proposed method attempts to reconstruct the change of images at the current location from changes of images at other locations. This imposes a constraint on the flexibility of reconstructing using their location information.
new object) at the current location can be regarded as anomalous in the context of the surrounding changes (illumination only). We show the visual image of our definition in Fig. 5. The bottom-right image in Fig. 5 is an example of images at the current location. The past image taken at the current location is the top-right image. The differences of images at the current location are an illumination change and an appearance of a poster. Other images in Fig. 5 show examples of images at surrounding locations, which include only illumination changes. The change at the current location includes an appearance of a poster. Therefore, it cannot be reconstructed from changes at other locations, which are without posters. The change at the current location is anomalous, which implies the existence of anomalous objects. Here, a robot has started moving at location 1, passed location 2, 3, 4, ..., and arrived at location P now. This robot has previously walked the same route for T − 1 times. We define xi,t as the feature vector of the image at location i observed during t th visit. To simplify matters, now we define T = 2. In this situation, the target to evaluate an anomaly is simply the following: yP = xP,2 − xP,1
(1)
This is the difference of images taken at the current
location. Difference simply means to compute the difference of two vectors. The normal data to be used for evaluation above are the following. yi = xi,2 − xi,1 (i = 1, 2, 3, ..., P − 1)
(2)
Those are the differences at all the other locations. If T > 2, then the mathematical expressions become somewhat complicated. In such situations, the target to evaluate an anomaly becomes the following: yP = xP,T − xP,1
(3)
Normal data to be used to evaluatethe expression above are shown below.
IV. EXPERIMENT
yi,t = xi,t − xi,1 (i = 1, 2, 3, ..., P − 1,t = 2, 3, ..., T )
(4)
The reason to compute differences from t = 1 only is explained as the following. The difference to t 0 (6= 1) can be represented as shown below. xi,t − xi,t 0
= xi,t − xi,t 0 + (xi,1 − xi,1 ) = (xi,t − xi,1 ) − (xi,t 0 − xi,1 ) = yi,t − yi,t 0
(5)
This equation shows that the differences from t 0 (6= 1) can be represented as a linear combination of equation 4. We attempt to reconstruct the target by a linear combination, the details of which is described in the next subsection, so the differences from t 0 (6= 1) are included in the formulation. B. Sparse Coding Based Anomaly Detection The next problem is evaluation of the anomaly of yP from yi,t (i = 1, 2, 3..., P − 1,t = 2, 3..., T ). In section II, we described analysis-by-synthesis-based anomaly detection methods. Herein, we modify sparse-coding-based anomaly detection methods [7], [27], which are a type of analysisby-synthesis-based method. We simplify their method and compute an anomaly value using the following formula. Anomaly = min ky − Dak22 + λ kak1 a
a is a reconstruction combination vector, which represents the weights to combine for each image. For L1normalization, a becomes a sparse vector, at which almost all dimensions of the vector are 0 and only few dimensions have a non-zero value. It means the number of images used to reconstruct have high cost. This restriction is based on the notion that normal images can be reconstructed by few images, and anomalous image can not. λ is an L1regularization parameter. It means the cost to use many images. The optimization problem of equation 6 is solvable quickly using the algorithm by Lee et al. [14]. The load of computation is sufficiently low that anomalies can be detected in real time on robots.
(6)
y = yP is the target vector to reconstruct, the dimension of which is equal to the dimension of that of a feature vector of an image. We define d as the dimension of y. D is a d × K matrix. It is an array of feature vectors used in reconstruction. K is the number of vectors to be used. At first glance, it is apparent that K can be equal to the number of yi,t (i = 1, 2, 3..., P−1,t = 2, 3..., T ) . However, the dimension of feature descriptor can be somewhat low and the number of vectors to be used in reconstruction can be higher. Therefore, we are inspired by LLC [26], and restrict vectors to use in vectors near the reconstruction target vector. Here, we take K neighbor vectors to use. Therefore K can be designated as a locality-constraining parameter. We define a matrix D as D = [y01 , y02 , y03 , ..., y0k ], y0j is the j th nearest vector to y in yi,t (i = 1, 2, 3, ..., P − 1,t = 2, 3..., T ).
A. Confirmation of the Usefulness of Proposal Method We applied our proposed method to images with location information collected by a mobile robot. The robot moves on its wheels, and computes its approximate location using odometry. To collect data, it moved a certain route in a hallway of a university building three times. One series of data is collected during morning as assumed in a past visit. The other one is collected at night as assumed in a present visit, which includes the appearance of a new object. The rest series is collected at night, as assumed in a present visit for comparison, which includes no new objects. We show part of collected images in Fig. 6. The objective of our experiment is to verify that our method evaluates the second series of data as anomalous from the first series of data, and that it evaluates the third series as normal. We already described the smallness problem of images taken at the same location. This experiment assumes that the number of images at a certain location is ultimately small: only two. We preprocessed the collected three series of data. We split the route to 100 locations at regular intervals. Location 1 (left edge of Fig. 6) is the start point of the route and location 100 (right edge of Fig. 6) is the end point of the route. Next, we sought one image taken at each location from each series of data and assigned it to the image at the location for each series of data. Consequently, we obtained 100 locations with three pictures. Using those data, we computed the anomaly of each location. Assuming the robot moved through the route at once in the morning and visited the route again at night, we computed the anomaly of location i using the difference of two images at location i as test data and the differences of two images at location 1 to location i − 1 as normal training data. If i = 1, then we can not compute the anomaly so we defined the anomaly value at the start point is 0. Parameters are the following: L1-regularization parameter λ = 1e − 2, locality-constraining parameter K = 50. For image representation, GIST descriptor [18] is adopted. Using the proposed method, the result of this experiment is Fig. 7. Above the graph are anomalies of Fig. 6 (b) from Fig. 6 (a). The lower graph is anomalies of Fig. 6 (c) from Fig. 6 (a). In both graphs, anomaly values of location 2 to 4 are very
(a) Past Visit ( at morning )
(b) Present Visit (at night with a novel object)
(c) Present Visit (at night without a novel object) Fig. 6. x 10
−3
0.8
6
Anomaly
Anomaly
8
Data used in Experiment of Section IV (a).
4
0
0
10
20
30
40
50 Location
60
70
80
90
100
6 4
20
30
40
50 Location
60
70
80
90
100
90
100
0.6 0.4 0.2
2 0
10
0.8
−3
Anomaly
Anomaly
x 10
0
(a) Anomaly values with an anomalous object
(a) Anomaly values with an anomalous object 8
0.4 0.2
2 0
0.6
0
0
10
20
30
40
50 Location
60
70
80
90
100
(b) Anomaly values without an anomalous object Fig. 7.
0
10
20
30
40
50 Location
60
70
80
(b) Anomaly values without an anomalous object Fig. 8.
Anomaly values computed using nearest neighbor based method.
Anomaly values computed using the proposed method.
high. It means at locations 2–4 the robot is not adjusted to the ambient changes. After that, the robot properly adjusted the environments and the computed anomaly values are low. The main difference of those two graphs appeared at location 85–95. At those locations, the anomalous poster is apparent. The images at location 90 are second from the right in Fig. 6. In the upper graph it is read that anomaly values at those locations are high. On the contrary, in the lower graph, anomaly values at those locations are not high. It means our proposed method can detect an anomalous object in the presence of ambient changes. The decrease of anomaly values after location 95 occurs because the robot passed through the poster. For comparison, we conducted an experiment using a nearest-neighbor-based method. For this experiment, we define the anomaly value as the distance of feature vectors of two images taken at the same location. The result based on this definition is shown in Fig 8. The upper graph shows anomalies of Fig. 6 (b) from Fig. 6 (a). The lower graph shows anomalies of Fig. 6 (c) from Fig. 6 (a). Anomaly
values at locations 85–95 in the upper graph are slightly high, but they are not predominant nor highest. This result is probably derived from ambient changes. Therefore, it is said that the nearest-neighbor-based approach cannot detect anomalies in the dataset. To compare each method quantitatively, we present ROC curves and AUC scores in Fig. 9. In these data, the values of locations 1–5 are excluded because those are values of an adaptation period. Here, we defined location 86 to location 95 as anomalous and the others as normal. The graph demonstrates that our method is superior to conventional approaches, and also that it shows that the limitations we imposed on reconstruction are effective. In above experiments, the frequency of past visit was assumed to be only one. However, the behavior of our system under more past visits is intriguing. Therefore, we collected five more series of data in the morning as in Fig. 6 (a) and computed the anomaly values of Fig. 6 (b) from a total of six prior visits in the morning. The results are shown in Fig. 10. The low anomaly values at locations 2–4 imply that adjustment for the ambient changes is done instantly. The
1
0.8
0.8
True Positive Rate
True Positive Rate
1
0.6 0.4 Proposal (0.989) Proposal without K (0.654) Method in Fig. 4 (0.656) NN (0.876)
0.2 0 0
0.2
0.4 0.6 0.8 False Positive Rate
1
Anomaly
1 10
20
Fig. 10.
30
40
50 Location
60
70
80
90
100
Anomaly values from six prior visits.
whole graph we can read that the degree in separation of anomalous locations and normal locations is improved from Fig. 7. However there is not so much of a difference between the overview of Fig. 10 and that of Fig. 7 above. Therefore, our method is sufficiently robust to be used when the number of past observances at each location is only one. B. Different λ , K and Image Features In this section, experimental results of different parameters or image features are described. Basic experimental settings are the same as the experiment of above subsection. Anomaly values from Fig. 6 (a) to Fig. 6 (b) were computed by the proposal method. To verify the effectiveness of sparse limitation, we altered the value of λ and examined the behavior of our system. AUC and anomaly value ratio of each λ were computed. Anomaly value ratio was defined as mean (anomaly value at location 86-95) / mean (anomaly value at location 7685). This index means the degree of separation of anomaly values at anomalous locations from anomaly values at normal TABLE II R ESULTS OF D IFFERENT λ . A NOMALY VALUE R ATIO MEANS THE DEGREE OF SEPARATION OF ANOMALY VALUES AT ANOMALOUS LOCATIONS FROM ANOMALY VALUES AT NORMAL LOCATIONS .
λ λ λ λ λ λ
K=70 (0.993) K=90 (0.752)
0
0.2
0.4 0.6 0.8 False Positive Rate
1
Fig. 11. ROC curve of different K. AUC scores are shown in parentheses.
1
−3
2
0
K=50 (0.989)
K=100 (0.673)
3
0
K=30 (0.983) 0.4
0
= 1e − 0 = 1e − 1 = 1e − 2 = 1e − 3 = 1e − 4 = 1e − 5
AUC 0.883 0.891 0.989 0.989 0.980 0.944
Anomaly Value Ratio 3.450 3.450 2.765 2.113 1.759 1.718
True Positive Rate
x 10
K=10 (0.974)
0.6
0.2
Fig. 9. ROC curve of each method. AUC scores are shown in the parentheses. ”Proposal without K” means that there is no limitation of size D. ”NN” is a nearest-neighbor-based approach. Our proposed method exceeds others. 4
K=1 (0.870)
0.8 0.6 0.4
GIST (0.989) BoF (0.377) HOG (0.920) ColorHLAC (0.558) ColorHistgram (0.320)
0.2 0
0
0.2
0.4 0.6 0.8 False Positive Rate
1
Fig. 12. ROC curve of each image feature. AUC scores are shown in parentheses. The GIST descriptor is superior to the others.
locations. The results are showed in Table II. If λ is high, reconstruction vector becomes too sparse and AUC value becomes low. If λ is low, anomaly value ratio becomes low. This is because forceful reconstruction from many vectors decreases anomaly value at anomalous locations. To apply the sparse-coding-based anomaly detection method, we limited the vectors used for reconstruction to the K nearest vectors to the reconstruction target vector. To verify the effect of this modification, we altered the value of K and examined the behavior of our system. The results are showed in Fig. 11. K = 100 substantively means that there are no K-NN limitation. The result of this experiment shows that the introduction of K is efficient. At least in this experimental settings, proper value of K is about dozens. We adopted GIST descriptor for image representation in the experiments. Although the results were good, to compare the behaviors of other features can be a contribution because conventional analysis-by-synthesis approaches did not deal appearance features. The results are shown in Fig. 12. GIST used here is 512 dimensions. Bag of Features (BoF) [8] is 500 dimensions, using SIFT descriptor [15]. Histogram of Oriented Gradients (HOG) [10] here is 8424 dimensions, extracted from a grid. ColorHLAC [13] is 45 dimensions. ColorHistogram here is 96 dimensions, 32 bins for each color. This graph shows that GIST is the best and that HOG is the second by a short head.
x 10
x 10
−3
2 1
4 2 0
0
−3
6 Anomaly
Anomaly
3
0
10
20
30
40
50 Location
60
70
80
90
0
50
100
Fig. 16. Fig. 13.
150
200
100
250 Location
300
350
400
450
500
Result of Other Dataset 4 (successful).
Result of Other Dataset 1 (successful).
Anomaly
0.01
Anomaly
0.01
0.005
0.005 0 0
0
50
100
Fig. 14.
150
200
250 Location
300
350
400
450
30
40
50 Location
60
70
80
90
100
Result of Other Dataset 5 (failed).
light, which the robot senses as movement. In Fig. 15 aims to detect a fallen person. This dataset has no ambient changes. As the graph shows, the person is detected. The first peak near location 280 is also caused by a change in the ceiling light. The dataset used in Fig. 16 is of a situation from night to morning. The accuracy is somewhat low, but the appearance of a new board is narrowly detected. Of course our method is not entirely perfect, and some experiments wholly failed. The result shown in Fig. 17 is one such failure. A peak of anomaly appears near location 68, where there is no anomalous object. The poor result was caused by a mistake of robot control. Near this location, the direction of eyes turned left abruptly and the system evaluated it as an anomaly. However, the left tilt is not so large that we can refine the accuracy by transforming images using the robot’s rotation information. This is left as a task for future research.
−3
6 Anomaly
4 Anomaly
20
Fig. 17.
We collected other datasets including other anomalous objects in other routes. We present the results. Figure 13 to 16 are cases of success, and Fig. 17, 18 are cases of failures. In those experiments, the frequency of past visit is 3–6, which do not include the same environment as current environment. For example, test data were collected in the morning, and data of past visits were all collected at night. Fig. 13 is the result of an experiment to detect a poster located at the other place. The poster on the side wall is small in the image, but our method can detect the anomalous object. In Fig. 14 the target is a signboard on the other route. Although its appearance changes from morning to night to a great degree, the board is detected successfully. The first peak near location 280 results from lighting-up of a ceiling
x 10
10
Result of Other Dataset 2 (successful).
C. Experiment using Other Datasets
5
0
500
3 2
x 10
−3
4 2
1 0
0 0
50
100
Fig. 15.
150
200
250 Location
300
350
400
450
Result of Other Dataset 3 (successful).
500
0
50
100
Fig. 18.
150
200
250 Location
300
350
400
Result of Other Dataset 6 (failed).
450
500
The data shown in Fig. 18 also represent a failed result. Near location 330, a fallen person exists, but the anomaly value is not higher than those at other locations. As might be readily apparent, the image at this location is taken against the sun and the man wears black. Therefore, the man is inconspicuous in the image. We use only 2D image and location information. For that reason, we cannot detect the person, but the utilize of 3D camera of which images have depth information can improve the result. Although depth information of 3D image is useless in various situations such as that depicted in Fig. 13, the utilization of depth information is left as a task for future study. V. CONCLUSION We discussed the needs of visual anomaly detection systems for mobile robots and problems of existing work. Then, we specifically examined the following two major problems for mobile robots: (a) the number of observed images at a certain location is small, and (b) most conventional approaches have a susceptibility to ambient changes. Therefore, we proposed a novel method to address those problems. For the former problem, we surveyed the literature related to fixed-cameras and found out that the analysis-by-synthesisbased approaches that have stability even for small samples, are applicable for our task. For the latter problem, we focused on the difference of observed samples in a certain location and proposed a novel definition of anomaly. Our definition makes it possible to use location information of robots and to detect anomalies in the presence of ambient changes. We applied our method and conventional methods to the dataset in which anomalies should be detected in the presence of illumination changes. The results showed that our method can detect anomalies in such a situation and conventional methods cannot. We compared several image features and concluded that GIST is the best of them. Subsequently, we applied ours for other datasets of other anomalous objects in other places. Although most experiments succeeded, on several datasets, we failed. Several points of improvement remain. One is to utilize depth values of images using a 3D camera. This enables detection of anomalous objects that are inconspicuous because of their color. This is also effective in dark places. Another is to transform observed images to compensate for the smallness of samples. Tiny variations of observed locations or angles of shooting can be corrected by that. The other is how to determine threshold for anomaly. Though our method outputs high anomaly value where there is an anomaly object, it is not clear what is sufficiently high value to be taken as anomaly. The threshold may vary depending on the situation or require user-feedbacks. Those are left as subjects for future work. R EFERENCES [1] A. Adam, E. Rivlin, I. Shimshoni, and D. Reinitz. Robust real-time unusual event detection using multiple fixed-location monitors. PAMI, Vol. 30, pp. 555–560, 2008. [2] Y. Benezeth, P.M. Jodoin, V. Saligrama, and C. Rosenberger. Abnormal events detection based on spatio-temporal co-occurences. In Proc. CVPR, 2009.
[3] O. Boiman and M. Irani. Detecting irregularities in images and in video. In Proc. ICCV, 2005. [4] O. Boiman and M. Irani. Detecting irregularities in images and in video. IJCV, Vol. 74, pp. 17–31, 2007. [5] P. Chakravarty, A.M. Zhang, R. Jarvis, and L. Kleeman. Anomaly detection and tracking for a patrolling robot. In Proc. ACRA, 2007. [6] V. Chandola, A. Banerjee, and V. Kumar. Anomaly detection: A survey. ACM Computing Surveys, Vol. 41, pp. 1–58, 2009. [7] Y. Cong, J. Yuan, and J. Liu. Sparse reconstruction cost for abnormal event detection. In Proc. CVPR, 2011. [8] G. Csurka, C. Dance, L. Fan, J. Willamowski, and C. Bray. Visual categorization with bags of keypoints. In Proc. ECCV Workshop on statistical learning in computer vision, 2004. [9] P. Cui, L.F. Sun, Z.Q. Liu, and S.Q. Yang. A sequential monte carlo approach to anomaly detection in tracking visual events. In Proc. CVPR, 2007. [10] N. Dalal and B. Triggs. Histograms of oriented gradients for human detection. In Proc. CVPR, 2005. [11] Q. Dong, Y. Wu, and Z. Hu. Pointwise motion image (pmi): A novel motion representation and its applications to abnormality detection and behavior recognition. Circuits and Systems for Video Technology, Vol. 19, pp. 407–416, 2009. [12] J. Kim and K. Grauman. Observe locally, infer globally: a space-time mrf for detecting abnormal activities with incremental updates. In Proc. CVPR, 2009. [13] T. Kurita, T. Kato, I. Fukuda, and A. Sakakura. Sense retrieval on a image database of full color paintings. Information Processing Society of Japan, Vol. 33, pp. 1373–1383, 1992. [14] H. Lee, A. Battle, R. Raina, and A.Y. Ng. Efficient sparse coding algorithms. 2006. [15] D.G. Lowe. Distinctive image features from scale-invariant keypoints. IJCV, Vol. 60, pp. 91–110, 2004. [16] R. Matsumoto, H. Nakayama, T. Harada, and Y. Kuniyoshi. Journalist robot: Robot system making news articles from real world. In Proc. IROS, 2007. [17] R. Mehran, A. Oyama, and M. Shah. Abnormal crowd behavior detection using social force model. In Proc. CVPR, 2009. [18] A. Oliva and A. Torralba. Modeling the shape of the scene: A holistic representation of the spatial envelope. IJCV, Vol. 42, pp. 145–175, 2001. [19] C. Piciarelli, C. Micheloni, and G.L. Foresti. Trajectory-based anomalous event detection. Circuits and Systems for Video Technology, Vol. 18, pp. 1544–1554, 2008. [20] K. Primdahl, I. Katz, O. Feinstein, Y. Mok, H. Dahlkamp, D. Stavens, M. Montemerlo, and S. Thrun. Change detection from multiple camera images extended to non-stationary cameras. In Proc. FSR, 2005. [21] I. Pruteanu-Malinici and L. Carin. Infinite hidden markov models for unusual-event detection in video. Image Processing, Vol. 17, pp. 811–822, 2008. [22] I. Saleemi, K. Shafique, and M. Shah. Probabilistic modeling of scene dynamics for applications in visual surveillance. PAMI, Vol. 31, pp. 1472–1485, 2009. [23] J. Sato, T. Takahashi, I. Ide, and H. Murase. Change detection in streetscapes from gps coordinated omni-directional image sequences. In Proc. ICPR, 2006. [24] T. Suzuki, F. Bessho, T. Harada, and Y. Kuniyoshi. Visual anomaly detection under temporal and spatial non-uniformity for news finding robot. In Proc. IROS, 2011. [25] H. Vieira Neto and U. Nehmzow. Real-time automated visual inspection using mobile robots. Journal of Intelligent & Robotic Systems, Vol. 49, pp. 293–307, 2007. [26] J. Wang, J. Yang, K. Yu, F. Lv, T. Huang, and Y. Gong. Localityconstrained linear coding for image classification. In Proc. CVPR, 2010. [27] B. Zhao, L. Fei-Fei, and E.P. Xing. Online detection of unusual events in videos via dynamic sparse coding. In Proc. CVPR, 2011.