Visual Complexity and Aesthetic Perception of Web pages Eleni Michailidou, Simon Harper and Sean Bechhofer Information Management Group School of Computer Science The University of Manchester Manchester, M13 9PL, UK
[email protected] {simon.harper, sean.bechhofer}@manchester.ac.uk
ABSTRACT
1.INTRODUCTION
The visual appearance of a Web page influences the way a user will interact with the page. Web page structural elements (such as text, tables, links, and images) and their characteristics (such as colour and size) are used to determine the visual presentation and complexity level of a Web page. We theorise that by understanding a user’s visual and aesthetic perception of a Web page we can understand the cognitive effort required for interaction with that page. This paper describes an investigation into user perception of the visual complexity and aesthetic appearance of Web pages. Results show a strong and high correlation between users’ perception of visual complexity, structural elements (links, images, words and sections) and aesthetic appearance (organisation, clearness, cleanliness, interestingness and beautifulness) of a Web page. We argue that the results should be used as a further understanding for keeping the balance between aesthetic appearance of a Web page and its visual complexity. Web pages will then be designed that can still be aesthetically attractive but also usable and not overloaded with information for the users.
Web page designers focus on good visual presentation to implicitly help users navigate, understand, and interact with the content. Access to, and movement around, complex hypermedia environments, of which the Web is the most popular example, has long been considered an important and major issue in the Web design and usability field [7, 9]. With the rapid and constant advancement of technology, new ways are constantly being introduced to present information that leads to visually complex Web pages. Studies [14, 8] show that distinct layout, smart captions and interesting pictures can transform a wall of dry text into a presentation which users will approach enthusiastically. The information on most of these Web pages is visually fragmented and organized into groups [2]. In this way, when sighted users reach a Web page, they can scan the page and obtain a comprehension of it in an average of 5 seconds. By that time they have decided if the page is relevant to their task and have moved towards the part of the page that interests them. Human-computer interaction research is mostly emphasized on performance criteria, such as time to learn, error rate and time to complete a task [6] and pays less attention to aesthetics. Lately, researchers have tried to understand how visual aesthetics can affect viewer’s perception [13, 15, 28, 18] but the relationship between the aesthetic presentation of a Web page and the user’s interaction needs further exploration. Our previous work investigated the relationship between user’s perception and visual complexity of a Web page [20]. It was shown that visual complexity of Web pages depends on the presentation of the page’s elements and by the density and diversity of the elements that are presented. Diversity is defined as the variety of structural elements and density as the number of each structural element on the page. A framework was developed that defines the visual complexity level of a page (simple, medium, complex) using a set of structural elements (number of images, links, words, and forms).
Categories and Subject Descriptors H.5.2 [User Interfaces]: Evaluation/Methodology, Screen Design; H.5.4 [Hypertext/Hypermedia]: User issues; I.7.2 [Computing Methodologies]: Document Preparation, Hypertext/Hypermedia
General Terms Design, Experimentation, Human Factors.
Keywords Web Design, Visual Perception, Aesthetics, Visual Complexity, ViCRAM.
Permission to make digital or hard copies of all or part of this work for personal or classroom use is granted without fee provided that copies are not made or distributed for profit or commercial advantage and that copies bear this notice and the full citation on the first page. To copy otherwise, or republish, to post on servers or to redistribute to lists, requires prior specific permission and/or a fee. SIGDOC’08, September 22–24, 2008, Lisbon, Portugal. Copyright 2008 ACM 9781605580838/08/0009...$5.00.
In this paper, we present an evaluation that examines how users relate aesthetic appearance of a Web page with its visual complexity. The study revealed a strong relation between visual complexity, aesthetics and layout of a Web page. Results also validated our previous work which give a more robust basis for our assumptions. Conclusions are drawn about user perception and cognition in relation with the visual presentation and structure of Web pages. We assert that this information can be used by
215
designers to keep the balance between enjoyment with complexity and usability.
example, Hall and Hanna [11] investigate the effect of Web page text/background colour combination on readability, retention, aesthetics and behavioural intention. Some of their conclusions were that specific colours can lead to greater readability, intention to purchase and higher ratings of aesthetic quality and that ratings of aesthetic quality were significantly related to intention to purchase. The effects of font type and size was also examined with respect to reading time [3, 4, 5]. These studies, however, examine only one page element. Web page design is a combination of a large set of variables such as images, text, tables, links and vary in types such as colour, size, and position. Our study attempts to incorporate more than one Web page element and examines their relation with complexity and aesthetic perception.
The rest of the paper is organised as follows: Section 2 Related Work introduces the background and related work with this evaluation. We then describe our experiment methodology, materials, hypotheses, and procedure in Section 3 Evaluation. Data, stimuli screenshots, and images collected during the experiment can be found in [21]. Results surrounding users’ perception of Web page visual presentation are described in Section 4 Results and discussed with some future directions in Section 5 Discussion. Finally, a summary of this paper is provided in Section 6 Conclusions.
2.RELATED WORK
Several studies have recently been conducted regarding ocular behaviour on Web pages and how it relates with its visual elements. Eye movements are driven by properties of the visual world and processes in a person’s mind [24] and since they can now be tracked they are used as a powerful input device for many practical applications in humancomputer interaction. Investigating sighted users’ Web behaviour using eye movement tracking methods gives a better perception of page presentation and cognition. Users’ glancing habits can give important information on where users look first when they reach a Web page, where they pay more attention and for how long they concentrate on specific parts of the page.
Web page designers focus on good visual presentation to implicitly help users navigate, understand, and interact with the content. With the rapid and constant advancement of technology, new ways are constantly being introduced to present information that leads to visually complex Web pages. Studies [14, 8] show that distinct layout, smart captions and interesting pictures can transform a wall of dry text into a presentation which users will approach enthusiastically. The increased complexity of a Web page is described through Website accessibility and usability frameworks. However, we attempt to relate the visual complexity of a Web page with the users’ perception of a page’s aesthetic appearance.
Jay et al. [16] wanted to examine how the presentation of Web pages on standard displays makes the pages easier for sighted people to use. They investigated how sighted readers used the presentation of the BBC News Web page to search for a link by comparing the standard presentation with the BBC’s text-only version. They concluded that presentation of information assisted task completion and users spent more time to complete a task in a text-only version of a Web page. In addition, Yesilada et al. [26] presented an eye tracking study that showed a strong relationship between Web page areas that receive visual attention and objects previously identified that hinder visually impaired users as they accomplish the same tasks as sighted users [27]. These objects are page elements that help users orientate and navigate, such as headers, menus, search boxes and logos [27, 26].
2.1.Visual Aesthetics and Design The use of visual aesthetics can alter the perceptions of the viewer by manipulating visual components such as the colours, text style and size, images and animations [28, 13]. In this way the user is unknowingly or unconsciously involved with the message of the Website [17, 13]. Lindgaard et al. [19] demonstrate that the visual appeal of a Web page can be assessed within 50 milliseconds in which time users make their impression about the site. Robins and Holmes [25] demonstrated a link between page aesthetics and a user’s judgment about the site’s credibility formed within the first few seconds a user looks on a page. As the authors explain, a page with a high aesthetic treatment was judged as having higher credibility.
2.2.Visual Complexity
In the visual aesthetics survey of Hoffman and Krauss [13], the authors point to studies that try to determine Web user’s perceptions of the aesthetic qualities of Websites. These studies showed that visual clarity and visual richness are two of the most important aesthetic dimensions that strongly influence the clients of a Website [13]. Visual clarity refers to “classical” [18] aesthetic qualities pointing to clean, clear, and symmetric designs, and visual richness, to “expressive” [18] aesthetics such as creativity, originality of the Websites’s aspects and the ability to break design conventions.
Complexity can be defined as “the degree of difficulty in providing a verbal description of an image” [12, 23]. Textures with repetitive and uniformly oriented patterns are less complex than disorganized ones. A visual pattern is also described as complex if its parts are difficult to identify and separate from each other [23]. Complexity perception of an image depends on the amount of grouping a user unconsciously performs, familiarity with the scene and existing knowledge of objects inside the scene. Visual complexity is mainly represented by the perceptual dimensions of quantity of objects, clutter, openness, symmetry, organization, and variety of colours [24, 23].
Design elements and techniques constantly change in order to create more attractive sites. Studies such as [15] try to identify the design characteristics of the most effective sites and how these characteristics change over time. The use of graphics for organization and decoration such as bullets, form buttons and icons has doubled within three years [15] enhancing the visual appearance of the page but also increasing the cognitive load.
Website visual perception is affected by cognition, content and form [10]. Human cognition affects how a user retrieves and uses information in a Website. Content on the Website and the amount of information that is available affects complexity since it can cause information overload on a page. The form of the Website with respect to user interface, navigation, and structure is a further factor that affects page complexity.
Further studies are conducted that examine how the appearance of various structural elements can affect user’s Web behaviour. For
216
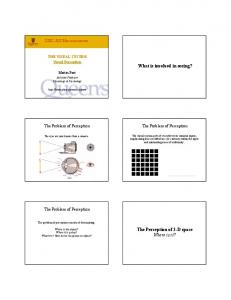
(a) Screenshot of the Amazon UK Web page as used in evaluation
(b) Chunk Rendering of the Amazon UK Screenshot
Figure 1: An example of identifying a page’s number of TLC by generating its chunk rendering participant looked at an image for 7 seconds16 which then automatically changed to the ranking questions page. The participants had to give a ranking score for the stimuli they had just looked at with respect to its visual complexity and a set of five aesthetic characteristics. They also had to state whether they were familiar with the page. After looking at the randomized sequence of the 30 images, the participants had to look at the counterbalanced sequence of what they just saw and rank the images again. The third part of the evaluation was a set of feedback questions which asked participants about visual complexity.
The above studies are the closest in identifying the visual complexity of a Web page. An empirical study [20] using the above characteristics and results focused on Web page design and the structure that determines visually simple and complex designs. Developing a framework with the help of the Web page’s elements such as paragraphs, tables, lists, and menus, helped to identify the main structural factors that cause visual complexity. The author suggested that visual complexity of Web pages depends on the presentation of the page’s elements and by the density and diversity of the elements that are presented. Diversity is defined as the variety of structural elements and density as the number of each structural element on the page.
The aesthetic terms used in this evaluation were selected from a set of assessed terms examined in [18]. In a series of studies using exploratory and confirmatory factor analyses, the authors in [18] found that users’ perceptions consist of two main dimensions, which they termed “classical aesthetics” and “expressive aesthetics”. We selected five terms (and their antonyms) that were used in [18] and can describe the aesthetic dimensions of the page page: (1) Cluttered - Clean, (2) Boring Interesting, (3) Disorganised - Organised, (4) Confusing - Clear and (5) Ugly - Beautiful.
3.EVALUATION For this experiment, we assert that the visual complexity of a Web page is related to the elements presented to the user through the structure of the document, by the quantity of each element that is used on the page and by the perception of its aesthetic properties. During this evaluation we ask participants to rank thirty Web pages based on their visual complexity and aesthetic appearance and then relate their rankings with the structural elements used to design each page. A more detailed report for this evaluation, raw data collected and stimuli used can be found at [21].
3.3.Materials The pages participants viewed were selected to be representative of sectors such as public information, business, academic, entertainment, leisure, Web services including search engines, and personal home pages [1]. Pages were similar to a subset of the twenty pages used during our previous empirical study [20] and were also part of the Alexa UK top 100 Websites17. We tried to choose pages that ranged from visually simple to complex based on our previous conclusions [20]. In order to prevent pages from changing and avoid any bias in the data, screenshots were taken of all the pages on the same day (in close time), from the same monitor and all had the same size of 1260 x 885 pixels.
3.1.Participants The study was available online so participants could access it in their own time and place. It was advertised through mailing lists and newsgroups. Fifty-five participants from around the world (such as UK, USA, Africa, China, Greece and Canada) volunteered to take part in this evaluation. Thirty-six were male and nineteen were female. Twenty participants were aged up to 25, eight between 46 and 65 and the rest between 26 and 45. The participants stated that they use the internet daily, most of them more than 20 hours weekly, and were familiar with all types of browsing (business/chatting/purchasing).
3.2.Procedure The experiment consisted of three parts. The first part included demographic questions such as age, sex and browsing familiarity. The main study was conducted in the second part, in which after a short introduction about the procedure of the experiment, the
217
16
Reasoning for the time stimuli were shown can be found in [21]
17
Alexa UK Top 100: November 2007
(a) The visually simplest Web page Orkut
(b) The most visually complex Web page AutoTrader UK
Figure 2: The scale of difference on user’s rankings: a comparison of the visually simplest and most complex stimuli white space, sections that are adjacent and share a side or sections that are subsections. The number of corners a page has depends on the amount of different sections that a page is divided into boxes (a box is an area enclosed by four lines). A TLC is a block’s top left corner (block is a box that is surrounded by white space only). If a box’s left and top sides are not adjacent or have a common side with another box, then its TLC is also counted. The arrow in Figure 1b shows a block with two TLCs because the top box has a top left corner’s side not common with another box. The small rectangles indicate the TLCs of Figure 1a.
3.4.Variable Identification In order to understand how the structural elements of a Web page can determine the level of visual complexity, each of the stimuli used for the evaluation was analyzed and the following variables were identified: menus, images, words, corners and links. These variables are defined as follows: Menus - A series of horizontal or vertical list of links that are grouped together in an obvious way. That is, the list of links might be divided by a line, grouped in a box, or as a section surrounded by white background. Menus are usually horizontal on the top and bottom of the page, or vertical on the left hand side of the page.
3.5.Hypotheses
Images - Any images on the page, including advertisements, animations, logos and decorative images.
To support our aim, the evaluation was based on the following hypotheses:
Words - Text used to present any type of information on the page. For the analysis all words used to render the screenshot of the page were counted, including text from menu lists and within images.
H1 The number of menus, images, visible links, words and TLCs a Web page has, is positively related with the page’s level of visual complexity. H2 User perception of Web page aesthetic characteristics with respect to organization, clearness, cleanliness, interestingness and beautifulness, is linearly related with the number of menus, images, visible links, words and TLCs a Web page has.
Links - The number of links on each page was counted based on the visibility of the link. This included links that are underlined, distinguished with colours (such as blue when there is a lot of text or pale color when the page is simple), within a list as a menu or surrounded by different colours (most commonly white).
H3 User perception of Web page visual complexity is related with the aesthetic qualities it presents. That is, the more organised, clear, clean, interesting and beautiful a Web page is the less visually complex is perceived as by the user.
Top Left Corner (TLC) - A page is separated in various sections and subjects. This visual distinction is made with the use of colours, tables, lines and spacing. In order to identify the number of different sections a page is organised into, we create a page chunk rendering (for more details see [22]) which is the representation of the overall Web page layout without any visual elements. For our procedure and experiment, the set of variables that are used to identify the chunk rendering of the page are the background colours, headings and subsections, standalone images, and visible lines or borders. When the chunk rendering of a page is created and the overall layout of the page is revealed, organizational elements need to be identified for the evaluation. Figure 1b shows the chunk rendering generated on Figure 1a, which is one of the stimuli used in the evaluation. A variety of different sections are shown: sections that are only surrounded by
4.RESULTS The data collected were analysed based on our hypotheses. That is, we examined the relationship between a page’s set of structural elements and the scores that participants give with respect to the visual complexity, cleanliness, interestingness, organisation, clarity and beautifulness. In addition, we evaluated the relationship of the visual complexity level of the page with the aesthetic characteristics. Models were revealed based on the data collected that predict the visual complexity of a page and its aesthetic appearance based on the structural elements of a Web page and user’s familiarity with the page.
218
Table 1: Correlation between Independent Variables (structural elements), Visual Complexity and Aesthetic Scores Variables
Complexity
Clean
Interesting
Organised
Clear
Beautiful
Menus
0.341
0.302
0.265
0.016
0.095
0.048
Images
0.510a
0.423b
0.294
0.249
0.318
0.047
Words
0.576c
0.585a
0.020
0.384b
0.451b
0.275
TLC
0.774c
0.704a
0.277
0.345
0.462c
0.200
Links
0.417b
0.342
0.519c
0.004
0.095
0.174
Familiarity
0.116
0.005
0.733a
0.382b
0.285
0.487c
a. p < .01; b. p < .05; c. p < .001 However, only the effect of the number of TLC, words and images were significant, leaving menus and links variables not included in the model. The first equation in Table 3 is the prediction model revealed based on the regression coefficients that the analysis produced that can estimate the visual complexity score of a Web page. For the independent variables that were determined as not significant for the regression model (the number of menus and links) a correlation analysis was conducted between the variables and the complexity score. Visual complexity was found to have a positive and high significance correlation (r > 0.4 at p < 0.05) with all the variables except the number of menus. The second column of Table 1 lists the correlations of all independent variables with the visual complexity score. We notice that the TLC has the highest correlation with the visual complexity of a page. This is an indication on how the number of different sections a page is grouped into and the overall page layout affect user perception.
Figure 3: Visual Complexity Web Page Ranking Order By looking at the most visually complex and simplest page that the data analysis revealed, one can easily notice their main differences. The image shown in Figure 2a was ranked as the visually simplest, where the image shown in Figure 2b as the most visually complex. One can easily notice the difference they have in information density, type of page, colours and images, something that reflects not only participants’ feedback comments but also the data collected. The visually simplest page was also ranked as the most clean one which gives an initial result on the relationship between cleanliness of a page and complexity. In addition, the most organised, clear and beautiful pages were also among the first three visually simplest pages. The higher ranking on interestingness received one of the most visually complex page.
4.2.Aesthetics For each of the stimuli participants had to give a rank based on the aesthetic characteristics of the page as perceived by them. Participants’ rankings started from the left hand side as 1 and the maximum was 10. For example, a very cluttered page was given a 1 and a very clean page a 10. For the data analysis, the right hand side terms were used, that is: clean, interesting, organised, clear and beautiful. Using the structural and familiarity variables a series of analyses using stepwise regression was conducted. It is important to note here that the familiarity with a page was the only variable that was included in all the estimation models for the aesthetic characteristics scores, something that did not happen with the visual complexity score model. Significant regression models were identified for the following characteristics: clean using TLC, words, familiarity and images; interesting using familiarity, links and words; organised using familiarity, words and images; clear using TLC, familiarity, words and images; and beautiful using familiarity and TLC.
4.1.Visual Complexity Participants ranked the images based on their visual complexity by giving a number from 1 to 10, with 1 being the visually simplest and 10 the most complex. Figure 3 shows the Web pages in ascending order of the visual complexity score that were ranked along with the complexity level preassigned using the framework defined in [20]. As the graph shows, pages preassinged as visually simple received lower rankings than the visually complex pages. This can be used as an initial validation of our framework and therefore our assumptions.
Including familiarity in these prediction models resulted in subjective and less effective models because they require the user’s input. Therefore, the stepwise regression tests were repeated with out the familiarity variable for every characteristic. This gave a better idea of how the aesthetic characteristics of a
In order to examine how the structural elements defined in Section 3.4 affect user’s perception of visual complexity, a series of regression analysis was performed. In a previous pilot investigation [22] it was shown that the number of TLCs a page has is significantly and positive related with the visual complexity level of the page. Therefore, the TLC variable was used as the first variable in a stepwise regression analysis. A significant model emerged with a strong fit of R2=0.7.
219
Table 2: Correlation between Aesthetic Characteristics and Visual Complexity Scores Complexity Clean Interesting Organised Clear Beautiful Familiarity
Complexity 1 0.974c 0.036 0.775c 0.849c 0.463a 0.116
Clean Interesting Organised 0.974c 0.775c 0.036 0.861c 1 0.214 0.594c 0.214 1 0.861c 0.594c 1 0.923c 0.507a 0.986c 0.616c 0.801c 0.768c 0.382b 0.005 0.733c a. p < .01; b. p < .05; c. p < .001
Clear 0.849c 0.923c 0.507c 0.986c 1 0.743c 0.285
Beautiful 0.463a 0.616c 0.801c 0.768c 0.743c 1 0.487a
Familiarity 0.116 0.005 0.733c 0.382b 0.285 0.487a 1
Table 3: Prediction Models for Visual Complexity and Aesthetic Characteristics ID 1 2 3 4 5 6
Equation VisualComplexity = 1.743 + 0.097 (TLC) + 0.053 (Words) + 0.003 (Images) Clean = 8.342 0.094 (TLC) 0.004 (Words) + 1.069 (Familiarity) 0.060 (Images) = 8.307 0.115 (TLC) 0.003 (Words) Interesting = 4.955 + 1.560 (Familiarity) = 5.342 + 0.026 (Links) 0.003 (Words) Organisation = 7.459 0.004 (Words) + 1.354 (Familiarity) 0.064 (Images) = 7.297 0.003 (Words) Clear = 7.365 0.005 (Words) + 1.417 (Familiarity) 0.082 (Images) = 7.172 0.082 (TLC) Beautiful = 5.358 + 1.267 (Familiarity) 0.064 (TLC) TLC, Words and Images are unit variables; Familiarity is a binary variable
page can be predicted by its structural elements only. For all the aesthetics characteristics, except beautifulness, results revealed two models (with and without the familiarity variable). The better models with the stronger fit (based on R2) are the models which include the familiarity variable. This could mean that the perception of beautifulness is mainly dependent on the user’s familiarity with the Web page rather than its appearance and structural layout. Equations 2-6 in Table 3 are produced using the regression coefficients that the analysis produced for every model.
R2 0.7 0.72 0.57 0.54 0.37 0.57 0.15 0.61 0.21 0.4
relationship with the complexity level of the page. Table 2 shows the correlation coefficients for all the terms between the visual complexity score and between each other. Between all of the characteristics, clearness has the higher relation with visual complexity, r = 0.85 at p < 0.001. Interestingness was not related with the visual complexity which might be caused by participants’ familiarity with the page, which is the reason of including a familiarity question. Indeed, the last column of Table 2 shows that participants’ familiarity with the page was highly and significantly related with their interestingness rankings.
In order to investigate the relationship between the variables that could not fit in any of the aesthetic models, a correlation analysis was performed between the aesthetic terms and the structural elements of the stimuli. Table 1 lists all independent variables (structural elements) and their respective correlation coefficient between them and the aesthetic characteristics. Comparing the significant correlations with the models listed in Table 3 we notice that the structural elements that are highly and significantly related with each aesthetic characteristic are also the ones included in the regression models. However, it is important to note that cleanliness is the one that is significantly correlated with the most of the structural elements used in the experiment. Also, beautifulness was not significantly related with any of the structural elements.
4.3.Feedback Comments The last part of the evaluation was introduced to directly ask participants’ opinion of what a visually simple and complex page is. First, the participants were asked whether they agree or disagree with the statements shown in Figure 4. As Figure 4 shows, most of the participants agreed that they “can easily find information on a visually complex page” but they strongly agreed that they “can easily find information on a visually simple Web page”. The majority of them also agreed with the statement that they tend to “spend more time interacting with a visually complex page than a simpler one”, but further studies need to be performed to explain the reason for this. We assume that this happens due to the amount of information a visually complex page has, which is also shown from their agreement on the fact that a visually complex page has a lot of information to choose from. It is important to note that most of the participants disagreed with the statement that “a visually simple page is boring”. However, the analysis showed that familiarity with a page is the most related factor in rating a page as interesting. Also, most participants were neutral on the statement that “a visually complex page is disorganized”. The previous analysis showed that complexity of
Correlation analysis was also conducted between visual complexity and the aesthetic characteristics. A negative and of high significance relation (r > 0.5 at p < 0.01) between the visual complexity score of the page and the following aesthetic characteristics was determined: clean, organised, clear and beautiful. That means that the less visually complex the page was ranked as, the more clean, organised, clear and beautiful it was perceived by the participants. Interestingness did not reveal any
220
Figure 3: Participants Agreement on Feedback Statements modeling how the visual design, and especially the combination of visual elements, of a Web page can influence a user’s first impression. Further investigation needs to be done to examine a larger set of structural elements and how their visual appearance, position and density affects user perception, usability and accessibility.
the page was significantly and negatively related with the organization of a page. Participants were also asked to define in their own words a visually simple and complex page. In summary, participants described a visually simple page as one with pale colours, clean, can easily find what they are looking for, covers a small screen area and has limited set of images and links. A visually simple page was also described as organised, with a limited number of different subjects and whose purpose can easily be understood. On the other hand, participants described a visually complex page as one with a lot of information and categories, not uniform in size and shape, has a large number of images, colours, buttons and animations and generates an overall distraction.
The second hypothesis, H2, states that user’s perception of a Web page’s aesthetic characteristics is related with the number of menus, images, visible links, words and TLCs on a Web page. The evaluation supported our hypothesis for all the structural elements except for the number of menus. The results showed that structural aesthetics (clean, clear and organised) are highly related with the number of images, words and different sections (TLC) a page has. This reflects how the density and position of various elements on a page can influence user’s perception of the page design. It was also shown that user’s familiarity with a page has the highest effect on perceiving a page as interesting and beautiful. These conclusions can help designers evaluate a page with respect to its perceived aesthetics which can give a sense of credibility or enhance usability.
5.DISCUSSION The quantitative and qualitative analysis of this evaluation produced a set of conclusions and initial prediction models that can help expand our research and understand better the relationship between structural elements and users’ perception of a Web page. The results of this evaluation provide robust information on how users perceive visual appearance of a Web page and how designers can check whether their page will be perceived as complex, interesting, clean, organised, beautiful or clear by their clients. Our hypotheses statements are supported from the results with some limitations on the structural elements of the page.
H3 states that user perception of a Web page’s visual complexity is related with the aesthetic qualities it presents. The experiment revealed that only interestingness was not related with the complexity level. That is, data analysis showed that the more organised, clear, clean and beautiful a page is, the visually simpler the page was perceived by the participants.
First, H1 stated that the number of menus, images, visible links and words a Web page has and sections it is grouped into (TLC), is positively related with the page’s level of visual complexity. Only the first part of this statement was not supported by the data. That is, the experiment revealed a positive, significant and robust relationship between visual complexity of the page and its number of images, visible links, words and TLCs but not with the number of menus. In addition to their strong correlation, prediction models were identified using the number of images, words and TLCs as the variables in the equations.
The results of this study demonstrate that it is possible to model user perception based on Web page structural layout. This study should act as the basis for an extended investigation into the relationship of user perception on visual complexity and aesthetics with all possible structural elements and their attributes (such as colour and size). As the data supported, the overall structural layout of a page is the most important factor in predicting user impressions. That is, the TLC variable is mainly influenced on the overall structure of the page, the number of different sections and how they are organised.
This conclusion supports our initial investigation into visual complexity of a Web page [20] and provides the basis for understanding how the visual appearance of a Web page can affect user’s perception. The results can act as an initial step into
Previous research is performed on how the aesthetic perception of a page influence user impression on credibility [25] and therefore interaction. We assert that future work should include an
221
[9] R. Furuta, I. Frank M. Shipman, C. C. Marshall, D. Brenner, and H. wei Hsieh. Hypertext paths and the worldwide web: experiences with walden’s paths. In Hypertext ’97, 1997. [10] M. Germonprez and I. Zigurs. Causal factors for web site complexity. Working Papers on Information Environments, Systems and Organizations, 2003. [11] H. R. H. and H. Patrick. The impact of web page textbackground colour combinations on readability, retention, Aesthetics and behavioural intention. Behaviour & Information Technology, 23(3):183–195, 2004. [12] C. Heaps and C. H. Handel. Similarity and features of natural textures. Journal of Experimental Psychology: Human Perception and Performance, 25, 1999.
examination into how user aesthetic perception affects task completion and browsing behaviour on Web pages. This can be achieved by investigating user eye movement on Web pages and how their viewing behaviour changes based on the aesthetic appearance of the page.
6.CONCLUSIONS In this paper, we have presented an online ranking evaluation that investigates how users perceive visual complexity and aesthetic appearance of Web pages. Limited previous research and work showed the importance of examining visual aesthetics on Web pages and how they manipulate user perception of page credibility. Our previous work introduced a framework that identifies visually simple and complex pages based on a set of structural elements [20]. This study, extended our previous work by examining the relation between visual complexity, aesthetic characteristics and structural layout of the page. Models were derived that can predict the visual complexity level of the page, organisation, clearness, cleanliness, beautifulness and interestingess of the page.
[13] R. Hoffmann and K. Krauss. A critical evaluation of literature on visual aesthetics for the web. In SAICSIT ’04. [14] S. Hoffos and G. Sharpless. The CDI designers guide. McGrawHill, 1991. [15] M. Y. Ivory and R. Megraw. Evolution of web site design patterns. ACM Trans. Inf. Syst., 23(4):463–497, 2005. [16] C. Jay, R. Stevens, M. Glencross, and A. Chalmers. How people use presentation to search for a link: expanding the understanding of accessibility on the web. In W4A ’06.
The results show that visual complexity of a page is negatively related with user perception of how organised, clear, clean and beautiful a page looks. The number of links, images, words and sections (TLC) were used to derive models that predict how a user will perceive a page’s aesthetic and complexity appearance. We suggest that results should be used by designers to keep the balance between aesthetic appearance of a Web page and its visual complexity. When this balance is achieved Web pages can still be aesthetically attractive but also usable and not overloaded with information for the users.
[17] K. Krauss. Visual aesthetics and its effect on communication intent: a theoretical study and website evaluation. In Proceedings of the Southern African Computer Lecturers Association (SACLA), 2004. [18] T. Lavie and N. Tractinsky. Assessing dimensions of perceived visual aesthetics of web sites. Int. J. Hum.Comput. Stud., 60(3):269–298, 2004. [19] G. Lindgaard, G. Fernandes, C. Dudek, and J. Browntilde. Attention web designers: You have 50 milliseconds to make a good first impression! Behaviour & Information Technology, 25:115–126, 2006. [20] E. Michailidou. Metrics of visual complexity. Master’s Thesis, Computer Science, 2005. [21] E. Michailidou. Determining users’ perception of web page visual complexity and aesthetic characteristics. Technical report, May 2008. http://hcw-eprints.cs.manchester.ac.uk/44/. [22] E. Michailidou. Investigating users’ visual perception based on web page chunks. Technical report, April 2008. http://hcweprints.cs.manchester.ac.uk/43/. [23] A. Oliva, M. L. Mack, M. Shrestha, and A. Peeper. Identifying the perceptual dimensions of visual complexity of scenes. In Proceedings of the 26th Annual Meeting of the Cognitive Science Society, 2004. [24] K. Rayner. Eye movements in reading and information processing: 20 years of research. 124(3):372–422, 1998. [25] D. Robins and J. Holmes. Aesthetics and credibility in web site design. Information Processing and Management, 44(1):386–399, 2008. [26] Y. Yesilada, C. Jay, R. Stevens, and S. Harper. Validating the use and role of visual elements of web pages in navigation with an eyetracking study. In WWW ’08, Beijing, China, 2008. [27] Y. Yesilada, R. Stevens, S. Harper, and C. Goble. Evaluating DANTE: Semantic transcoding for visually disabled users.
7.ACKNOWLEDGMENTS We would like to thank all participants who volunteered to take part in this study. This evaluation is part of the ViCRAM project funded by the School of Computer Science at the University of Manchester.
8.REFERENCES [1] E. Amitay, D. Carmel, A. Darlow, R. Lempel, and A. Soffer. The connectivity sonar: detecting site functionality by structural patterns. In Hypertext ’03. [2] C. Asakawa and H. Takagi. Annotationbased transcoding for nonvisual web access. In Assets ’00. [3] M. Bernard, C. H. Liao, and M. Mills. The effects of font type and size on the legibility and reading time of online text by older adults. In CHI ’01. [4] M. Bernard, B. Lida, S. Riley, T. Hackler, and K. Janzen. A comparison of popular online fonts: Which size and type is best? Usability News, January 2002. [5] D. Boyarski, C. Neuwirth, J. Forlizzi, and S. H. Regli. A study of fonts designed for screen display. In CHI ’98. [6] K. A. Butler. Usability engineering turns 10. Interactions, 3(1):58–75, 1996. [7] C. Chen. Structuring and visualising the www by generalised similarity analysis. In Hypertext ’97, 1997. [8] P. Faraday and A. Sutcliffe. Making contact points between text and images. In Multimedia ’98, pages 29–37, 1998.
222
The special issue of TOCHI on Web Accessibility, 2007. [28] H. Zettl. Sight, Sound, Motion: Applied Media Aesthetics. Wadsworth Publishing Company, 1999
223
224