Schizophrenia Bulletin vol. 37 no. 4 pp. 716–726, 2011 doi:10.1093/schbul/sbr055
Visual Context Processing Deficits in Schizophrenia: Effects of Deafness and Disorganization
Heather K. Horton*,1 and Steven M. Silverstein2 1
School of Social Welfare, University at Albany, Albany, NY 12203; 2University Behavioral HealthCare and Robert Wood Johnson Medical School, University of Medicine and Dentistry of New Jersey, Piscataway, NJ 08854 *To whom correspondence should be addressed; University at Albany, School of Social Welfare, Richardson Hall 280, 135 Western Avenue, Albany, NY 12203; tel: +1-518-442-5331, fax: 518-442-5380; e-mail:
[email protected]
Key words: schizophrenia/cognition/deafness/ disorganization/context processing/perceptual organization Introduction Schizophrenia has been consistently characterized by impairments in perceptual organization or the integration of separate elements into coherent wholes and object representations.1 Perceptual organization in vision involves
! The Author 2011. Published by Oxford University Press on behalf of the Maryland Psychiatric Research Center. All rights reserved. For permissions, please email:
[email protected].
716
Downloaded from schizophreniabulletin.oxfordjournals.org by guest on July 27, 2011
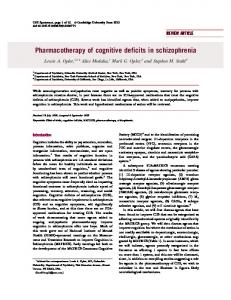
the binding of image elements into a context-appropriate whole, where the context can be seen as the other elements that combine to make up a line, curve, or object.2,3 As such, context affects the processing of signals without changing what they transmit information about.4 The formation of propositional visual representations (ie, those that represent the spatial relationships between object components) is necessary to process visual images, and theories posit that these are structurally similar to the propositional representations underlying thought and language.5–8 Consistent evidence that reduced perceptual organization in schizophrenia is related to increases in disorganized thinking (for review, see9) suggests that the perceptual deficit is a low-level manifestation of a more widespread disturbance in context-based cognitive processing.10 The strongest evidence for perceptual organization impairment in schizophrenia comes from studies where the normal tendency to integrate contextually related elements interferes with processing individual features. In such cases, schizophrenia patients have been shown to outperform controls (ie, to show reduced effects of visual context and superior processing of features),11 similar to studies of language processing.12,13 One method that is well-suited for such demonstrations is tasks based on the Ebbinghaus illusion (see figure 1), where the perceived size of a circle is normally affected by the size of surrounding circles. Schizophrenia patients have demonstrated reduced illusion effects (ie, more accurate size judgments of the center circles) compared with psychiatric controls in 3 past studies.14–16 Of note, this effect was strongest among schizophrenia patients with prominent disorganized symptoms (similar to findings from studies using other perceptual organization tasks—see review by Silverstein and Keane11 in this issue), supporting the idea that disorganization in thought/language, affect, and motor activity are more global instances of the integration failure also seen in early visual perception.
Visual illusions allow for strong tests of perceptual functioning.Perceptualimpairmentscanproducesuperiortaskperformance on certain tasks (ie, more veridical perception), thereby avoiding generalized deficit confounds while tapping mechanisms that are largely outside of conscious control. Using a task based on the Ebbinghaus illusion, a perceptual phenomenon where the perceived size of a central target object is affected by the size of surrounding inducers, we tested hypotheses related to visual integration in deaf (n 5 31) and hearing (n 5 34) patients with schizophrenia. In past studies, psychiatrically healthy samples displayed increased visual integration relative to schizophrenia samples and thus were less able to correctly judge target sizes. Deafness, and especially the use of sign language, leads to heightened sensitivity to peripheral visual cues and increased sensitivity to visual context. Therefore, relative to hearing subjects, deaf subjects were expected to display increased context sensitivity (ie, a more normal illusion effect as evidenced by a decreased ability to correctly judge central target sizes). Confirming the hypothesis, deaf signers were significantly more sensitive to the illusion than nonsigning hearing patients. Moreover, an earlier age of sign language acquisition, higher levels of linguistic ability, and shorter illness duration were significantly related to increased context sensitivity. As predicted, disorganization was associated with reduced context sensitivity for all subjects. The primary implications of these data are that perceptual organization impairment in schizophrenia is plastic and that it is related to a broader failure in coordinating cognitive activity.
Context Processing, Deafness, and Schizophrenia
The aims of this investigation were to (1) attempt to replicate past findings using a psychophysically more rigorous version of the Ebbinghaus illusion task and (2) characterize the nature of the effect (if any) in deaf patients with schizophrenia, which had not been done before, thereby addressing the issue of plasticity of the perceptual organization deficit in schizophrenia. Regarding the latter, there is now strong evidence that the Ebbinghaus illusion is not present in young children but that it develops over time with increased experience in judging perspective (eg, estimating distance based on spatial context cues and doing this with 2-D pictures).17,18 Deaf people, owing to their use of sign language, have an increased reliance on, and experience with, visual integration (especially those who are exposed to sign language from birth). Therefore, findings of a greater illusion effect in deaf compared with hearing schizophrenia patients would suggest that the disorganization process in schizophrenia, at least in perception, is plastic and may be able to be reduced via prolonged life experience. To our knowledge, this has not been investigated previously. Below, relevant literature bearing on the hypothesis that deafness is associated with superiorities in visual processing that might override impairments associated with schizophrenia will be briefly reviewed. Deafness and Visual Cognition For the deaf, there is evidence that the auditory cortex reorganizes in the absence of auditory inputs to mediate
717
Downloaded from schizophreniabulletin.oxfordjournals.org by guest on July 27, 2011
Fig. 1. Two examples of the stimulus displays used. In both, the center circle on the right is 2% larger than that on the left. (1A) The larger circle is in small surrounds, making the difference easy to see (control condition, 16 items). (1B) The larger center circle is in even larger surrounds, making the difference hard to see (test condition, 80 items); in this case, the center circle on the left is perceived as larger than that on the right.
other functions including vision.19–21 Deaf-hearing differences are most prominent when tasks require subjects to direct their attention peripherally. For example, hearing signers are more distracted by central than by peripheral distracters and thus perform like hearing nonsigners and unlike deaf individuals.19,22 Enhanced peripheral processing reported in deaf individuals, and not observed in hearing signers, suggests that deafness is a major driving force of that change. It is hypothesized that aspects of vision normally benefitting from auditory-visual convergence during early cortical development are reorganized from higher association cortices to early sensory cortices23 resulting in, among other things, enhanced peripheral processing. Rather than deafness per se, there is also evidence that a reliance on American Sign Language (ASL) causes changes in visual cognition in part because ASL uses space itself to encode linguistic information. For example, spatial scenes are most often described from the perspective of the person signing, and thus, the viewer must perform a 180" mental rotation to correctly comprehend the description (interestingly, signers comprehend spatial relationships better when mental rotation is required).24 Tasks requiring spatial localization of information (to the periphery as well as to local grammatical features displayed on the face) induce significant differences between signing and nonsigning individuals.25,26 Compared with late sign language learners and nonsigners, it is typical for children and adolescents who are native signers (eg, children of deaf parents) to be the most skilled; early sign language acquisition (SLA), whether one is deaf or hearing, is reflected in above average abilities in face recognition, block design, movement detection, mental rotation, and spatial memory tasks.27–29 Relative to healthy subjects, studies regarding visual cognition among deaf adults with serious mental illness are infrequent. One study compared healthy hearing subjects with deaf people with schizophrenia and reported equivalent performance on a measure of facial feature processing.30 This finding stands in marked contrast to the typically large differences on cognitive tasks found between hearing people with schizophrenia and matched hearing controls.31–33 Importantly, it appears as if the visual processing superiorities associated with deafness can be due to either cortical reorganization and/or a lifetime of experience with sign language. There is evidence that similar as well as differing aspects of visual cognition are associated with each influence (for a review, see34). Based on these considerations, in this study, deaf subjects were expected to be more visual context sensitive (ie, more vulnerable to the Ebbinghaus illusion) than hearing subjects, even though all subjects were diagnosed with schizophrenia, and we expected this finding to be strongest among early sign language learners. However, in both groups, we expected that ‘‘disorganized’’ subjects would demonstrate the weakest illusion
H. K. Horton & S. M. Silverstein
effects (reduced context sensitivity), given past associations between increased clinical disorganization and reduced visual context sensitivity.9,35–38
Methods Subjects
718
Brief Psychiatric Rating Scale. The Brief Psychiatric Rating Scale (BPRS)41 was administered to all subjects and a confirmatory factor analysis (CFA) established the symptom structure used to characterize the sample.42 The 5 factors extracted were labeled disorganization, anergia, thought disorder, affect and activity. Symptom factors were not mutually exclusive. Most participants (52%) presented with high scores on 2 or more symptom clusters, and no differences were apparent between deaf and hearing subjects in terms of the number of manifest symptom clusters (table 2). Of all factors, deaf subjects scored highest on the thought disorder factor (eg, unusual thought content, grandiosity, and suspiciousness) while hearing subjects scored highest on the affect factor (eg, anxiety, suicidality, and depression). Of primary interest in the current study, because of its established relationship to context sensitivity, was the disorganization factor (eg, disorientation, bizarre behavior, conceptual disorganization, and hostility). The remaining factors, anergia (eg, blunted affect, emotional withdrawal, and motor retardation) and activity (eg, tension, excitement, and motor hyperactivity), were not analyzed further once it was determined that they were unrelated to context sensitivity. Linguistic Ability. Linguistic ability was operationalized by the Sign Communication Proficiency Interview (SCPI).43 A native (deaf) signer engaged subjects individually in face-to-face structured interviews (1–2 h). The evaluation was videotaped, and skills in the standard components of language (eg, grammar, fluency, and comprehension) were induced by the gold standard evaluator. SCPI ratings ranged from 0 to 100.00, with higher ratings indicating native-like signing ability. Adequate interrater reliability (r = .85) was determined by a second rater (hearing and native signer) who reviewed 14% (n = 5) of the interviews. Ebbinghaus Illusion Task. A 2-alternative forced-choice paradigm was employed in which subjects must compare 2 separate arrays, each 3 3 3, and decide whether the target (center) stimulus in the left- or right-hand array is larger4 (figures 1a and 1b). The targets, 2 center circles, always differed in actual size, and this difference varied randomly in magnitude across trials (2.00–18.00 pixels). The illusion is created by target circles that are surrounded by additional circles, all of which are the same size but of a different size than the center circle. When a circle is surrounded by larger circles (125 pixels diameter), it appears smaller than its actual size; in contrast, when a circle is surrounded by smaller circles (50 pixels diameter), it appears larger than its actual size. In general, accuracy in judging whether the left or right inner circle is larger increases (ie, there is less of an illusion effect) as the size difference between the targets increases, regardless of the size of the surrounds. This is similar to other phenomena in perception where,
Downloaded from schizophreniabulletin.oxfordjournals.org by guest on July 27, 2011
From among all deaf and hearing consumers at a psychiatric rehabilitation agency in the Midwest (approximately 3000 consumers), 87 people agreed to participate in the study. A diagnosis of schizophrenia or schizoaffective disorder was determined by the first author’s administration of the Structured Clinical Interview for Diagnostic and Statistical Manual of Mental Disorders, Fourth Edition Axis I Disorders—Patient Edition (SCID).39 The SCID was translated by the first author and back translated by a native (hearing) signer. The translation’s accuracy was evaluated by the congruence between the original document (in written English) and the back-translated version of the measure (ie, the ASL version translated ‘‘back’’ to English) (r = .86). Case record reviews and/or self-reports determined that all deaf subjects were prelinguistically deafened (people who became deaf prior to the acquisition of spoken language) and had severe-to-profound (70–89 dB loss) or profound (>90 dB loss) hearing losses; exact causes were unknown. Because rubella as well as other pre/postnatal insults are associated with cognitive deficits in the deaf (eg, toxoplasmosis, cytomegalovirus, herpes symplex virus, premature birth, postnatal meningitis), subjects with developmental delays or other severe cognitive deficits (eg, a history of head injury) were excluded. The final sample included 65 subjects (34 deaf and 31 hearing) with normal visual acuity in both eyes as determined by a Snellen chart. Sign language was the primary mode of communication for all deaf subjects. Among the 34 deaf subjects, 2 did not participate in the final testing session; cognitive data are missing for these subjects. Deaf and hearing groups were similar with respect to age, gender, race, diagnosis, housing status, employment status, illness duration, illness severity, and level of functional outcome40 (eg, social competence) (table 1). Aside from one hearing subject, all participants were taking atypical antipsychotic medications (doses unknown). The mean age of illness onset was 18.74 years for deaf subjects (SD = 8.32) and 21.06 years for hearing subjects (SD = 5.21). The sample represents a psychiatrically stable sample of people with schizophrenia, the majority of whom lived independently and were receiving long-term community-based mental health services. Consent and recruitment procedures were approved by the institutional review boards at the University of Chicago and the agency that hosted the research. Once the study procedures had been fully explained, written informed consent was obtained from each participant.
Measures
Context Processing, Deafness, and Schizophrenia
Table 1. Demographic and Clinical Characteristics of Subjects Hearing (n = 34)
Total (n = 65)
Characteristic
Mean (SD)
Mean (SD)
Mean (SD)
Age (y) (range 23–66) Illness duration (y) Functional outcome (range 35–82/85) BPRS illness severity
45 (9) 26 (10) 59 (14) 0.64 (0.17) n
%
47 (9) 25 (10) 61 (10) 0.65 (0.17) n
%
46 (9) 26 (10) 60 (12) 0.64 (0.16) n
%
21
0.62
22
0.71
43
0.66
18 12 4
0.53 0.35 0.12
12 15 4
0.39 0.48 0.13
30 27 8
0.46 0.42 0.12
4 11 2
0.12 0.32 0.06
14 11 4
0.45 0.35 0.13
18 22 6
0.28 0.34 0.10
15 5 0 14
0.44 0.15 0 0.41
11 10 3 7
0.35 0.32 0.10 0.23
26 15 3 21
0.40 0.23 0.05 0.32
26 8 11 19 25
0.76 0.23 0.32 0.56 0.74
24 7 17 20 27
0.77 0.23 0.55 0.65 0.87
50 15 37 39 51
0.77 0.23 0.57 0.60 0.80
Sex Male Race White African American Other Education No/some high school Any college College graduate Housing status 24 h care (residential or nursing home) Semi-independent SRO or hotel Own apartment Diagnosis Schizophrenia Schizoaffective Substance use (lifetime)* History of competitive employment Right handed
Note: BPRS, Brief Psychiatric Rating Scale; Functional outcome, Multnomah Community Ability Scale; SRO, single room occupancy. *P = .07.
when bottom-up, stimulus-driven cues are strong, topdown effects (such as those involved in contextual modulation of a target) are weaker.44 Because the illusion impairs discrimination in all size pairs, center size must be unconfounded from surround size to assure that subjects judge center circle sizes rather than simply choosing the panel with large surrounds. Therefore, 2 of the arrays (98.00 and 102.00 pixels) were presented 8 times each with the smaller center circle surrounded by large surrounds and the larger center circle surrounded by smaller surrounds (control condition, 16.00 trials); if subjects were relying on the surrounds, then ac-
curacy would be low in this condition (ie, helpful context). Because all subjects displayed high accuracy on these control items, we can be confident that responses were being driven by the apparent sizes of the center circles and not by their surrounds.4 Subjects were instructed to ‘‘ignore the surrounds and focus on the center circles only.’’ Overall level of context sensitivity was quantified as the total number of correct responses out of 80 trials for the conditions in which context impairs discrimination. Thirty-two items comprised the small target size (STS) condition—wherein the actual size difference between targets was small (2.00–6.00 pixels)—and 48 items
Table 2. Brief Psychiatric Rating Scale Mean Factor Scores (Deaf, Hearing) Deaf Sample (n = 34)
Hearing Sample (n = 31)
Factor Name
Eigenvalue
Mean Score (SD)
# Subjects > Mean
Disorganization Activity Anergia Thought disorder Affect
4.22 3.10 2.77 1.83 1.63
1.79 1.56 1.69 2.02 1.57
13 15 10 15 9
(1.27) (0.99) (1.05) (1.44) (0.86)
Mean Score (SD)
# Subjects > Mean
t Value (df = 63) Difference between # Subjects
1.60 1.09 1.79 2.12 2.17
9 2 10 12 15
0.40 4.79* 0.11 0.06 2.96*
(1.11) (0.30) (1.06) (1.68) (1.50)
Note: Factor groups are not mutually exclusive. *P < .01.
719
Downloaded from schizophreniabulletin.oxfordjournals.org by guest on July 27, 2011
Deaf (n = 34)
H. K. Horton & S. M. Silverstein
comprised a large target size (LTS) condition—wherein the actual size difference between targets was large (10.00–18.00 pixels). Poorer size discrimination indicates a higher degree of context sensitivity and is reflected by lower test scores. The size estimation task was run on a Dell INSPIRON 2650 laptop computer with a 14-inch screen. The order of administration of context and control conditions was randomized across subjects. The resolution of the monitor was 1280_1024 for all measures, with the program window taking up the entire screen. Results
720
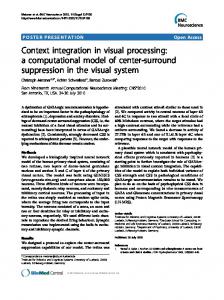
Fig. 2. Size perception accuracy by individual target size contrasts (deaf, hearing).
Hearing subjects were able to discriminate above chance (50%) levels of accuracy (ie, were no longer consistently deceived by the illusion) when the size difference was approximately 8%, while deaf subjects did not reach above chance levels of accuracy until approximately a 12% size difference between targets. Larger size contrasts (LTS condition) produced the biggest difference between hearing and deaf subjects (hearing, 0.78 [SD = 0.17]; deaf, 0.56 [SD = 0.35] [t61 = !3.22, P < .01]), although smaller size contrasts (STS condition) also induced a significant effect (hearing, 0.32 [SD = 0.31]; deaf, 0.20 [SD = 0.18] [t60 = !2.22, P < .02]) (see figure 2). Accuracy within the smallest size contrasts (0.02 and 0.06) did not significantly differ between the groups. However, on average, hearing subjects were less susceptible/more accurate relative to hearing subjects in both small size contrasts (0.02 contrast, hearing = 0.23 [SD = 0.30], deaf = 0.16 [SD = 0.25] [t60 = !0.84, ns]; 0.06 contrast, hearing = 0.40 [SD = 0.26], deaf = 0.32 [SD = 0.31] [t60 = !1.02, ns]). The remaining individual comparisons comprising the LTS condition (0.10, 0.14, and 0.18) were significant at each contrast level (hearing accuracy > deaf accuracy) (0.10 contrast, hearing = 0.70 [SD = 0.26], deaf = 0.47 [SD = 0.36] [t61 = !2.61, P = .01]; 0.14 contrast, hearing = 0.80 [SD = 0.21], deaf = 0.55 [SD = 0.35] [t61 = !3.48, P < .01]; 0.18 contrast, hearing = 0.86 [SD = 0.18], deaf = 0.64 [SD = 0.39] [t61 = !2.85, P < .01]). The interaction between hearing status and size contrast condition was significant in the STS and LTS conditions (STS: F62 = 4.97, P < .03; LTS: F64 = 11.05, P < .01) and provided additional evidence for the hypothesis that size perception was, on average, less context sensitive in hearing than deaf patients with schizophrenia.
Downloaded from schizophreniabulletin.oxfordjournals.org by guest on July 27, 2011
All subjects (n = 65) were context sensitive. Following Doherty,45 we examined performance differences between the helpful and misleading context (16 items each, using items with a 2% size difference where the illusion effect was expected to be strongest) as a metric for the extent of the illusion effect for each subject. Additional analyses involving all size pairs are presented below. Subjects were highly accurate when the context was helpful (mean = 0.84 correct, SD = 0.27) and much less accurate when it was misleading (mean = 0.21 correct, SD = 0.26) (t62 = 9.65, P < .01). When analyzed separately, hearing and deaf subjects were equally assisted by the helpful context: hearing, 0.83 correct, SD = 0.27; deaf, 0.86 correct, SD = 0.27; t61 = 0.38 (not significant [ns]), but were not equally misled in the test condition. Hearing subjects displayed better size discrimination ability (0.23, SD = 0.28) compared with deaf subjects (0.11, SD = 0.13) when the context was misleading (t63 = 2.17, P = .03). Because only the context distinguishes the conditions, we can be confident that any effects are due to context alone.4 These findings indicate that deaf subjects were on average more affected by the illusion relative to hearing subjects and so performed more like healthy controls in past studies (ie, they were consistently deceived). An overall level of context sensitivity was reflected by the actual size difference needed to overcome the misleading effects of target-surround contrast across 80 trials. Figure 2 presents the proportion of correct responses—as a function of size difference—for both hearing and deaf groups in the test conditions (STS, 32 trials; LTS, 48 trials). Including all size pairs, the mean level of discrimination accuracy in the test condition was 0.60 (SD = 0.15) for hearing subjects and 0.43 (SD = 0.27) for deaf subjects (80 trials: t61 = 2.87, P < .01). The general pattern of increasing accuracy for both groups indicates that responses to small size contrasts (0.02–0.06) induced a greater number of inaccurate size judgments compared with the large size contrasts (0.10–0.18), consistent with past research.45 As expected, the illusion’s effect diminished in the latter condition, and size discrimination accuracy increased, especially for hearing subjects.
Context Processing, Deafness, and Schizophrenia
1
Symptoms and Context Sensitivity
0.9 Deaf Non-Disorganized (n=18)
Size Perception Accuracy (mean correct)
0.8
Deaf Disorganized (n=16)
0.7
Hearing Non-Disorganized (n=20)
0.6
Hearing Disorganized (n=11)
0.5 0.4 0.3 0.2 0.1 Control
Small Target Size Large Target Size
Condition
Fig. 3. Size perception accuracy: disorganized and non-disorganized group comparisons (deaf, hearing).
t33 = !3.55, P < .01), and 0.40 for D hearing subjects (SD = 0.32, t28 = !3.79, P < .01). The difference between D deaf and D hearing subjects trended toward significance (0.33 vs 0.40, t26 = !1.85, P = .08). In the LTS condition, the illusion no longer differentially influenced D and ND hearing subjects; each group was 78% accurate (SD = 0.21). In contrast, D and ND deaf subjects continued to be distinguished by level of visual integration in the LTS condition: 0.69 accurate (SD = 0.27) vs 0.43 accurate (SD = 0.36), respectively (t30 = 2.35, P < .03) (see figure 3). The interaction between hearing status and disorganization was significant in the control (F61 = 3.91, P < .01) and LTS conditions (F62 = 3.80, P = .05) and was in the expected direction in the STS condition (F62 = 2.31, P = .13). In all, disorganization was a stronger correlate of context sensitivity when target size differences were small (control and STS condition) while hearing status was on average a stronger correlate of context sensitivity when size differences were large (LTS condition). Age of Sign Language Acquisition, Linguistic Ability, and Context Processing For deaf subjects only, associations were evaluated between age of SLA, linguistic ability, and context sensitivity. It was anticipated that early SLA (0–7.00 y) and superior linguistic (sign) ability would be associated with strong illusion effects. First, an earlier age of SLA and superior linguistic ability (total score) were significantly correlated (r33 = !0.47, P < .01) (figure 4). Of the linguistic ability subscales (grammar, fluency, vocabulary, and physical production), ‘‘fluency’’ was the strongest correlate of early SLA (ie, rhythm, pace, and flow of delivery) (r33 = !0.50, P < .01). However, fluency was only weakly associated with context sensitivity (STS, LTS, ns) while ‘‘physical production’’ (ie, formation and execution, intelligibility, clarity, and nonlinguistic/ 721
Downloaded from schizophreniabulletin.oxfordjournals.org by guest on July 27, 2011
Previous work, including our own, has established that cognitive, social cognitive, and symptom indicators among deaf people with schizophrenia are generally similar to those of hearing people with schizophrenia, with a few notable exceptions.42,46–48 Symptom profiles previously established in the current sample by a CFA of the BPRS (table 2) were compared with context processing variables. Consistent with past literature, the disorganized syndrome was the only significant correlate of a weakened illusion effect. Subjects scoring equal to or above moderate levels on the BPRS item ‘‘conceptual disorganization’’ (ie, "4, range 1–7) were analyzed further. Twenty-seven (42%) subjects presented with high levels of conceptual disorganization (deaf = 16, hearing = 11); the remaining subjects (58%) were labeled non-disorganized (deaf = 18, hearing = 20). The helpful context (control condition, 16 trials.) facilitated size discrimination for non-disorganized (ND) subjects who were significantly more accurate (mean = 0.91 correct, SD = 0.15) than disorganized (D) subjects (mean = 0.73 correct, SD = 0.35) (t61 = 2.56, P < .01). In the misleading context (test condition, 80 trials), ND subjects were significantly less accurate when judging size differences (ie, more context sensitive) (mean = 0.45 correct, SD = 0.24) than were D subjects (mean = 0.60 correct, SD = 0.21) (t61 = !2.56, P = .01). The difference between control and test condition scores was significant for ND subjects (0.91 vs 0.45) (t36 = 9.66, P < .01) and trended toward significance for D subjects (0.73 vs 0.60) (t25 = 1.50, P = .15). When analyzed separately, ND deaf subjects were 93% accurate (SD = 0.13) in the control condition and 27% accurate (SD = 0.25) in the test condition (80 trials) revealing a strong illusion effect (t17 = 8.12, P < .01) (see figure 3). The same comparison for ND hearing subjects was also significant, reflecting a slightly smaller raw difference: 89% correct (SD = 0.17) vs 52% correct (SD = 0.12) (t19 = 2.94, P < .01). The D deaf subjects’ level of context sensitivity did not significantly differ from ND hearing subjects; they (D deaf subjects) were 84% accurate (SD = 0.19) in the control condition and 52% correct (SD = 0.23) in the test condition (t14 = 3.98, P < .01). Of all groups, D hearing subjects were the least accurate in the control condition (72% correct, SD = 0.37) and the most accurate group in the test condition (60% correct, SD = 0.19); thus, they were the least context sensitive. It follows that D hearing subjects were the only subgroup whose scores did not significantly differ across control (16 trials) and test (80 trials) conditions (0.72 vs 0.60, t10 = 0.554, ns). Figure 3 also depicts group differences by condition (STS and LTS). In the STS condition (32 trials), ND deaf subjects were only 0.11 accurate (SD = 0.15) compared with 0.27 for ND hearing subjects (SD = 0.17, t37 = !3.05, P < .01), 0.33 for D deaf subjects (SD = 0.21,
H. K. Horton & S. M. Silverstein
Late SLA
All deaf subjects: Early SLA: Late SLA:
r32: r21: r11:
-.469, P =0.006 -.558, P =0.09 (bottom fit line) -.383, P =0.08 (top fit line)
Fig. 4. Scatter plot. Age of sign language acquisition (SLA) and linguistic ability (total score): Early and late SLA.
affective use of space, face, and body movements) significantly influenced discrimination accuracy (figure 5). Subjects with above average levels of physical production were more accurate in the control condition (0.90, SD = 0.20) and less accurate in the STS condition (0.17, SD = 0.21) (t16 = 8.12, P < .01) relative to subjects with below average signing skills (0.78, SD = 0.34 vs 0.33, SD = 0.28) (t13 = 2.70, P < .2). Better linguistic ability (ie, physical production) was not associated with context sensitivity when size contrasts were large. Age of SLA did not significantly predict discrimination accuracy in the control condition; early (0.82 correct) and A
Early SLA
B
Early SLA Late SLA
Late SLA
All deaf subjects: Early SLA: Late SLA:
r32: r23: r9 :
-.432, P =0.01 -.421, P =0.04 (top fit line) -.561, P =0.11 (bottom fit line)
All deaf subjects: Early SLA: Late SLA:
r32: r23: r11:
-.096, P =0.58 .085, P =0.70 (bottom fit line) -.326, P =0.32 (top fit line)
Fig. 5. Scatter plots. Linguistic ability and size perception accuracy, small (A) and large (B) target size conditions: Early and late sign language acquisition.
722
Downloaded from schizophreniabulletin.oxfordjournals.org by guest on July 27, 2011
late (0.87 correct) learners were equally assisted by the helpful context (SD = 0.26, 0.33, respectively, ns). In the STS condition, age of SLA was significantly associated with increased context sensitivity for ‘‘late’’ learners only (8.00–20.00 y of age) (see figure 6B). Overall, however, early (0.27 correct) and late (0.20 correct) learners were equally misled in the STS condition (SD = 0.27, 0.25, respectively) (figure 6A and 6B). In the LTS condition, age of SLA was significantly associated with decreasing levels of context sensitivity (ie, increased accuracy) (figure 7). Significant discrimination differences were evident between early (0.52 correct, SD = 0.33) and late (0.78 correct, SD = 0.17) sign language learners in the LTS condition (t29 = !3.40, P < .01). The relationship between age of SLA and context sensitivity remained significant when levels of linguistic ability (t28 = !2.10, P < .04) and disorganization (t28 = !1.10, P = .05) were controlled. The interaction between age of SLA—which was significantly correlated with higher LTS accuracy (figure 7)—and linguistic ability—which was significantly correlated with higher STS accuracy (figure 5A)—did not predict context sensitivity in any condition. The scatter plots support these findings and make clear that the influence of delayed SLA on decreased visual integration imposed an influence across the life span that was particularly strong after 7 years of age (figures 4, 6, and 7). A case-by-case analysis revealed that deaf subjects who displayed the highest levels of visual context sensitivity (across all conditions) were non-disorganized, early language learners with superior physical production of ASL; they also had shorter illness durations (described below). Building upon findings regarding symptoms, linguistic ability and disorganization strongly predicted increased and decreased context sensitivity (respectively) to small
Early SLA
Context Processing, Deafness, and Schizophrenia
A
Early SLA
Early SLA: r22 Mean accuracy
= =
.027 0.27
P = 0.91
B Late SLA
Late SLA: r11 Mean accuracy
= =
.627 0.20
P = 0.05
All deaf subjects:
r33
=
.095
P =0.61
size contrasts, and deaf-hearing visual integration differences were moderate albeit significant in this condition (deaf > hearing). On the other hand, age of SLA strongly predicted increased context sensitivity in the large size contrast condition (early learners > late learners) and deaf-hearing visual integration differences were highly significant in this condition (deaf > hearing). Clinical and Demographic Correlates of Context Sensitivity In addition to symptoms, other clinical and demographic domains were examined in relation to levels of visual integration. Illness severity and duration means and SDs for deaf and hearing subjects were equivalent (table 1). SupportA
ing findings of Silverstein et al,38 subjects with dysfunctions in visual integration were characterized by a longer course of illness (figure 8). When analyzed separately, the relationship was significant for deaf but not hearing subjects in all conditions; only disorganization was a stronger correlate. Other clinical and demographic variables were generally uncorrelated to size discrimination for both groups (eg, age, gender, handedness, education, illness severity, and history of substance use). Discussion The primary finding is that relative to deaf patients with schizophrenia, hearing patients displayed a significantly B
Early SLA
Early SLA: r20 Mean accuracy
= =
.333 0.52
P =0.15
Late SLA
Late SLA: r9 Mean accuracy
= =
.528 0.78
All deaf subjects:
r31:
.438, P =0.01
P =0.09
Fig. 7. Scatter plots. Age of sign language acquisition (SLA) and size perception accuracy, large target size condition: early (A) and late (B) SLA.
723
Downloaded from schizophreniabulletin.oxfordjournals.org by guest on July 27, 2011
Fig. 6. Scatter plots. Age of sign language acquisition (SLA) and size perception accuracy, small target size condition: Early (A) and late (B) SLA.
H. K. Horton & S. M. Silverstein
Hearing Deaf
All subjects: Deaf subjects: Hearing subjects:
r61: r30: r31:
.256, P = .05 .461, P = .01(bottom fit line) -.022, P = .91 (top fit line)
reduced sensitivity to visual context and therefore were more accurate in their size judgments. Hearing patients, therefore, performed like hearing patients in past studies, whereas deaf patients performed more like people without schizophrenia in past studies. Moreover, hearing patients were relatively unaffected by the effects of context even at the smallest size contrasts, whereas deaf patients were influenced by the illusion even when the size contrasts were quite large. Thus, relative to hearing subjects, much larger size contrasts were needed for deaf subjects to overcome the misleading effects of context. Increased visual integration (deaf > hearing) was most evident in the comparison of non-disorganized deaf and hearing subjects across both test conditions (small and large). This highlights the role of a deafness-related factor (see below) in overriding the schizophrenia-related insensitivity to the illusion, presumably by increasing visual attention to the surrounding visual context. But it also highlights the role of disorganization in driving the schizophrenia-related illusion insensitivity. For example, in contrast to the difference between non-disorganized deaf and hearing subjects, disorganized deaf subjects were on average only slightly more context sensitive than disorganized hearing subjects. It is therefore reasonable to hypothesize that whereas deafness is associated with superior visual context processing abilities, disorganization is associated with weakened visual context processing abilities, and so the former reverses while the latter amplifies visual integration changes associated with schizophrenia. A significant relationship between early SLA and increased context sensitivity provided evidence that experience with sign language influenced visual context integration. Relative to late sign language learners and 724
Downloaded from schizophreniabulletin.oxfordjournals.org by guest on July 27, 2011
Fig. 8. Scatter plot. Size perception accuracy (total score) and illness duration: deaf, hearing.
hearing nonsigners, early learners displayed a level of sensitivity to context that approached normal levels. Though measurement occurred 20–30 years after first exposure to sign language, delayed SLA exerted a significant influence well past childhood and into young adulthood. The relationship was particularly strong in the LTS condition and remained significant once linguistic ability and disorganization were controlled. The fact that most of the deaf subjects were exposed to less than ideal language models during early childhood (eg, teachers for whom ASL was not a first language) as well as varying levels of socialization with deaf people highlights the potency of the effect because even degraded modeling appeared to influence visual perception. More definitive conclusions about the effects of visual integration experience and schizophrenia on perception would be gained by demonstrating reduced levels of visual integration among hearing relative to deaf subjects across both schizophrenia patients and psychiatrically healthy groups of subjects. With such a design, changes in visual integration that are schizophrenia related can be disentangled from those caused by deafness. For example, if psychiatrically healthy deaf subjects demonstrated stronger illusion effects (ie, lower accuracy on misleading context trials) than psychiatrically healthy hearing subjects, this would provide strong evidence of a deafness-related superiority in visual context processing and integration, without any potential confounds from examining this in a study of schizophrenia patients. Similarly, if psychiatrically healthy hearing subjects performed like non-disorganized deaf patients with schizophrenia, this would provide further evidence that the latter group’s performance in the present study was essentially normal. A study including native signers who are hearing (eg, people born to deaf parents) would further isolate the effect of early SLA on adult levels of visual integration. For example, if native signers who are hearing demonstrated the same enhanced illusion effect as deaf subjects, this would suggest that our findings are due to experience with ASL (as our correlational data suggest) and not to deafness per se. Such findings would also raise the possibility that it is intense experience with tasks involving visual-spatial problem solving, and not use of sign language, that drives the effect. Because our study is limited by not including psychiatrically healthy control groups of the type noted here, its findings can in some sense be considered preliminary. On the other hand, it is important to note that the finding of a disorganization-related superiority on the Ebbinghaus illusion task has been demonstrated in 3 other studies of schizophrenia and schizotypy.14,15,16 Moreover, the hypothesis that deaf schizophrenia patients would perform more normally than hearing schizophrenia patients on the illusion task was an a priori hypothesis (based on our prior work on cognition in deaf schizophrenia patients and on cognitive effects of experience using ASL) that would not be predicted on the basis of a generalized deficit
Context Processing, Deafness, and Schizophrenia
2. 3.
4. 5.
6. 7.
8.
9.
10.
11.
12.
13.
Funding National Institute of Mental Health (T32 MH 19119, MH 16089-21, 22, and 23). Acknowledgments The authors are grateful to the members and staff of Thresholds (Chicago, IL). We also thank Bill Phillips for providing us with the Ebbinghaus illusion task program. The Authors have declared that there are no conflicts of interest in relation to the subject of this study. The National Institute of Mental Health had no further role in study design; in the collection, analysis and interpretation of data; in the writing of the report; and in the decision to submit the paper for publication.
References 1. Uhlhaas PJ, Phillips WA, Silverstein SM. The course and clinical correlates of dysfunctions in visual perceptual organi-
14.
15.
16.
17.
18. 19.
20.
zation in schizophrenia during the remission of psychotic symptoms. Schizophr Res. 2005;75:183–192. Kovacs I. Human development of perceptual organization. Vision Res. 2000;40:1301–1310. Phillips WA, Singer W. In search of common foundations for cortical computation. Behav Brain Sci. 1997;20:657–683 discussion 683–722. Phillips WA, Chapman LS, Berry PD. Size perception is less context-sensitive in males. Perception. 2004;33:79–86. Chechile RA, Anderson JE, Krafczek SA, Coley SL. A syntactic complexity effect with visual patterns: evidence for the syntactic nature of the memory representation. J Exp Psychol Learn Mem Cogn. 1997;22:654–669 Erratum in: J Exp Psychol Learn Mem Cogn 1997;23:279. Glezer VD. Vision and Mind. Mahwah, NJ: Erlbaum; 1995. Zbrodoff NJ, Logan GD. On the relation between production and verification tasks in the psychology of simple arithmetic. J Exp Psychol Learn Mem Cogn. 1990;16:83–97. Stoet G, Hommel B. Action planning and the temporal binding of response codes. J Exp Psychol Hum Percept Perform. 1999;25:1625–1640. Phillips WA, Silverstein SM. Convergence of biological and psychological perspectives on cognitive coordination in schizophrenia. Behav Brain Sci. 2003;26:65–138. Knight RA, Silverstein SM. The role of cognitive psychology in guiding research on cognitive deficits in schizophrenia: a process oriented approach. In: Lenzenweger M, Dworkin R, eds. Origins and Development of Schizophrenia: Advances in Experimental Psychopathology. Washington, DC: APA Press; 1998:247–295. Silverstein SM, Keane BP. Perceptual organization impairment in schizophrenia and associated brain mechanisms: review of research from 2005–2010. Schizophr Bull. 2011;37:690–699. Jones SH, Hemsley DR, Gray JA. Contextual effects on choice reaction time and accuracy in acute and chronic schizophrenics: impairment in selective attention or the influence of prior learning? Br J Psychiatry. 1991;159:415–421. Kuperberg GR, McGuire PK, David AS. Reduced sensitivity to linguistic context in schizophrenic thought disorder. J Abnorm Psychol. 1998;107:423–434. Uhlhaas PJ, Silverstein SM, Phillips WA, Lovell PG. Evidence for impaired visual context processing in schizotypy with thought disorder. Schizophr Res. 2004;68:249–260. Uhlhaas PJ, Phillips WA, Schenkel LS, Silverstein SM. Theory of mind and perceptual context-processing in schizophrenia. Cogn Neuropsychiatry. 2006;11:416–436. Uhlhaas PJ, Phillips WA, Mitchell G, Silverstein SM. Perceptual grouping in disorganized schizophrenia. Psychiatry Res. 2006;145:105–117. Doherty MJ, Campbell NM, Tsuji H, Phillips WA. The Ebbinghaus illusion deceives adults but not young children. Dev Sci. 2010;13:714–721. Kaldy Z, Kovacs I. Visual context integration is not fully developed in 4-year-old children. Perception. 2003;32:657–666. Bavelier D, Brozinsky C, Tomann A, Mitchell T, Neville H, Lin G. Impact of early deafness and exposure to sign language on the cerebral organization for motion processing. J Neurosci. 2001;21:8931–8942. Fine I, Finney EM, Boynton GM, Dobkins KR. Comparing the effects of auditory deprivation and sign language within the auditory and visual cortex. J Cogn Neurosci. 2005;17: 1621–1637.
725
Downloaded from schizophreniabulletin.oxfordjournals.org by guest on July 27, 2011
alone. Indeed, we observed the relative pattern that was to be expected based on these prior findings: the highest level of context sensitivity was among deaf non-disorganized subjects followed, in turn, by hearing non-disorganized, deaf disorganized, and hearing disorganized subjects (see figure 3). Given that deafness alters processes of language acquisition, and in the context of data indicating that the susceptibility to the Ebbinghaus illusion develops on the basis of visual experience,17 our data suggest that perceptual organization dysfunction in schizophrenia is plastic and may be amenable to remediation, especially in the form of practice with visual integration and/or top-down effects that can mediate the influence (see below). It is important to note that unlike early-occurring forms of perceptual organization, such as contour integration, that rely on a feature linking process,49 the Ebbinghaus illusion is thought to reflect a later, cognitive comparison process.50 This is consistent with the top-down effects of learning on the extent of the illusion effect. However, it also raises the issue of whether deaf people with schizophrenia would be impaired to the same extent as hearing patients on tests of perceptual organization that are driven by lower level mechanisms. To date, these studies have not been done. However, such research would produce findings that are relevant to clarifying the extent of bottomup vs top-down contributions to perceptual organization in schizophrenia, which is still being debated.11 Moreover, use of a range of measures in clinical trials would provide important information about the cognitive and biological mechanisms of treatment effects, as revealed by different effects across tasks with known differential bases in bottom-up vs top-down processing.
H. K. Horton & S. M. Silverstein
726
36. Barch DM, Carter CS, Hachten PC, Usher M, Cohen JD. The ‘‘benefits’’ of distractibility: mechanisms underlying increased Stroop effects in Schizophrenia. Schizophr Bull. 1999;25:749–762. 37. Silverstein SM, Knight RA, Schwarzkopf SB, West LL, Osborn LM, Kamin D. Stimulus configuration and context effects in perceptual organization in schizophrenia. J Abnorm Psychol. 1996;105:410–420. 38. Silverstein SM, Bakshi S, Chapman RM, Nowlis G. Perceptual organization of configural and nonconfigural visual patterns in schizophrenia: effects of repeated exposure. Cogn Neuropsychiatry. 1998;3:209–223. 39. First MB, Spitzer RL, Gibbon M, Williams JBW. Structured Clinical Interview for DSM-IV Axis I Disorders—Patient Edition. (SCID-I/P Version 2.0, 4/97 revision). New York, NY: State Psychiatric Institute, Biometrics Research; 1997. 40. Barker S, Barron N, McFarland BH, Bigelow DA, Carnahan T. A community ability scale for chronically mentally ill consumers: part II. Applications. Community Ment Health J. 1994;30:459–472. 41. Ventura J, Green MF, Shaner A, Liberman RP. Training and quality assurance with the Brief Psychiatric Rating Scale: "The drift busters. Int J Methods Psychiatr Res. 1993;3:221–244. 42. Horton HK, Silverstein SM. Factor structure of the BPRS in deaf people with schizophrenia: correlates to language and thought. Cogn Neuropsychiatry. 2011;16:256–283. 43. Caccamise F, Newell W. Sign language communication skills: assessment, development and benefits. Deaf Life. 1996;8:24–27. 44. McMains S, Kastner S. Interactions of top-down and bottom-up mechanisms in human visual cortex. J Neurosci. 2011;12:587–597. 45. Doherty M, Tsuji H, Phillips WA. The context sensitivity of visual size perception varies across cultures. Perception. 2008;37:1426–1433. 46. Haskins BG. Serving deaf adult psychiatric inpatients. Psychiatr Serv. 2004;55:439–441. 47. Black PA, Glickman NS. Demographics, psychiatric diagnoses, and other characteristics of North American deaf and hardof-hearing inpatients. J Deaf Stud Deaf Educ. 2006;11:303–321. 48. Pollard RQ. Public mental health service and diagnostic trends regarding individuals who are deaf or hard of hearing. Rehabil Psychol. 1994;39:147–160. 49. Watt R, Ledgeway T, Dakin SC. Families of models for gabor paths demonstrate the importance of spatial adjacency. J Vis. 2008;8:1–23. 50. Coren S, Enns JT. Size contrast as a function of conceptual similarity between test and inducers. Percept Psychophys. 1993;54:579–588.
Downloaded from schizophreniabulletin.oxfordjournals.org by guest on July 27, 2011
21. Neville HJ, Bavelier D, Corina D, et al. Cerebral organization for language in deaf and hearing subjects: biological constraints and effects of experience. Proc Natl Acad Sci USA. 1998;95:922–929. 22. Proksch J, Bavelier D. Changes in the spatial distribution of visual attention after early deafness. J Cogn Neurosci. 2002;14:687–701. 23. Bavelier D, Dye MWG, Hauser PC. Do deaf individuals see better? Trends Cogn Sci. 2006;10:512–518. 24. Emmorey K, Kosslyn S, Bellugi U. Visual imagery and visual-spatial language: enhanced imagery abilities in deaf and hearing ASL signers. Cognition. 1993;46:139–181. 25. Corina D, Bellugi U, Reilly JS. Neuropsychological studies of linguistic and affective facial expressions in deaf signers. Lang Speech. 1999;42:307–331. 26. McCullough S, Emmorey K, Sereno M. Neural organization for recognition of grammatical and emotional facial expressions in deaf ASL signers and hearing nonsigners. Cogn Brain Res. 2005;22:193–203. 27. Bettger JG, Emmorey K, McCullough SH, Bellugi U. Enhanced facial discrimination: effects of experience with American Sign Language. J Deaf Stud Deaf Educ. 1997;2: 223–233. 28. Emmorey K. Language Cognition and the Brain: Insights from Sign Language Research. Mahwah, NJ: Erlbaum; 2002. 29. Neville H. Cerebral organization for spatial attention. In: Stiles-Davis J, Kritchevsky M, Bellugi U, eds. Spatial Cognition: Brain Bases and Development. Mahwah, NJ: Erlbaum; 1988:327–341. 30. Kubota Y, Querel C, Pelion F, et al. Facial affect recognition in pre-lingually deaf people with schizophrenia. Schizophr Res. 2003;61:265–270. 31. Nuechterlein KH, Barch DM, Gold JM, Goldberg TE, Green MF, Heaton RK. Identification of separable cognitive factors in schizophrenia. Schizophr Res. 2004;72:29–39. 32. Saykin AJ, Shtasel DL, Gur RE, et al. Neuropsychological deficits in neuroleptic naive patients with first-episode schizophrenia. Arch Gen Psychiatry. 1994;51:124–131. 33. Keefe RSE, Bilder RM, Harvey PD, et al. Baseline neurocognitive deficits in the CATIE schizophrenia trial. Neuropsychopharmacology. 2006;31:2033–2046. 34. Corina D, Singleton J. Developmental social cognitive neuroscience: insights from deafness. Child Dev. 2009;80:952– 967. 35. Cohen JD, Barch DM, Carter CS, Servan-Schreiber D. Context processing deficits in schizophrenia: converging evidence from three theoretically motivated tasks. J Abnorm Psychol. 1999;108:120–133.