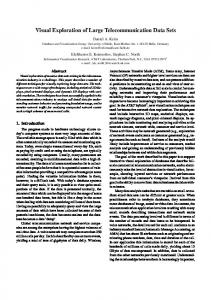
lems; traffic jam sensors; traffic accident reports; bus traffic logs; social media like Twitter ... The Dashboard Webble is the top parent of all Webbles. The visu-.
Visual Data Exploration using Webbles Jonas Sj¨obergh and Yuzuru Tanaka Meme Media Lab, Hokkaido University, Japan {js, tanaka}@meme.hokudai.ac.jp
Abstract. We describe a system for visual exploration of data built using pluggable software components called Webbles. The system specifies a small common interface, a set of slots the plugins are expected to have, and any Webble following this interface can be plugged in at runtime. The system contains several types of visualization components, some built from scratch, some built by writing Webble wrappers for existing software, and some built by writing small interface wrappers for existing Webbles. The visualization components allow for interactive exploration of data, and selections or grouping of data in one visualization component are propagated to other components automatically. Interaction is done through direct manipulation of the visualization results.
1
Introduction
Nowadays very large collections of data are common in many areas. Sometimes the real world system generating the data is difficult to model, what parameters influence the model in what way may not be known in detail. Thus, even though we can collect lots of data that probably contains information we are interested in, using this data to predict what we want to know may still be difficult. One example from our research is snow plowing and snow removal in Sapporo, a city with almost two million citizens that gets six meters of snow per year. The cost of removing snow are around 15,000,000,000 yen per year (150 million dollars). Using modern IT technology, it may be possible to decrease cost, improve quality, or remove snow in a more environmentally friendly way. We have data from many sources: weather stations (temperatures, snow fall, wind, etc.); taxis and private cars regularly recording speed and position; snow plowing and snow removal records; logs from call centers for snow related problems; traffic jam sensors; traffic accident reports; bus traffic logs; social media like Twitter (are people talking about problems with snow?), and more. A lot of these data are likely to be related to snow removal, e.g. less complaints when snow removal works well or lower average speeds of cars and buses when snow is not removed. The system is of course very complex, though, and it is difficult to model what factors will have what impact on e.g. traffic conditions. The data is very high dimensional, very sparse (e.g. a few thousand cars with sensors driving over 100,000 road segments means low coverage), and often of low quality. There are sensor failures leaving “holes” in the data, manually entered data (e.g. call center complaints) with input errors, and unreliable data sources,
e.g. people on social networks may not be serious or even telling the truth. These factors make naive application of many automatic analysis methods difficult. We believe that for problems that are difficult to model, interactive visualization and exploration of data can be useful. Once the problem is understood well enough to be modeled, standard statistical approaches can be used to find optimal solutions but before we can model the system such methods are difficult to use. Interactively exploring data helps in understanding and give insights, and if it can be done by domain experts (not only data mining experts) they can use their expert knowledge and intuitions about the domain too. We present a data exploration system, the Digital Dashboard. It was built using pluggable software components called Webbles [1], the latest generation of the Meme Media IntelligentPad system [2]. Meme Media aims to make services and functionality as easy to reuse as copy-pasting texts or images already is.
2
System Description
The Digital Dashboard is being developed in a project focusing on snow removal and it was designed to be easy to use by both experts and non-experts. The main user interface is direct manipulation of the visualization results. Aside from the Dashboard Webble itself, there are two types of components: data sources and visualization components. New components of both types can be built and plugged in at any time, even when already running. The only thing required is that components adhere to a simple interface. User interaction is handled by each component separately and thus any type of interaction is possible. Existing components allow for instance clicking on bars in a histogram to select data items that correspond to those bars, or selecting areas on a map to select data items from those areas. Selecting separate groups of data, e.g. two different areas on a map, can be used to select non-continuous subsets of data or to create groups of data to compare to each other. When selections in one component change, all other components are immediately updated.
Dashboard Webble
Data Source Webble Data Source Webble Data Source Webble
Web Service Connector
Visualization Component Webble Visualization Component Webble Visualization Component Webble
Wrapped ArcGIS Software
Fig. 1. An example Webble hierarchy. All components are children of the Dashboard Webble, and some children wrap other Webbles that are in turn connected as children.
An example diagram of the connections between the Webbles is shown in Figure 1. The Dashboard Webble is the top parent of all Webbles. The visualization components can have children of their own, if they for instance wrap the functionality of software not developed for the Dashboard. The data source
Fig. 2. Interacting with Twitter data. Top: Data contains timestamps (24h clock, upper left), text (search box, lower left), and GPS tags (map). Bottom Left: Selecting only afternoon data. Bottom Right: Restrict to city center areas, zoom in, and show only tweets with the word “matsuri” (“festival”). Mouse-over shows an individual tweet.
Webbles can also have children, e.g. Webbles for accessing Web services. No slots are directly connected but the Dashboard (parent) Webble listens to slot changes from its children and reads and sets slot values of the children when appropriate. In Figures 2 and 3, all visible Webbles are visualization components, except the map which is a Webble developed independently and later wrapped to work with the Dashboard. The Dashboard Webble and the data source Webbles are all invisible, but can be made visible if there is a reason to interact with them. 2.1
Usage Example
Figures 2 and 3 show a simple example of using the Digital Dashboard to explore data from our snow removal project. The user opens the Webble World web page1 and loads the Digital Dashboard Webble. The user also loads a data 1
http://www.meme.hokudai.ac.jp/WebbleWorld/WebbleWorldIndex.html
source Webble for some data collected from Twitter. The data contains short text messages that are timestamped and GPS tagged. To visualize these data, the user loads a 24 hour clock visualization component, a text query component, and a map, resulting in the top image in Figure 2. The map shows locations were tweets were sent and the clock displays dots at times tweets were sent. Next (bottom left image) only tweets from the afternoon are shown, by selecting (clicking and dragging) a part of the clock. This automatically updates the dots displayed both on the clock and the map. The selection is further restricted to two smaller areas by clicking and dragging on the map. The user also zooms in, and selects only tweets containing the word “festival” (in Japanese) using the text query component (bottom right image). The contents of an individual tweet are also examined by hovering over the location of the tweet.
Fig. 3. Mash-up of Twitter data and taxi probe car (per road segment) data. Top: Data is joined on timestamps (24h clock, upper left) and geographic position (map, center). Twitter data also has a text filter. Taxi data also has speed and speed difference compared to summer (histograms). Bottom: Grouping data by time, night vs. noon.
In Figure 3 the user continues by adding a new data source with taxi probe car data. This contains road segments. For each road segment in the city there is the
geographical location, a timestamp, the average speed of and average number of sensor equipped cars passing each 5 minute interval, and the difference in average speed compared to the speed in the summer. The data were further averaged over two hour intervals in this example. The user also loads two copies of a histogram visualization component. The user joins the two data sources on the timestamp data, then shown in the 24 hour clock, and on the geographical information, shown on the map. The average speed is shown using the top histogram, and the drop in average speed compared to summer in the bottom histogram (top image in Figure 3). The user then (bottom image) groups the data into two groups, night time data and noon data, by clicking and dragging two times on the 24 hour clock component. The speed histogram shows that taxis have higher average speeds at night (light bars) than at noon (dark bars). An example of trying to find something more useful is selecting only road segments with large speed downs compared to summer conditions, by selecting this part of the histogram showing speed downs and selecting only night time traffic using the clock component. Speed downs can be caused by many things but if the winter traffic is slow even at night (little traffic) the cause is often ice or snow related. It is then possible to zoom in on problem areas and see what people on Twitter are mentioning there (“slippery”? or “construction work”?). Adding other data sources like traffic accident data may also give useful information. 2.2
Data Source Components and their Interface
The data source components hide the actual data format from the system, making the system independent of the underlying data storage. This makes it easy to mash-up data from different sources, e.g. visualizing probe car data stored in a relational database and complaints to a call center stored in a plain text file together with geographically tagged text messages received from a social networking service in real time. The data source plugins are responsible for transforming the data to a standard format used by the Digital Dashboard. We have generic plugins that access relational databases and format the result of an SQL query into the expected format, and plugins for accessing web services. This makes it easy to add new data sources if they are of any of the already supported types. The system currently expects data in XML format and it can look like this: 19a10:15 35d11:11 ... ...
The XML contains the name of the data source to present to the user, names and data types of the data fields in the data set, and data values. All data values have an ID field and any data with the same ID coming from the same data source are assumed to be connected. The data types are used to determine which visualization plugins can visualize what data. A clock plugin for timestamps will only be matched to data of that type, and plugins that visualize geographical locations will only be matched to data containing geographical information, etc. The system itself does not need to understand the data types, the only requirement is that the data source and the visualization plugins agree on the name and format of the data type. This means that it is possible to add plugins that handle new data types that the Dashboard system has never seen without changing anything in the system. The interface of the data source components is very simple. They are expected to have two slots: PluginName and DataValues. The PluginName slot should contain a string with the name to display to the user when necessary. The DataValues slot should contain the data in XML. When doing a mash-up of several data sources, the Dashboard is used to choose how to join the different data sets. Data fields in separate data sets that have the same data types can be joined. An example: we might have data with latitude, longitude, time-of-day and text in our Twitter data source; data with latitude, longitude, time-of-day, and speed in our Probe car data set; and data with time-of-day and temperature in our Weather sensor data set. Then the Twitter and Probe car data sets could be joined on the time-of-day and on the location, and all three data sets could be joined on the time-of-day. Selecting a geographic area using some visualization component would then remove subsets of both the Twitter data and the Probe car data (data points outside the selected area), but would not affect the Weather sensor data. Selecting only data from the night time would affect all data sources, and selecting only data containing the word “snow” would only affect the Twitter data. 2.3
Visualization Components and their Interface
The Digital Dashboard hides the properties of the data and the existence of and interaction with any other visualization components from each visualization component. The parts of the visualization component that interact with the rest of the Dashboard are thus simple, and more effort can be spent on the actual visualization. Visualization components are expected to have the following slots: PluginName, should have a string indicating what the plugin should be called in the user interface, e.g. when selecting which plugin to use for certain data. RequiredDataFields, a slot with XML describing what data fields this plugin wants. A plugin showing dots on a map for locations of sent text messages and displaying the message text when the mouse pointer is over the message location could specify that it wants a latitude, a longitude, and a text field. Fields can be optional, e.g. it could be OK that some items have no text but all items must have latitude and longitude. A plugin can accept several different sets of data
fields, for instance a plugin showing road segments could accept fields with start and end points or fields with a start point, a direction, and a segment length. DataValues, a slot where the Dashboard inputs the data to be visualized, in one of the formats specified by the previous slot. GroupColors, XML indicating which group of data should be visualized in what color. This slot is used to coordinate the use of color between all plugins so that e.g. green dots on the map correspond to green bars in the histogram. LocalSelections, a slot with a dictionary mapping data item IDs to group IDs. The mapping shows which data items are selected, and in which group it has been placed. The selections are the selections in this component only. If the user has selected one group of data with speeds above 60 km/h and another group of data with speeds below 10 km/h by selecting bars in a histogram, the dictionary would map each ID belonging to data items with speeds above 60 km/h to group 1, IDs of data items with speeds below 10 km/h to group 2, and all other IDs to group 0 (the unselected items). GlobalSelections, also a dictionary mapping data item IDs to group IDs. Here, the mapping shows the global selection status. A data item may be put into group 1 in one component but be unselected in another (globally unselected), or items belonging to the same group in one component may be in different groups in another component and thus be in different groups globally. The Digital Dashboard coordinates the visualization components and aggregates the information from them. When the local selections in one component changes, the system updates the global selection status of any data items affected and then updates all the visualization components affected by any changes. The system also hides the data sources from the visualization components, and transforms the data source XMLs to new XMLs with the data needed by each visualization component, extracting wanted fields and removing unwanted ones, and renaming the fields to the expected names. The system will try to automatically connect data fields and visualization components. If there is only one field of a certain type (e.g. only one time-of-day field) in the data, this field is automatically assigned to all components that expect such a field. When there are several fields to choose from, the system can make guesses or it can be left to the user to select from a list of the fields of the correct type. 2.4
Wrapping Existing Functionality or Software
There are templates for making both visualization and data source plugins for the Digital Dashboard. A template is a Webble that has the slots needed and some skeleton code for common operations on slot changes, e.g. iterating over the global selection dictionary. Building a new Webble that follows the Dashboard interface is fairly easy but requires some programming knowledge. Meme Media aims to reuse existing functionality and existing software can be used in the Dashboard. An unrelated Webble that can visualize data, handle user interaction, or interact with a data source, can be used by making an adapter Webble. The adapter Webble just needs to transform the data etc. between the format of the existing Webble and the format of the Dashboard. Depending on
how different these are, this could be very easy, e.g. an almost empty adapter Webble that just forwards data from slots with the proper names to differently named slots, or it can be a fairly complex task. We built an adapter Webble that made use of several different existing Webbles to handle visualization and interaction with geographical data. The adapter Webble uses one existing Webble to display data on a map by simply transforming the XML on the DataInput slot to a comma separated list and sending it to the data slot of the existing Webble. It also takes user area selections on the map from a different existing Webble, and matches the selection coordinates to coordinates in the DataInput slot to create a mapping for the LocalSelections slot. Adding an adapter like this is easy and it took about an hour for this adapter. The Webble technology also allows wrapping of software that was not built using Webbles. The ArcGIS2 software, not built using Webbles, has been wrapped to run as a Webble and to work with the Dashboard. Depending on the software, wrapping can be fairly easy or it can require a lot of work. Once wrapped, software can be used in any Webble application. Wrapping a new data source to work with the Dashboard is generally easy. There are generic Webbles that access relational databases and web services and output data in the expected format. For many data sources, adding them is as easy as adding the URI, then specifying a table name and a login. 2.5
Strengths and Weaknesses of the Digital Dashboard System
Direct manipulation is intuitive and easy to understand for non-experts, so the Dashboard user interface is easy to use. Clicking and dragging the mouse to select e.g. an area on a map is a familiar and easy to understand operation. Selections and groupings in one component are reflected immediately in other components. All visualization components allow direct interaction with the visualization results. Selecting the data you are interested in by interacting with the thing that tells you it is interesting is powerful and convenient. Setting up a new data exploration using already existing components is easy. No programming is required, just select plugins and connect them to the system. Changing what each component visualizes is easily done using drop-down lists. The system is very generic, and data sources containing data types the system has never seen before can be dropped in at any time. As long as there are visualization components that know these data types, the system will start handling everything automatically. The system also does not need to know what type of visualization or interaction any visualization component does, and the individual components do not need to know or care about other components. This means any type of data storage, and any type of interaction, etc. is allowed. Since the system is built using Webbles, it runs in a Web browser and no special installation is necessary (though a Silverlight browser plugin is needed). The Webble technology also means that components developed for the Digital 2
ESRI (2012) ArcGIS API for Silverlight (ver. 2.4) http://help.arcgis.com/en/webapi/silverlight/
Dashboard can easily be reused in other systems and some components have already been reused in systems built by others. The pluggability of the system makes it easy to extend the functionality, to prototype new functionality, to add more data sources to mash-up with previous data, etc. When no available component does what the user wants, wrapping existing software is possible. The biggest weakness of the system right now is that it is quite wasteful with regards to memory. A lot of data is duplicated in different ways. Using XML for the data also uses a lot of memory. We plan to extend the system to also allow e.g comma separated lists of values instead of XML, though this will not help with data being duplicated in both the system itself, in an adapter plugin, and in the final visualization Webble, etc.
3
Other Similar Systems
Here we give a short overview of other systems for visualization and exploration of data, and point out some differences between them and our system. RapidMiner [3] is an open-source prototyping system for knowledge discovery and data mining. It is widely used and supports very many data mining and machine learning algorithms. It is used to graphically set up work flows for data mining. It supports multiple views of the same data and you can go back and change some step of the work flow and get a different visualization results. Like in our system, the underlying data format is hidden from the data mining operators or visualization components, and changes made to a work flow are reflected in all views of those data. The interaction when setting up work flows is a visual process, but, there is no interaction with the visualized results. Snap-Together Visualization [4] (Snap) is very similar to our system. Different visualization components are connected and e.g. selecting data in one component is automatically reflected in connected components. As in our system the interaction can be bidirectional so interactions with the second component are reflected in the first component too. Components can be connected in different ways, so selecting an item may select related items in one connected view, and open details about the selected item in another view. Snap, like our system, has a small interface that components need to follow and it is possible to wrap existing software with an interface wrapper (in for instance Visual Basic). Unlike our system, Snap expects the data to come from a database (supporting ODBC) and uses Microsoft’s COM for component (process) communication. The VERD system [5] uses IntelligentBox, another version of Meme Media, for data visualization. It works with relational databases and has a wrapper to treat Web resources as relational schema too. Using direct manipulation, it allows interactive data exploration using various visualization methods. All visualization views set up are also treated as relations, making it possible to apply the same operations to visualization views as to raw data. VERD requires the IntelligentBox environment while our system runs in any Web browser, and in VERD the interaction only goes downstream in the visualization flow, i.e. interaction with one component does not affect components earlier in the flow.
DEVise [6] is a data exploration system for relational databases. It supports multiple views that can be connected so that e.g. zooming in one view is reflected in another view, and connections can be bidirectional. DEVise supports many types of operations on the data, but the types of user interaction with the visualization results are somewhat limited. Tioga-2 [7] (now called Tioga DataSplash) is a direct manipulation system for setting up visualizations of database contents. Multiple visualizations can be connected and changes in the range to visualize in one are then automatically reflected in others. Tioga has a fairly limited set of visualization primitives and only works with relational databases as the data source.
4
Conclusions
We described a system for interactive exploration and visualization of data. It is built using pluggable components and it is easy to plug in new data sources to mash up data, and easy to plug in new components for new types of visualization. All components are connected and interactive, and e.g. selections of data in one component is immediately reflected in all other components with related data. We believe that systems such as this are useful especially for problems that are hard to model. Exploration of the data using interactive visualizations to gain ideas on how to model or analyze the data, or what subsets of data to model in what ways, is helpful. Directly interacting with the visualization results telling you that something is interesting is a powerful and convenient way to further explore the parts that look interesting.
References 1. Kuwahara, M., Tanaka, Y.: Webble world – a Web-based knowledge federation framework for programmable and customizable Meme Media objects. In: The IET Intl. Conf. on Frontier Computing 2010, Taichung, Taiwan (2010) 372–377 2. Tanaka, Y.: Meme Media and Meme Market Architecture. IEEE Press, Piscataway; NJ; USA (2003) 3. Mierswa, I., Wurst, M., Klinkenberg, R., Scholz, M., Euler, T.: YALE: Rapid prototyping for complex data mining tasks. In: KDD’06: Proceedings of the 12th ACM SIGKDD, Philadelphia, PA, USA (2006) 935–940 4. North, C., Shneiderman, B.: Snap-together visualization: a user interface for coordinating visualizations via relational schemata. In: Proceedings of AVI’00, Palermo, Italy (2000) 128–135 5. Sugibuchi, T., Tanaka, Y.: Integrated visualization framework for relational databases and web resources. In: Proceedings of IHI’04, Dagstuhl Castle, Germany (2004) 159–174 6. Livny, M., Ramakrishnan, R., Beyer, K., Chen, G., Donjerkovic, D., Lawande, S., Myllymaki, J., Wenger, K.: DEVise: Integrated querying and visual exploration of large datasets. In: Proceedings of SIGMOD’97, Tucson, AZ, USA (1997) 301–312 7. Aiken, A., Chen, J., Stonebraker, M., Woodruff, A.: Tioga-2: a direct manipulation database visualization environment. In: Proceedings of ICDE’96, New Orleans, LA, USA (1996) 208–217