The evaluation shows that line-based visual localization is suitable to solve ...... âHCI benchmark suiteâ [67, 68] and the âKITTI Vision Benchmark Suiteâ from KIT.
I NAUGURAL – D ISSERTATION zur Erlangung der Doktorwürde der Naturwissenschaftlich-Mathematischen Gesamtfakultät der Ruprecht-Karls-Universität Heidelberg
vorgelegt von
Dipl.-Inform. Naja von Schmude aus Berlin
Tag der mündlichen Prüfung: 19. Oktober 2017
V ISUAL L OCALIZATION WITH L INES
Betreuer: Prof. Dr. Bernd Jähne
Zusammenfassung Um vollkommen autonom navigieren zu können, müssen mobile Roboter in der Lage sein ihre aktuelle Position aus Sensordaten zu ermitteln. Positionsgebende Sensoren wie GPS liefern direkt eine globale Position, die aber für viele Anwendungen zu unpräzise ist. Insbesondere in Innenräumen kann GPS nicht eingesetzt werden, da dort überhaupt kein Signal empfangen werden kann. Kameras hingegen liefern reichhaltige Informationen und kommen bereits in zahlreichen Systemen zum Einsatz, z.B. für Objektdetektion und -erkennung. Die vorliegende Arbeit untersucht daher die Möglichkeit, Kameras auch zur Lokalisierung zu verwenden. Der aktuelle Stand der Forschung verwendet dazu vorrangig Methoden, die auf Punktbeobachtungen basieren. Da menschengemachte Umgebungen aber vorwiegend aus ebenen und linearen Strukturen bestehen, die als Linien im Bild erkennbar sind, liegt der Fokus dieser Arbeit auf der Verwendung von Linien zur Bestimmung der Kameratrajektorie. Um dieses Ziel zu erreichen, müssen Algorithmen zur linienbasierten Posen- und Strukturbestimmung entwickelt werden. Voraussetzung ist, dass Korrespondenzen zwischen Linienbeobachtungen derselben räumlichen Linien in mehreren Bildern gefunden werden können. Diese Arbeit stellt daher zunächst ein neues LinienmatchingVerfahren vor, das Linienbeobachtungen unter geringem Kameraversatz in Korrespondenz bringt. Das Verfahren berücksichtigt direkt, dass das Matching nicht eindeutig sein darf, da die Segmentierung der Linien zwischen den Bildern unterschiedlich ausfallen kann. Im Unterschied zu anderen Linienmatching-Methoden braucht jedoch kein Liniendeskriptor aufwendig berechnet zu werden, da optischer Fluss benutzt wird, um Linienkorrespondenzen herzustellen. In der vorliegenden Arbeit wird ein Algorithmus zur Bestimmung der relativen Pose zwischen zwei Kamerapositionen vorgestellt, der die räumlichen Linienrichtungen durch ein Clustering paralleler Linien ermittelt und zur Berechnung der relativen Rotation verwendet. Anstelle der “Manhattan Welt”-Annahme, die dem Stand der Technik zugrunde liegt, kommt eine weniger restriktive Annahme zum Einsatz, die nur Linien unterschiedlicher Richtung fordert, wobei aber der Winkel zwischen den
Richtungen unerheblich ist. Die vorgeschlagene Methode ist des Weiteren um ein Vielfaches schneller zu berechnen. Um die Geometrie der Szene aus den Bildern abzuleiten, wird ein neues Verfahren zur Triangulierung von Linien vorgestellt. Der Ansatz basiert auf der räumlichen Transformation von Plücker-Linien und erlaubt das Einbeziehen von Vorwissen über die zu triangulierende Linie, wie z.B. ihre vorher berechnete Richtung aus dem Clustering paralleler Linien. Aus der Analyse des Problems von degenerierten Konfigurationen wird eine Lösung abgeleitet, die die Informationen vom optischen Fluss des Linienmatching-Verfahrens mit einschließt, indem aus den Flussvektoren räumliche Punkte berechnet werden. Abschließend werden alle vorgestellten Verfahren zu einem visuellen OdometrieSystem für monokulare Kameras kombiniert. Das System berechnet die Bild-zu-BildBewegung der Kamera und bildet daraus die Kameratrajektorie. Eine Skalenanpassung ist notwendig, um die konsistente Skalierung der Trajektorie sicherzustellen. Die dazu entwickelte Methode basiert auf dem Trifokaltensor. Um die Robustheit zusätzlich zu erhöhen, kommt ein Sliding-Window-Bündelblockausgleich zum Einsatz. Alle eingeführten Komponenten und das visuelle Odometrie-System werden anhand echter Daten aus Innenräumen und Außenszenen evaluiert und mit dem Stand der Technik verglichen. Die Auswertung zeigt, dass linienbasierte visuelle Lokalisierung das Lokalisierungsproblem lösen kann.
Abstract Mobile robots must be able to derive their current location from sensor measurements in order to navigate fully autonomously. Positioning sensors like GPS output a global position but their precision is not sufficient for many applications; and indoors no GPS signal is received at all. Cameras provide information-rich data and are already used in many systems, e.g. for object detection and recognition. Therefore, this thesis investigates the possibility of additionally using cameras for localization. State-of-the-art methods are based on point observations but as man-made environments mostly consist of planar and linear structures which are perceived as lines, the focus in this thesis is on the use of image lines to derive the camera trajectory. To achieve this goal, multiple view geometry algorithms for line-based pose and structure estimation have to be developed. A prerequisite for these algorithms is that correspondences between line observations in multiple images which originate from the same spatial line are established. This thesis proposes a novel line matching algorithm for matching under small baseline motion which is designed with one-tomany matching in mind to tackle the issue of varying line segmentation. In contrast to other line matching solutions, the algorithm proposed leverages optical flow calculation and hence obviates the need for an expensive descriptor calculation. A two-view relative pose estimation algorithm is introduced which extracts the spatial line directions using parallel line clustering on the image lines in order to calculate the relative rotation. In lieu of the “Manhattan world” assumption, which is required by state-of-the-art methods, the approach proposed is less restrictive as it needs only lines of different directions; the angle between the directions is not relevant. In addition, the method proposed is in the order of one magnitude faster to compute. A novel line triangulation method is proposed to derive the scene structure from the images. The method is derived from the spatial transformation of Plücker lines and allows prior knowledge of the spatial line, like the precalculated directions from the parallel line clustering, to be integrated. The problem of degenerate configurations
is analyzed, too, and a solution is developed which incorporates the optical flow vectors from the matching step as spatial points into the estimation. Lastly, all components are combined to a visual odometry pipeline for monocular cameras. The pipeline uses image-to-image motion estimation to calculate the camera trajectory. A scale adjustment based on the trifocal tensor is introduced which ensures the consistent scale of the trajectory. To increase the robustness, a slidingwindow bundle adjustment is employed. All components and the visual odometry pipeline proposed are evaluated and compared to state-of-the-art methods on real world data of indoor and outdoor scenes. The evaluation shows that line-based visual localization is suitable to solve the localization task.
Acknowledgement First of all, I want to thank Prof. Bernd Jähne for supervising me, for giving me the freedom to pursue my research interests, and for all the valuable advice and feedback which made the thesis what it is now. Second, I want to thank Pierre Lothe and the whole computer vision for robotics team at Robert Bosch GmbH for providing me with such an inspiring working environment in which I could develop and test my ideas, and for giving lots of valuable feedback in many in-depth discussions. Many thanks also for the effort you put into proofreading papers and this thesis. I also want to express my gratitude to Michael Höynck and Michael Weilkes who made it possible for me to visit the research facility in Palo Alto. I personally learned a lot from this experience. I want to additionally thank Jonas Witt for his supervision and support during that time. Your insight resulted in the thesis evolving especially around the aspect of line matching and the application of line-based visual localization in the automotive domain. Furthermore, I want to thank my fellow doctoral students at Bosch in Hildesheim, especially Moritz and Thomas. I enjoyed all the discussions over lunch, coffee, and tea. It gave me great comfort to know I was not alone in the pursuit of the doctorate. Last but not least, I want to thank my friends and my family who supported me through my whole time of doctoral studies. Thanks for backing my decision to move to Hildesheim and for your patience and understanding when I was buried in work. And most of all I am grateful to Christoph – I love you.
Contents
1. Introduction
1
1.1. Motivation . . . . . . . . . . . . . . . . . . . . . . . . . . . . . . . . . . .
1
1.2. Visual Localization . . . . . . . . . . . . . . . . . . . . . . . . . . . . . .
1
1.2.1. Why Lines? . . . . . . . . . . . . . . . . . . . . . . . . . . . . . .
3
1.3. Outline of Dissertation . . . . . . . . . . . . . . . . . . . . . . . . . . . .
4
1.4. Contributions . . . . . . . . . . . . . . . . . . . . . . . . . . . . . . . . .
6
2. Related Work
8
2.1. Components . . . . . . . . . . . . . . . . . . . . . . . . . . . . . . . . . .
8
2.1.1. Image Processing . . . . . . . . . . . . . . . . . . . . . . . . . . .
9
2.1.2. Multiple View Geometry . . . . . . . . . . . . . . . . . . . . . .
10
2.2. Systems . . . . . . . . . . . . . . . . . . . . . . . . . . . . . . . . . . . . .
13
2.2.1. Visual Odometry . . . . . . . . . . . . . . . . . . . . . . . . . . .
13
2.2.2. Visual SLAM . . . . . . . . . . . . . . . . . . . . . . . . . . . . .
13
2.2.3. Structure from Motion . . . . . . . . . . . . . . . . . . . . . . . .
14
3. Projective Geometry of Lines
16
3.1. Notation . . . . . . . . . . . . . . . . . . . . . . . . . . . . . . . . . . . .
16
3.2. Spatial Line Representation . . . . . . . . . . . . . . . . . . . . . . . . .
17
3.3. Rigid Transformation of Points and Lines in
R3
. . . . . . . . . . . . . .
18
3.4. Projection of Spatial Points and Lines . . . . . . . . . . . . . . . . . . . .
19
3.4.1. Representation of Points and Lines in the Image . . . . . . . . .
20
3.4.2. Pinhole Camera Model . . . . . . . . . . . . . . . . . . . . . . . .
20
3.4.3. Projection of Spatial Points . . . . . . . . . . . . . . . . . . . . .
22
3.4.4. Projection of Spatial Lines . . . . . . . . . . . . . . . . . . . . . .
22
3.4.5. Back-Projection of Image Points and Lines . . . . . . . . . . . .
23
3.5. Distances and Error Functions . . . . . . . . . . . . . . . . . . . . . . . .
25
3.5.1. Reprojection Error . . . . . . . . . . . . . . . . . . . . . . . . . .
26
XI
Contents
I.
Components for Visual Localization
4. Line Matching
28
4.1. Introduction . . . . . . . . . . . . . . . . . . . . . . . . . . . . . . . . . .
28
4.2. Related Work . . . . . . . . . . . . . . . . . . . . . . . . . . . . . . . . .
30
4.2.1. Matching with Local Appearance . . . . . . . . . . . . . . . . .
30
4.2.2. Matching with Local Appearance and Other Constraints . . . .
31
4.3. Optical Flow-based Matching . . . . . . . . . . . . . . . . . . . . . . . .
32
4.3.1. Optical Flow Calculation . . . . . . . . . . . . . . . . . . . . . .
33
4.3.2. Consistency Check . . . . . . . . . . . . . . . . . . . . . . . . . .
34
4.3.3. Histogram-based Line Matching using Optical Flow Vectors . .
36
4.4. Experiments and Evaluation . . . . . . . . . . . . . . . . . . . . . . . . .
37
4.4.1. Matching Test Set . . . . . . . . . . . . . . . . . . . . . . . . . . .
37
4.4.2. Configuration of the Optical Flow-based Matching . . . . . . .
39
4.4.3. Comparison with the State-of-the-Art . . . . . . . . . . . . . . .
40
4.5. Conclusion . . . . . . . . . . . . . . . . . . . . . . . . . . . . . . . . . . .
46
5. Relative Pose Estimation from Lines
47
5.1. Introduction . . . . . . . . . . . . . . . . . . . . . . . . . . . . . . . . . .
47
5.2. Related Work . . . . . . . . . . . . . . . . . . . . . . . . . . . . . . . . .
48
5.3. Rotation Estimation from Spatial Line Directions . . . . . . . . . . . . .
49
5.3.1. Spatial Line Direction Estimation by Parallel Line Clustering . .
50
5.3.2. Spatial Line Direction Matching . . . . . . . . . . . . . . . . . .
53
5.4. Translation Estimation from Intersection Points . . . . . . . . . . . . . .
54
5.5. Robust Relative Pose Estimation Framework . . . . . . . . . . . . . . .
55
5.6. Experiments and Evaluation . . . . . . . . . . . . . . . . . . . . . . . . .
58
5.6.1. Datasets . . . . . . . . . . . . . . . . . . . . . . . . . . . . . . . .
58
5.6.2. Evaluation of Parallel Line Clustering . . . . . . . . . . . . . . .
59
5.6.3. Evaluation of Relative Pose Estimation . . . . . . . . . . . . . .
60
5.7. Conclusion . . . . . . . . . . . . . . . . . . . . . . . . . . . . . . . . . . .
68
6. Triangulation of Lines
XII
27
70
6.1. Introduction . . . . . . . . . . . . . . . . . . . . . . . . . . . . . . . . . .
70
6.2. Related Work . . . . . . . . . . . . . . . . . . . . . . . . . . . . . . . . .
71
6.3. Line Triangulation from the Transformation of Plücker Lines . . . . . .
73
6.3.1. Integration of Spatial Line Direction Priors . . . . . . . . . . . .
75
6.3.2. Triangulation under Degenerate Configurations . . . . . . . . .
77
6.3.3. Pre-Conditioning . . . . . . . . . . . . . . . . . . . . . . . . . . .
80
6.4. Triangulation Framework . . . . . . . . . . . . . . . . . . . . . . . . . .
82
Contents 6.5. Experiments and Evaluation . . . . . . . . . . . . . . . . . . . . . . . . .
84
6.5.1. Qualitative Analysis . . . . . . . . . . . . . . . . . . . . . . . . .
85
6.5.2. Quantitative Analysis . . . . . . . . . . . . . . . . . . . . . . . .
87
6.6. Conclusion . . . . . . . . . . . . . . . . . . . . . . . . . . . . . . . . . . .
89
II. Systems for Visual Localization
90
7. Visual Odometry with Lines
91
7.1. Introduction . . . . . . . . . . . . . . . . . . . . . . . . . . . . . . . . . .
91
7.2. Related Work . . . . . . . . . . . . . . . . . . . . . . . . . . . . . . . . .
92
7.3. Structure of the Visual Odometry System . . . . . . . . . . . . . . . . .
95
7.3.1. Scale Estimation from Trifocal Tensor . . . . . . . . . . . . . . .
96
7.3.2. Reference Image Selection for Scale Estimation . . . . . . . . . .
99
7.3.3. Sliding-Window Bundle Adjustment . . . . . . . . . . . . . . . . 100 7.4. Experiments and Evaluation . . . . . . . . . . . . . . . . . . . . . . . . . 103 7.4.1. Qualitative Analysis . . . . . . . . . . . . . . . . . . . . . . . . . 106 7.4.2. Quantitative Analysis . . . . . . . . . . . . . . . . . . . . . . . . 107 7.5. Conclusion . . . . . . . . . . . . . . . . . . . . . . . . . . . . . . . . . . . 113
8. Conclusion and Outlook
114
8.1. Future Work . . . . . . . . . . . . . . . . . . . . . . . . . . . . . . . . . . 115
Appendices
118
A. Derivation of the Transformation of Plücker Lines
118
B. Derivation of the Projection of Plücker Lines
120
C. Matching Database
122
Abbreviations
126
Bibliography
127
XIII
1. Introduction 1.1. Motivation We live in a time when mobile robots are playing a bigger and bigger part in our daily lives. Fully automated cars will be available which free us up to make use of the time spent commuting. Robot assistants will support us in our daily housekeeping. They will clean the house, mow the lawn and keep our home safe while we are out. In industry, robots will collaborate and work side by side with humans. They will take over tasks which we do not like to do and empower us to focus on the tasks we are really good at. Robots will have countless applications. To fulfill its task, such a robot needs to sense its surroundings, interpret the signals measured and act according to the insights it gained. In the example of navigation where the robot should go from A to B, it needs to acquire information about the distance to nearby obstacles and structures. The measurements are then used to derive the current location of the robot and to assess if obstacles are blocking the way to its target location. A path to the target position is planned by taking all this information into account. This path is then translated into velocity and steering commands which let the robot move along the path. This “sense-think-act” cycle is then repeated until the goal is reached. This thesis is embedded in the “think” phase and focuses on the interpretation of visual cues to derive the robot’s location. Localization using image data is called visual localization.
1.2. Visual Localization Two types of visual localization are commonly distinguished: Global methods comparable to GPS which aim to find the robot’s position “in the world” and relative approaches which reconstruct the robot’s trajectory. This work focuses on the second class which is commonly known as visual odometry (VO). To solve this localization
1
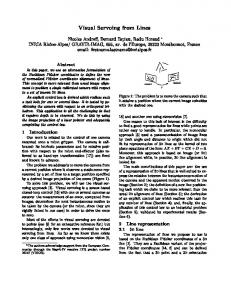
1. Introduction task, several questions have to be answered: What kind of information should be extracted from the images? How can extracted information be related between consecutive frames? And lastly, how can spatial information like the relative displacement between two camera poses be derived from the 2-dimensional image cues? This thesis endeavors to answer all these questions. Since the outcome of the first question greatly influences the way the other questions are approached, it will now be answered for the targeted field of application. This thesis aims to localize in urban indoor and outdoor scenarios, hence it is assumed that the observed scene is structured and mostly follows simple geometry, like the “Manhattan world”, for example, in which the planar and linear structures of the scene are orthogonal to each other (cf. Figure 1.1).
Figure 1.1.: “Manhattan world”. Photo credits: Malinda Rathnayake1 In such structured scenes, it is reasonable to rely on image edges, since according to Lindeberg “a discontinuity in image brightness can be assumed to correspond to a discontinuity in either depth, surface orientation, reflectance or illumination. In this respect, edges in the image domain constitute a strong link to physical properties of the world.” [76]. To make this structural information usable for the high-level task of localization, the edges are abstracted to lines (or more precisely line segments). Unfortunately, most of the research so far has focused on point-based methods. One reason for this is that lines do not constrain the epipolar geometry between two images, making the relative motion estimation a more tedious task. Another reason is 1 https://www.flickr.com/photos/malindaratz/17154124607/
2
1.2. Visual Localization that parametrization of spatial lines is not as straightforward as for points since there is no global minimal parametrization. Additionally, the matching of interest points has reached a mature state, which makes the image association more robust and simplifies the localization problem. Despite this, it is strongly believed that the use of lines is reasonable and should be considered.
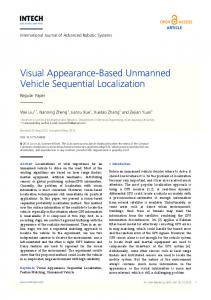
1.2.1. Why Lines? There are several arguments which speak in favor of lines. First of all, lines can provide inherently more structural information compared to points. To emphasize this, the extraction results of an interest point detector and a line detector are shown side by side in Figure 1.2.
(a)
(b)
Figure 1.2.: Interest point detection (a) and line detection (b) on the image in Figure 1.1. It is observed that the scene captured is much easier to understand from the extracted lines than from the extracted points, e.g. the windows are easily recognizable from the lines. On the other hand, almost no lines are detected on the street, whereas many points are found here, which indicates that points and lines highlight different aspects and are complementary. More precisely, points are found in corners and highly textured parts whereas lines reside on edges which separate uniformly colored and therefore less textured areas. Another advantage is that image lines belonging to real structures are more robust against lighting variations since their structure will always be captured as an edge in the image according to the aforementioned relation between edge and physical property. In addition, lines can still provide information when they are partially occluded, which is not possible for points. This valuable property also has a downside:
3
1. Introduction When lines are partially occluded they can be split up into multiple segments and this needs to be modeled into the algorithms, e.g. when lines are matched between images. Regarding the reconstruction of spatial lines, it is possible to impose geometrical constraints on the line, for example restricting the direction to values which concur with the scene geometry. This is not possible with points. To conclude, lines provide very valuable information about the scene geometry, and the desire is to exploit this. Hence, the answer to the first question concerning the image information which should be extracted for the localization task is simply “lines”. Since research on line-based visual odometry has mostly been neglected so far, this thesis wants to address this challenging field and proposes solutions for line-based monocular visual odometry. The solutions proposed here will answer the two remaining questions: How to relate extracted lines between consecutive images and how to then derive the spatial information like camera pose and spatial geometry? The following outline provides more details.
1.3. Outline of Dissertation After this introduction, a general overview on common visual localization components and systems is given in Chapter 2. Besides the presentation of recent developments in visual odometry systems and their components, the important work in the related technologies “visual simultaneous localization and mapping” (vSLAM) and “structure from motion” (SfM) is briefly highlighted. Chapter 3 explains important basic concepts which are required throughout the thesis. First, the Plücker representation of spatial lines is introduced. A detailed explanation of how rigid transformations are applied to Plücker lines is given and, the projective properties of lines are derived using the knowledge of projective geometry of points. The subsequent chapters are divided into two parts: First, components for line-based visual localization are presented. A component is a basic algorithm required for visual localization. A localization system is then built through a meaningful combination of multiple components. The second part focuses on such systems. The components are presented in the order in which they appear in the localization system.
4
1.3. Outline of Dissertation In Chapter 4, a new line matching algorithm for matching under small baseline motion is presented. The matches from the first image to the second image are established utilizing optical flow vectors which are calculated along the line segments. The optical flow vectors are first filtered so that only vectors which satisfy “appearance” and “consistent motion” constraints are retained. A simple histogram-based algorithm is then used to assign the flow vectors to lines in the second image. The matches are then extracted from this histogram. In extensive tests, the algorithm is first tuned to best performance and then compared to state-of-the-art line matching algorithms. It is demonstrated that the method proposed performs better with similar execution times. In Chapter 5, the relative pose estimation problem using lines is tackled. Generally, the relative pose cannot be recovered from line observations in two views. But since this work operates in structured scenes, this prior knowledge can be incorporated into the estimation and the relative pose problem can be solved under the constraints imposed. Methods previously presented used the “Manhattan world” assumption in which the lines observed must be orthogonal in space. The method proposed here softens this strict assumption since it is only assumed that spatial lines with different directions are observed. The angle between the directions is not relevant. The direction information is extracted through a clustering step of parallel lines and then used to retrieve the relative rotation component between the two views. Knowing the rotation, the translational component is calculated from intersection points. The method proposed here is then compared to state-of-the-art methods using points and lines. Although the pose estimated here is slightly less precise than the estimate from the state-of-the-art line-based method, the method used in this work is of the order of one magnitude faster and hence better suited for localization tasks. In Chapter 6, a new linear triangulation method is derived from the Plücker line representation and its projective properties. This approach allows prior knowledge about the spatial line direction to be incorporate into the triangulation process, which is very useful for structured scenes. A new method to triangulate lines which are in degenerate configuration is also presented. Here, the optical flow points are incorporated into the triangulation process, thus making it possible to retrieve a spatial line. Finally, a triangulation framework is presented which combines the different aspects presented. This framework is then evaluated and compared to standard line triangulation. In Chapter 7, the components previously discussed are combined to form a visual odometry system for monocular cameras. First, line matches are found using the line
5
1. Introduction matching method presented. Then, the frame-to-frame motion is estimated using the relative pose algorithm presented. To maintain a consistent trajectory, the scale between the consecutive relative displacements needs to be adjusted. A new scale adjustment scheme is introduced which is based on the trifocal tensor. In a last step, sliding-window bundle adjustment is applied to optimize the calculated trajectory. This pipeline is then tested and compared to a state-of-the-art pipeline. The thesis concludes in Chapter 8, which summarizes the results and gives an outlook on possible future work.
1.4. Contributions The scientific contributions of this thesis are in the domain of visual localization using lines. The thesis proposes: • a novel line matching algorithm for small baseline motion based on optical flow which inherently handles one-to-many matches to deal with different line segmentation (Chapter 4). • a relative pose estimation framework which extracts the spatial line directions from the image data using parallel line clustering and which allows a very efficient relative rotation calculation (Chapter 5). • a new triangulation framework which can incorporate prior spatial line direction information and handles degenerate configurations (Chapter 6). • a line-based visual odometry pipeline for monocular cameras which is based upon the components developed and which leverages their by-products to create synergies, for example by reusing the estimated line directions from the relative pose estimation as prior line triangulation information (Chapter 7). Large parts of Chapter 4 and 5 have been previously published in • N. von Schmude, P. Lothe, and B. Jähne. Relative Pose Estimation from Straight Lines using Parallel Line Clustering and its Application to Monocular Visual Odometry. In International Conference on Computer Vision Theory and Applications, pages 421–431, 2016. doi:10.5220/0005661404210431. [111] • N. von Schmude, P. Lothe, J. Witt, and B. Jähne.
Relative Pose Estimation
from Straight Lines Using Optical Flow-based Line Matching and Parallel Line
6
1.4. Contributions Clustering. In Computer Vision, Imaging and Computer Graphics Theory and Applications, Communications in Computer and Information Science. Springer, to be published. [112] Lastly, all algorithms developed are fully integrated into the internal research framework for visual localization of Robert Bosch GmbH and are ready to be used for future research and product development.
7
2. Related Work This chapter aims to give a brief overview of visual localization and mapping techniques in general and more specifically of approaches which use lines. Visual localization and mapping systems like visual odometry, visual SLAM or structure from motion share a common set of image processing and multiple view geometry (MVG) algorithms. Besides the different targets, the difference between these pipelines lies in the combination and selection of the common algorithms. As the naming convention and meaning of the various methods is rather fuzzy, this thesis defines visual odometry, visual SLAM and SfM as follows: Visual Odometry VO is a dead reckoning system which updates the pose of a moving camera with respect to the previously calculated pose on the fly. As a dead reckoning system, VO is susceptible to drift accumulation. VO is not interested in a reconstruction of the scene, only the camera pose is relevant. Visual SLAM vSLAM estimates the pose of a moving camera on the fly, as does VO. But it is not a dead reckoning system and therefore does not suffer from drift accumulation as a consistent global map is maintained (e.g. through detection and closing of loops and global bundle adjustment). Thus, vSLAM is understood as an extension of VO. Structure from Motion Whereas VO and vSLAM focus on the generation of the camera’s trajectory, SfM focuses on the reconstruction of the scene structure. SfM is an offline process in which all images are available from the beginning. In addition, it is not necessary that the images are ordered or originate from the same camera.
2.1. Components In the following, the different image processing and multiple view geometry algorithms are briefly introduced.
8
2.1. Components
2.1.1. Image Processing Normally, the image processing algorithms are executed first and serve to extract information (e.g. point features and feature matches) from the image data which is then used to recover motion or structure information from the scene observed. Recently, the distinction between image processing and multiple view geometry has become more and more unclear as direct methods omit the feature extraction step and derive geometry directly from pixel intensities, e.g. [25, 26, 36, 57].
Image Features and Matching The feature extraction starts with the detection of salient image regions. These could be edges, corners or blobs. These detected regions and their local neighborhood are then used to generate a descriptive feature vector which serves to uniquely describe the image region and to allow matching between multiple images. The image region together with the descriptor form the feature. For point features, corners or blobs are usually used. Popular examples for corner detectors are the Harris corner detector [43], Shi and Tomasis’ “Good features to track” [100] or FAST corners [95]. Well known blob detectors are MSER [83] and the detector parts of SIFT [79] and SURF [6] features. The corners or blobs extracted are then augmented with a descriptor. A distinction can be made between scalar valued descriptors and the more recent binary descriptors, which use the Hamming distance to achieve much faster matching. SIFT [79] and SURF [6] are well-known features which use scalar valued descriptors, whereas BRIEF [12], BRISK [75] and ORB [96] use binary descriptors. SIFT is still one of the best performing features with respect to matching but is computationally quite expensive, which often makes it unsuitable for online systems, where the binary features are then preferred. Point feature matching is usually performed by comparing the different descriptors and selecting the feature which is most similar. To robustify the matching further, methods like thresholding the descriptor distance or comparing the distance ratio between the two closest candidates [79] are used. Regarding line features, the detection of lines is based on edges (e.g. the Canny edge detector [13] or structure tensor [70]). Lines (or line segments) are then extracted from the edges using a Hough transform [21] or the Douglas-Peucker algorithm [20], for example. Frequently used line segment detectors are LSD [110] and EDLines [2]. Several line descriptors like MSLD [115], LEHF [52] or LBD [122, 123] exist but
9
2. Related Work line descriptors alone do not perform very well at matching as the local neighborhood of a line is normally not very distinct. Several methods have been proposed which augment line matching with other constraints to increase the matching performance. Proposed matching constraints are geometric constraints (e.g. epipolar geometry [98]), topological constraints [5, 123, 114] or point features [30, 31, 61, 62]. A more detailed introduction to existing line features and line matching algorithms is given in Chapter 4 alongside an introduction to the optical flow-based line matching scheme proposed in this work. All the features presented so far were designed manually. Owing to recent progress in machine learning (e.g. deep learing) and the availability of high-performance computational resources (e.g. GPUs), automatic feature learning is now becoming feasible [72, 121].
Other Image Processing Algorithms Other image processing algorithms related to localization and mapping are optical flow and stereo algorithms. An optical flow algorithm estimates the pixel motion between consecutive images. There are sparse methods which estimate the flow vector for certain features (e.g. the well-known Lucas-Kanade method [80, 11]), and dense methods which calculate a flow vector for every pixel in the image (e.g. Farnebäck’s method [32] or TV-L1 flow [120]). Stereo algorithms try to estimate the disparity of each pixel in a stereo camera setup to recover the pixel depth. A widely used stereo algorithm is SGM [53]. In recent years, combinations of optical flow and stereo algorithms have been published to recover both dense geometry and motion (e.g. 3D scene flow [109]). Optical flow is used in Chapter 4 but is otherwise outside the scope of this thesis. Stereo algorithms are also not covered further as the focus lies on monocular cameras.
2.1.2. Multiple View Geometry Once features are extracted and matched, the different multiple view geometry algorithms are applied to recover the motion and structure information of the scene observed. Three classes of MVG algorithms can be distinguished: 2D-2D algorithms
10
2.1. Components which rely on image information from different views only (e.g. homography estimation), 2D-3D algorithms which combine already recovered 3-dimensional structure or pose information with image data (e.g. perspective-n-point problem), and 3D-3D algorithms which are based solely on already recovered spatial data (e.g. alignment of point clouds).
2D-2D Algorithms The epipolar geometry, which describes the projective relation between two images, is recovered from corresponding feature points. Common approaches to calculating the fundamental (or essential) matrix are the 8-point algorithm [78, 46] and the 5point algorithm [91]. If the feature points in both images originate from coplanar spatial points, the homography which maps the points from one image to the other can be derived using a direct linear transform (DLT) [48]. The relative pose between the two cameras is then extracted from the essential matrix or homography. Note that it is not possible to calculate the relative pose between two views from lines alone unless further constraints are imposed [116]. Under the “Manhattan world” assumption, Elqursh and Elgammal [24] derive a line-based relative pose algorithm. More details on relative pose estimation with lines are given in Chapter 5. If point or line features correspond across three views, the trifocal tensor is utilized. The trifocal tensor is an extension of the fundamental matrix to three views and encodes the projective relation between three cameras [45, 48].
2D-3D Algorithms Triangulation methods estimate the 3-dimensional structure from corresponding image features and given camera poses. Feature correspondences must be given for at least two views. Different closed-form or iterative algorithms for points and lines exist. The standard linear approach for points is given in [44] and the “mid-point” approach in [8]. Optimal solutions for points are presented by Hartley and Sturm [47] and Josephson and Kahl [60]. Josephson’s method finds the optimal solution iteratively and works for lines and conics, too. Hartley and Zisserman [48] present a linear triangulation method for lines. Bartoli and Sturm [4] name several linear and iterative line triangulation methods based on Plücker lines. A more detailed overview of line triangulation is given in Chapter 6.
11
2. Related Work When the spatial structure is known or already estimated, observations of the structure are used to derive the camera pose with respect to the scene. When using points, this task is called the “perspective-n-point” (PnP) problem [34] where n defines the number of point correspondences used. In photogrammetry, this problem is also known as “camera resection”. At least three correspondences are required to obtain a pose estimate, therefore this problem using the minimum required 3 points is also known as P3P. Recent progress on PnP is reported by Ferraz et al. [33], for example. An efficient solution for P3P is given by Kneip et al. [66]. The first pose estimation algorithm for lines was presented by Liu et al [77]. They introduce a linear and a non-linear method where the linear approach requires eight 2D-3D correspondences whereas the non-linear method needs three. As for points, at least three line correspondences are necessary to solve the pose. In analogy with PnP, this class of algorithms is named the “perspective-n-line” problem (PnL). Recent work on PnL and P3L algorithms is presented in [125, 119]. Line-based pose estimation is not covered by this thesis. So far, algorithms using multiple observations from the same spatial entity (triangulation) and methods using multiple spatial entities and their observation in one image (pose estimation) have been covered. Next, an algorithm which operates on multiple camera poses, multiple spatial entities and their observations in the images is introduced: Bundle adjustment. Bundle adjustment is a nonlinear method which aims to optimize given structure and camera poses simultaneously using the observations in the images. Bundle adjustment is well known in the photogrammetry community. An overview of bundle adjustment in the computer vision context is given by Triggs et al. [107]. A suitable line parametrization for the update step for line-based bundle adjustment – called the orthonormal representation – is given in [4]. A representation based on the Cayley transform is presented in [124]. Bundle adjustment with lines is covered in Chapter 7.
3D-3D Algorithms Alignment or registration methods try to find the transform which maps one set of spatial entities to another. It is used for pose estimation from stereo or RGB-D data, for example, where point clouds from different camera views need to be aligned. A classic linear least squares approach is Horn’s method [58] which requires known correspondences between the points. If no correspondences are given, iterative closest points (ICP) must be used [10, 14]. Recent progress on ICP is presented in [9]. For
12
2.2. Systems lines, Witt and Weltin develop the ICML algorithm [118] as the counterpart to ICP. Alignment of spatial entities is also outside the scope of this thesis.
2.2. Systems As the basic building blocks for localization and mapping have now been introduced, different systems can be realized by combining these components. An overview of visual odometry, vSLAM and structure from motion pipelines is given in the following.
2.2.1. Visual Odometry First research on camera motion estimation using image input was done in the context of the Mars rover robots [87, 84, 94] which resulted in VO being actively used on the two rovers Spirit and Opportunity [81]. This early work focused on stereo systems where the motion was estimated using 3D-3D alignment methods, as presented above. Nister et al. [92] present the first monocular visual odometry system which relies on solving the P3P problem between consecutive frames. A popular open source visual odometry pipeline for both monocular and stereo cameras is LIBVISO21 [63, 39]. In recent years, direct methods which estimate the pose by minimizing the photometric error between consecutive frames have become more and more popular. Forster et al. [36] present a semi-direct monocular VO system called “SVO” and Engel et al. [25, 28] purely direct methods. A line-based visual odometry pipeline for stereo cameras is presented by Witt and Weltin [118, 117]. Recently, Holzmann et al. [57] presented a semi-direct VO system based on lines which is inspired by SVO. A more in-depth discussion and the introduction of the line-based visual odometry method for monocular cameras proposed in this thesis are given in Chapter 7.
2.2.2. Visual SLAM SLAM is a widely known problem from the robotics community [106]. Typical solutions involve probabilistic filters like the Kalman filter and its variants (EKF, UKF) 1 http://www.cvlibs.net/software/libviso/
13
2. Related Work or particle filters. The first monocular vSLAM systems adapted these filter-based methods to the computer vision context, e.g. the well-known MonoSLAM [16, 17] by Davison et al. which is based on EKF, or the FastSLAM-based method (particle filter) of Eade and Drummand [23]. A different approach to tackling the vSLAM problem comes from the structure from motion community where, instead of filtering methods, optimization techniques like bundle adjustment are used to fuse together information from several images. To reduce the memory consumption required for storing images and landmarks, keyframes are normally selected from the input image stream. One of the first keyframebased bundle adjustment vSLAM system was PTAM [64]. Strasdat et al. [103] compare both filtering and keyframe-based bundle adjustment methods and conclude that bundle adjustment is favorable as it gives “the most accuracy per unit of computation time”. This is why filter-based methods are no longer used nowadays. A modern vSLAM pipeline is ORB-SLAM from Mur-Artal et al. [90, 89] which can be used with monocular, stereo and RGB-D cameras. A modern direct vSLAM pipeline is LSD-SLAM by Engel et al. [26, 27]. The first steps towards line-based vSLAM were taken by Eade and Drummand [22] as they introduced “edgelets” – small line segments – to filter-based vSLAM. The concept of edgelets was later also used in PTAM to improve the stability under fast motion [65]. EKF-based vSLAM systems are extended by line segments and Plücker lines in [101, 74]. Hirose et al. present another vSLAM system [52] which employs line feature matching for 2D-3D line association. Lee et al. [73] present a line-based place recognition for loop closure detection. vSLAM is not further covered by this thesis.
2.2.3. Structure from Motion In the last decade, research on structure from motion was mainly driven by the availability of vast photo collections in the internet e.g. Flickr. Snavely et al. [102] proposed a first SfM pipeline which was able to reconstruct popular sites from several thousand images. This work was later extended by Agarwal et al. [1] to reconstruct whole cities from over a hundred thousand images, and by Heinly et al. [49] to recover the whole world from millions of images. Interestingly, the approach of Agarwal et al. runs on several machines in the cloud whereas for the approach of Heinly et al., one powerful PC is sufficient despite the much higher image input. One major task in SfM is the
14
2.2. Systems detection of image overlap in unordered datasets. Schönberger et al. [99] systematically analyze the different methods and developed a novel learning-based method to retrieve matching images from the insights gained. A point-based SfM pipeline can be extended to reconstruct lines as well. A common approach is to derive the camera poses from a point-based SfM pipeline and to use the knowledge of the camera poses to reconstruct lines. Jain et al. [59] follow this idea and propose a line sweeping algorithm to find the spatial line which fits best to line observations in nearby cameras without explicit line matching. Hofer et al. [54, 55, 56] continue this work and propose the use of epipolar geometry to produce possible match hypotheses which are then triangulated and verified by projection in neighboring views. Micusik and Wildenauer [85] present a purely line-based SfM pipeline which bootstraps the reconstruction by exploiting the trifocal tensor and pre-computed rotations from vanishing points. A new image is added to the reconstruction without explicit descriptor matching of the lines. Instead, they use the pre-calculated rotation to sample possible poses and compare the virtual image of the sample pose to the real one. The virtual view with the best fit is then used to derive the matches from which the absolute pose is estimated. Zhang and Koch [124] also use the trifocal tensor to initialize the reconstruction, but they use line-matching and employ PnL directly to estimate the camera’s pose. Structure from motion is outside of the scope of this thesis and will not be covered further.
15
3. Projective Geometry of Lines This chapter introduces the basic concepts and notations of this thesis. The focus is on the projective geometric properties of lines. First, Section 3.2 introduces Plücker lines as the spatial line representation on which every derivation is based. Then, the rigid transformation of lines is described (Section 3.3), and projection and back-projection, which relate lines in 3-space to line observations in the image plane, are explained (Section 3.4). In Section 3.5, common distance and error functions are presented.
3.1. Notation The mathematical nomenclature used throughout this thesis is summarized in Table 3.1. Table 3.1.: Mathematical nomenclature Entity
Symbol
Scalars Vectors Vector components Matrices Transpose of vector / matrix
italic: a, b, c, . . . bold italic: a, b, c, . . . point p = (px , py , pz )T bold, upper case: A, B, C, . . . aT , AT
Spatial line Spatial entity defined in coordinate frame f Rigid transform in R3 from frame s to t
L Preceding superscript, e.g. f p for points tsT , for lines tsTL
Camera calibration matrix Projection matrix Entity in image
K for points P, for lines PL With subscript i, e.g. point pi or line l i
Index of entity
Superscript in brackets, e.g. ∑ j pi ( j) 0 − pz py 0 − px q p × q = [ p]× q = pz − py p x 0
Cross product in matrix notation
16
3.2. Spatial Line Representation
3.2. Spatial Line Representation In the following, there is a brief introduction to the Plücker line representation, which is used throughout the thesis. A more thorough introduction is given by Hartley and Zisserman [48], Heuel [50] and Bartoli and Sturm [4]. The Plücker representation is complete and allows lines at infinity to be represented. Additionally, it is homogeneous which means that multiplication with a scalar describes the same line:
L = λL with λ ∈ R \ {0}
(3.1)
A distinction is made between two forms of Plücker representations: The Plücker coordinate and the Plücker matrix. Both define the line L by means of two 3-vectors: The line’s momentum m and its direction d. The momentum has a geometrical interpretation: It is the normal vector of the plane spanned by the origin of the coordinate system and the line itself. It follows that momentum and direction must be orthogonal, which is called the “Plücker constraint” (cf. Figure 3.1): mT d = 0
(3.2)
A line with d = 0 is at infinity whereas a line with m = 0 contains the origin. The Plücker coordinate is simply the 6-vector formed by stacking momentum and direction vectors: ! m L= d And the Plücker matrix is defined as ! − [m]× −d . L= dT 0
(3.3)
(3.4)
The coordinate representation has the advantage that rigid transformation and projection onto an image can be defined as linear functions. Using Plücker matrices, the transformation and projection become quadratic but allow the reuse of the expression for the transformation and projection of points, which will be discussed in the following sections. A line is uniquely defined by two 3-dimensional points p and q, where momentum
17
3. Projective Geometry of Lines and direction are calculated as follows: m = p×q
(3.5)
d = q−p
(3.6)
The Plücker matrix can alternatively be calculated from p and q as
L=
p 1
!
�
qT
�
1 −
q
!
1
�
pT 1
�
.
(3.7)
Since Plücker coordinate and Plücker matrix are homogeneous representations, a normalization function ν(L) can be defined which maps all Plücker coordinates or matrices representing the same spatial line to a single coordinate or matrix: ν(L) =
L kdk
(3.8)
The line L and its components are visualized in Figure 3.1.
L p
d q
m
o Figure 3.1.: Visualization of the Plücker line and its components.
3.3. Rigid Transformation of Points and Lines in R3 A spatial point s p defined in the source reference frame s is transformed to another coordinate system — the target frame t — by applying a Euclidean transformation
18
3.4. Projection of Spatial Points and Lines where tsR ∈ SO(3) is a rotation matrix and tt s ∈ R3 a translation vector: t
p = t sR s p + tt s
(3.9)
Extending the expression to homogeneous point coordinates yields a transformation matrix tsT ∈ SE(3): tp
! t
= sT
1 tp
!
! (3.10)
1 !
sR
tt
0 1×3
1
t
=
1
sp
s
sp
! (3.11)
1
The point transformation matrix tsT is used to transform lines in Plücker matrix notation: t
� � − tm × t T
d
T
L = t sT sL t sT ! ! ! s t R tt sm t R − td − − d [ ] s s s × = s T 0 1×3 1 d 0 0 1×3 0
(3.12) tt
!T s
1
(3.13)
For the transformation of Plücker coordinates from the source reference frame to the target reference frame it is necessary to define the transformation matrix tsTL : t
L = t sT L sL ! �t � t ! tm t R t s × sR s = t t R d 0 3×3 s
(3.14) sm s
!
d
(3.15)
As mentioned before, this expression is now linear whereas the equation for Plücker matrices is quadratic. The transformation equations for Plücker matrices and Plücker coordinates are derived in Appendix A.
3.4. Projection of Spatial Points and Lines This section presents a summary of the representation of points and lines in the image and how spatial points and lines are projected onto images.
19
3. Projective Geometry of Lines
3.4.1. Representation of Points and Lines in the Image Image points and lines are represented as homogeneous vectors in P2 . The image point pi = ( pix piy piz )T encodes the pixel coordinates in the image. The pixel location is calculated by normalizing the point to its unambiguous representation, i.e. dividing it by the last vector component: ν ( pi ) =
pi pi z
(3.16)
The vector l i = ( lix liy liz )T defines a line in the image plane if and only if every image point pi on the line fulfills l i T pi = 0 .
(3.17)
As in 3-dimensional space, an image line is uniquely defined by two points pi and qi . The line which contains these points is formed by the cross product of pi and qi : l i = pi × qi
(3.18)
Similarly, the intersection point pi of two lines l i and mi is calculated as pi = l i × mi .
(3.19)
As is the case with the homogeneous representations introduced previously, a normalization can be defined which maps every homogeneous line vector representing the same line to a unique representation: ν(l i ) = q
li l2ix
+ l2iy
(3.20)
3.4.2. Pinhole Camera Model A camera captures a 3-dimensional scene on a 2-dimensional image. The process of mapping spatial structure to the image plane is called camera projection. The simplest model for projection is the pinhole camera model. It assumes that all light rays meet at one point: The camera center. The image pi of a spatial point
wp
is
then located at the intersection of the image plane and the light ray. The focal length defines the distance of the image plane to the camera center. The intersection point of
20
3.4. Projection of Spatial Points and Lines the z-axis (also called principal axis) and the image plane is called the principal point ci . The pinhole camera projection is visualized in Figure 3.2. x z
pi
y f ci
wp
Figure 3.2.: Visualization of the pinhole camera model. The spatial point w p and any other point on the ray is projected to the point pi on the image plane. ci is the principal point, this is the intersection of the z-axis of the cameracentered coordinate frame (“camera center”) and the image plane. The focal length f defines the distance between camera center and image plane.
The pinhole camera projection is mathematically described with a camera calibration matrix K, which is defined by focal length and principal point (cf. [48]):
fx
K = 0 0
0
ci x
f y ciy 0 1
(3.21)
If the camera center coincides with the origin of the world coordinate system, the projection from a spatial point to the image is then defined by means of (cf. [48]) pi = K w p
(3.22)
This model has its limitations of cause. The pinhole camera does not consider lens distortions or other effects from the imaging process. These effects could also be modeled, with distortion coefficients, for example [41]. When the distortion parameters are known (e.g. through a camera calibration), the image is corrected to remove the distortion effects. The pinhole camera model then holds. In this thesis, it is assumed that the images are distortion free and that the pinhole camera model is applicable.
21
3. Projective Geometry of Lines
3.4.3. Projection of Spatial Points As the representation of image lines and points and the pinhole camera have now been introduced, the projection of spatial entities to the image is now explained. The projective mapping P of a spatial point w p to its image pi on the image plane with camera frame at pose wp
pi = P pi = K
c
wT
is given by (cf. [48])
! (3.23)
1 �
c
ct
wR
�
wp
w
! (3.24)
1
with K the camera calibration matrix. This expression is rewritten using the previously defined transformation matrix wp
pi = P
=K
c
wT :
! (3.25)
1 �
c
ct
wR
�
= K 03×1 = K P c wT
�
wp
w
�
wp
! (3.26)
1 c
!
wR
ct
0 1×3 !
1
w
wp
!
1
1
(3.27) (3.28)
First, the spatial point is transformed from the world coordinate system w to the local coordinate system of the camera c. Then, this resulting point c p is projected on the image plane using the calibration matrix K P .
3.4.4. Projection of Spatial Lines The projection of a line wL onto the image plane is now introduced. For lines in Plücker matrix representation, the projection is based – in analogy with the transformation of lines in Plücker matrix form – on the projection of points.
[ l i ] × = P wL PT
22
(3.29)
3.4. Projection of Spatial Points and Lines This is a quadratic expression. For a linear expression, Plücker coordinates must be used. The same schematic as for points is followed and the projection matrix PL for Plücker coordinates is decomposed into the camera calibration matrix part and the transformation part: l i = P L wL
(3.30)
= K L c wT L wL � � = det(K)K−T 03×3
(3.31) c
wR
0 3×3
[ ct w ] × c wR c R w
!
wm w
! (3.32)
d
First, the line wL is transformed to the local coordinate system of the camera c and then projected on the image plane. Taking a closer look at this equation, it becomes evident that only the momentum of the line cL in the camera frame determines the projection: �
l i = det(K)K−T 03×3
�
� � = det(K)K−T 03×3
c
wR
0 3×3 ! cm c
[ ct w ] × c wR c R w
!
wm w
!
d
d
= det(K)K−T cm
(3.33) (3.34) (3.35)
Again, the correctness of this expression is proven in Appendix B.
3.4.5. Back-Projection of Image Points and Lines The projection of points and lines from 3-space to an image has now been explained. The reverse process is now considered: The “back-projection”. The back-projection (sometimes also called the “pre-image”) describes all spatial points which give rise to the same image. For an image point, the back-projection consists of all points along the ray formed by the camera center and the spatial point observed. For an image line, the pre-image is the plane spanned by the spatial line observed and the camera center. The back-projection of image points and lines is visualized in Figure 3.3. How is the back-projection computed from the observation in the image? The direction cu of the ray in camera coordinates for image point pi is given as (cf. [48]) c
u = K −1 p i
(3.36)
23
3. Projective Geometry of Lines cr
cL
cu c
pi
co
d
cπ cn
li
Figure 3.3.: Visualization of the back-projection of an image line l i and an image point pi . cπ is the back-projected plane of l i with normal vector cn . The observed spatial line cL has line direction cd . The back-projected ray cr has direction cu . The complete ray cr is then c
r = 03×1 + λ cu .
(3.37)
This translates to the ray wr in world coordinates w
r = wc + λ wu
= − c wR T ct w + λ c wR T cu .
(3.38) (3.39)
Here, wc is the camera center expressed in the world coordinate frame. The back-projected plane wπ of an image line l i is calculated using the projection matrix P of points (cf. [48]): w
π = PT l i
(3.40)
Here, wπ is the parameter expression of the plane. In analogy with the expression of image lines, its interpretation is that wπ defines a plane if and only if every point w p on the plane fulfills: w
πT
wp
1
!
=0
(3.41)
The first three entries of wπ encode the normal vector wn of the plane. It follows that
24
3.5. Distances and Error Functions the normal cn of the back-projected plane cπ is c
n = KT l i
(3.42)
3.5. Distances and Error Functions Throughout the thesis, several distance measures and error functions are used which will now be presented. Given two vectors v and w, the signed angular distance δ (v, w) ∈ [0; π ] between these vectors is defined as � � vT w δ (v, w) = arccos (3.43) kvkkwk In the same way, it is possible to define the unsigned angular distance δu (v, w) ∈
[0; π2 ] which ignores the orientation of the vectors: � � vT w δu (v, w) = arccos kvkkwk
(3.44)
The minimal perpendicular distance from an image point pi to an image line l i is defined as d ( l i , p i ) = ν ( l i )T ν ( p i ) .
(3.45)
The distance of a spatial line L in Plücker representation to the origin is do (L) =
kmk kdk
(3.46)
In fact, for homogeneous entities e like points, lines or planes, the distance to the origin is always the norm of the Euclidean part ee divided by the norm of the homogeneous part eh (cf. [50]): do (e) =
kee k keh k
(3.47)
The minimal distance between two spatial lines L(i) and L( j) is defined as the mini-
25
3. Projective Geometry of Lines mal distance between any two points along the lines:
� � n o
d L(i) , L( j) = min p(i) − p( j) with p(i) ∈ L(i) and p( j) ∈ L( j)
(3.48)
3.5.1. Reprojection Error The reprojection error $ is defined as the error between the measured observation in the image and the projected spatial entity onto the image. For points, the simplest way to calculate the reprojection error is to use the Euclidean distance between observed point pi and projected point P w p : $ ( pi , P, w p ) = kν ( pi ) − ν (P w p )k
(3.49)
For lines, the point-line distance between the endpoints of the observed line segment and the projected spatial line is used as the error function. As the line segment has two endpoints pi and qi , the point-line distance to both points is calculated and the sum of the squared distances is used as the reprojection error: $ ( p i , q i , P L , wL ) = d ( P L wL , p i )2 + d ( P L wL , q i )2
26
(3.50)
Part I.
Components for Visual Localization
4. Line Matching 4.1. Introduction Matching aims to bring image regions in different images from the same scene into correspondence. Being able to find matches is a prerequisite for many computer vision algorithms, e.g. for disparity estimation of stereo cameras, for object recognition, and of course for localization and reconstruction tasks. What is normally done in the localization context is that interest points are detected and augmented by a descriptor vector to form a feature. The descriptor vector is generated from the image patch around the interest point and encodes the peculiarity of this region. For matching, the descriptors are then compared (e.g. by calculating the L2 -norm or the Hemming distance) and the most similar descriptor is accepted as the match. Different features are employed depending on the application: SIFT [79], which is invariant to scaling and rotation, is often used in structure from motion, where correspondences in unordered images are needed and the computation time is not of high priority [102, 1]. In applications which require real-time performance, e.g. visual SLAM, more lightweight features like ORB [96] are employed [90, 89]. Regarding the matching of lines, many of the algorithms proposed imitate the pointbased feature approaches. They try to describe the local neighborhood of a line segment and to match the resulting descriptors [115, 52, 123]. All these methods share the problem that they are limited to minor image changes, e.g. variations resulting from small camera displacements (“small baseline motion”), as lines are found at the border of two homogeneous regions and hence the neighborhood of a line segment is inherently not discriminative. This fundamental characteristic is visualized in Figure 4.1. To circumvent this, methods that include other constraints like topology or geometry were proposed [98, 5, 114]. Another peculiarity of lines is that their segmentation may vary between images, e.g. due to occlusion. This property must be taken into account during matching but this
28
4.1. Introduction
Figure 4.1.: Line segments separate homogeneous image regions. The surrounding neighborhoods are hence similar looking and the extracted descriptors not discriminative. is rarely done in the literature. This thesis therefore proposes a new line matching strategy for matching under small viewpoint changes which explicitly allows one-tomany matches to compensate for differences in line segmentation. As this method is based on optical flow, no further descriptor calculation is needed, making this approach lightweight and fast to compute. The contributions of this work are: • a lightweight optical flow-based line matching method for small baseline motion • explicit one-to-many matching to take the variation in line segmentation into account • extensive evaluation and comparison to descriptor-based line matching methods Large parts of this chapter have been published previously in [112]. The chapter is structured as follows: First, related work is presented in Section 4.2. In Section 4.3, the proposed optical flow-based line matching method is described in detail. The method presented here is compared to other state-of-the-art descriptorbased approaches and its performance is evaluated in Section 4.4. The chapter concludes with Section 4.5.
29
4. Line Matching
4.2. Related Work The problem of finding the same spatial line in multiple images has been studied for decades in the computer vision community. The matching algorithms proposed can be separated into two groups: The first group contains algorithms which use local appearances only, and the second group consists of matching approaches which additionally employ further constraints.
4.2.1. Matching with Local Appearance
Prominent examples for matching using local appearance are “Mean Standard Deviation Line Descriptor” (MSLD) [115], “Line-based Eight-directional Histogram Feature” (LEHF) [52] and “Line Band Descriptor” (LBD) [122, 123]. These approaches follow the idea of describing the local neighborhood of a line segment by analyzing its gradients and condensing their information into a descriptor vector. In the matching process, the descriptors are compared and the most similar descriptor decides the match. Often, techniques like thresholding the descriptor distance, “Left/Right Checking” (LRC) or “Nearest Neighbor Distance Ratio” (NNDR) are employed to robustify the matching. LRC ensures that the matching is symmetrical by only accepting matches where matching from “left” image to “right” image gives the same result as matching from “right” to “left”. LRC therefore handles occlusions. NNDR is known from SIFT feature matching [79] and follows the idea that the descriptor distance for a correct match should be significantly smaller than the distance to the closest incorrect match. As local neighborhoods of different lines are often not distinguishable (cf. Figure 4.1), the resulting descriptors are similar and therefore not suitable for matching under extreme viewpoint changes. Explicitly designed for the tracking of lines in image sequences are the approaches proposed by Deriche and Faugeras [19] and Chiba and Kanade [15]. Deriche and Faugeras propose a Kalman filter for predicting the geometry of the line segment in the next image, whereas Chiba and Kanade use optical flow for the prediction. Both approaches define a similarity function using only the geometry of the image line to associate the prediction with an observation. They argue that geometry is sufficient for the matching as the changes between consecutive image frames are small.
30
4.2. Related Work
4.2.2. Matching with Local Appearance and Other Constraints Another group of matching techniques includes additional constraints to overcome the problem of the indistinctiveness of the local appearance of lines and hence the restriction to small baseline matching. Schmid and Zisserman [98] propose the use of epipolar geometry to reduce the search space to the “epipolar beam” of the line segment and to guide the computation of a cross-correlation score. A drawback of this method is that the epipolar geometry has to be known beforehand. Bay et al. [5] introduce a matching scheme which does not suffer from the need for epipolar geometry. The matching consists of multiple stages: First all possible matches from an appearance-based matching are generated and then filtered using a topological constraint. With line pairs and triplets, this “sidedness constraint” describes how they are arranged spatially. In the last step, further matches are added if they agree with the current topological structure. Zhang and Koch [122, 123] follow a similar idea. First, LBD descriptor matching is employed to generate candidate matches. Second, a relational graph is created to capture the global consistency of the matches. The graph contains all candidate matches as vertices and the edges linking the vertices are weighted with a consistency score computed from the pairwise geometric and appearance similarities of the corresponding matches. A spectral technique is applied to finally extract the cluster of matches that maximizes the total consistency score. The approach used by Wang et al. [114] focuses on matching groups of lines, so called “line signatures”. A line signature consists of k neighboring lines which are described by their pairwise relationships (spatial relations and appearance). These relations are combined to form a similarity function of line signatures. Finally, a codebook is used to resolve the matching of lines inside the matched line signatures. Yet another approach is proposed by Fan et al. [30, 31]: The authors use point feature matches in the neighborhood of the lines to leverage the line matching. They introduce an affine and a projective invariant between two points and a line, and four points and a line, respectively, which are used as a similarity measure for the matching. A drawback of this method lies in its dependence on point feature matching. Kim and Lee [61, 62] propose a different kind of point feature for line matching: They describe pairs of intersecting lines located close to one another by so called “Line Intersection Context Features” (LICF). The LICF characterizes the image patch
31
4. Line Matching centered at the intersection point and is used to generate candidate matches by comparing LICFs using “normalized cross-correlation” (NCC). As the intersection point of coplanar lines is invariant to projective transformation, the fundamental matrix is estimated from the matching intersection points in a RANSAC scheme. The resulting inliers define the final LICF matches. The estimated fundamental matrix is then used to resolve the ambiguity in the matching of the lines belonging to the LICFs. The methods proposed by Fan et al., Wang et al. and Bay et al. are computationally very expensive and have runtimes up to several seconds per image pair, which makes them unsuitable for the targeted visual odometry system. Appearance-only-based approaches like MSLD, LEHF or LBD require less computational resources but have the problem of indistinct descriptors, which restricts them to matching under small baseline motion. In the following, a novel matching technique based on optical flow is proposed. There is no need to calculate line descriptors as the optical flow vectors serve to associate line segments in the images, which saves valuable execution time. Furthermore, this method explicitly allows one-to-many matching to take into account the problem of differences in line segmentation.
4.3. Optical Flow-based Matching The matching algorithm proposed here is explicitly designed for the matching of lines under small viewpoint changes such as consecutive frames in image sequences. It follows the idea of Chiba and Kanade [15] in so far as the optical flow calculation is exploited to generate the matches. The difference between the approaches is that Chiba and Kanade use optical flow to predict the position of the line segments and then link the predicted line segment to the observed one. The association is hereby based on comparing geometric properties of the line segments (e.g. line direction). The approach proposed in this thesis makes direct use of the optical flow point correspondences to link the observed line segments. This is achieved through an intelligent selection of input points for optical flow calculation and an effective filtering step in which wrong flow vectors are discarded. The algorithm consists of three main stages: First, the optical flow is calculated for points along the line segments. Second, the flow vectors originating from the same line are checked for consistency. In the third step, the flow vectors are used in a
32
4.3. Optical Flow-based Matching histogram-based approach to generate the matches. Every step is discussed in detail in the following sections.
4.3.1. Optical Flow Calculation In the first step, the optical flow is calculated. The optical flow describes velocities in the image space caused by motion of the camera or in the scene observed. The point in the original image is termed pi and the point in the image after the motion is pi0 = pi + vi where vi is the optical flow vector. Mathematically, the optical flow is characterized by means of a differential equation on the assumption that the intensity I ( pi , t) of a pixel pi stays constant over time t:
∇I · v i +
∂I =0 ∂t
(4.1)
This “brightness constancy constraint” is not sufficient to calculate the flow as vi has two unknowns but the equation just solves one. This phenomenon is called the aperture problem of optical flow. An optical flow algorithm needs to introduce further constraints to circumvent this problem. The method proposed by Lucas and Kanade [80], who restrict the optical flow so it remains constant in the local neighborhood of a pixel, is used in the following. In contrast to the matching procedure of Chiba and Kanade [15], the method proposed does not calculate the optical flow over a static grid on the whole image, but considers only the image regions which are of interest for the matching of lines: The pixels belonging to the extracted line segments. The question is now whether all pixels belonging to line segments should be used or whether certain pixels are more appropriate for optical flow calculation than others? Shi and Tomasi [100] tackled this question and analyzed which image regions are well suited for the Lucas-Kanade optical flow method. They found that the eigenvalues of the gradient matrix G of a pixel pi are good indicators for the eligibility with G=
gx 2
gx gy
gx gy
gy 2
! and
g=
gx gy
! the gradient at point pi .
(4.2)
If both eigenvalues are small, the pixel belongs to a uniform region which is unsuitable for a flow calculation. If one eigenvalue is small and the other large, the image region contains an edge. Edges are prone to the aperture problem so they are also unsuitable for flow estimation. Unfortunately, this is the most common case in the
33
4. Line Matching scenario described here as the lines are extracted from such image regions. It is best when both eigenvalues are large. Here, the image region is structured (e.g. contains a corner) and is therefore good for flow calculation. Shi and Tomasi propose that the minimal eigenvalue be thresholded to detect these suitable regions. This idea is followed here and the minimal eigenvalue for pixels belonging to lines is calculated. For each line, non-maximum suppression is applied to the minimal eigenvalues to keep only pixels which are local maxima. These pixels are then sorted according to their eigenvalue and only the best 50% per line are kept. Section 4.4.2 details an evaluation of the best ratio of pixels to keep with regard to matching performance and runtime. Figure 4.2b shows which “corner-like” points are selected for the optical flow calculation, and Figure 4.2c visualizes the result of the optical flow estimation on these points.
(a)
(b)
(c)
Figure 4.2.: (a) Image with extracted lines. (b) “Corner-like” points on the line segments from (a) for which the optical flow is estimated. (c) Resulting optical flow vectors, colored according to their orientation.
4.3.2. Consistency Check The optical flow calculation is not error-free due to occlusion, noise etc. (cf. Figure 4.2c). To mitigate the influence of these errors on the matching result, a filtering step is introduced where flow vectors which violate the “consistency” are discarded. The consistency is defined in two ways: First, the appearance of a point before and after the motion must stay the same - this is called the “appearance consistency”. Second, the “consistent motion constraint” is introduced which states that points belonging to the same line must move in a consistent way.
34
4.3. Optical Flow-based Matching The L1 -norm between the image patch around the original point pi in image I and the patch around the moved point pi0 in image I 0 is calculated and this value is used as a measure for the “appearance consistency”. The 5% of flow vectors with the highest norm are discarded. For the second rule, a check is carried out to see if the points pi0 originating from the same line l i also form a line. A line-fitting algorithm in the RANSAC scheme [34] is used to calculate the line which agrees best with the points pi0 . Then, all points are discarded which do not fit to this line. A point fits to this line if its point-line distance (cf. Equation (3.45)) is less than or equal to 1 px. This consistent motion constraint is visualized in Figure 4.3.
pi li
pi0 RANSAC line
Figure 4.3.: Visualization of the “consistent motion constraint”. The purple optical flow vector is discarded because its endpoint pi0 is not an inlier of the RANSAC process. Only the green flow vectors with endpoints between the dashed lines are considered to be inliers of the fitted line.
Figure 4.4 depicts which flow vectors are discarded because of “appearance consistency” and the “consistent motion constraint” and which are used for further processing.
Figure 4.4.: Flow vectors in purple are discarded because of “appearance consistency”, flow vectors in yellow because they violate the “consistent motion constraint”. Only the flow vectors drawn in green are considered for further processing.
35
4. Line Matching
4.3.3. Histogram-based Line Matching using Optical Flow Vectors
After the optical flow result is filtered, the lines of images I and I 0 are finally associated. Owing to noise and differences in line segmentation, the endpoints pi0 of the flow vectors will not lie directly on the lines in image I 0 . To associate the endpoints pi0 with lines l i0 and then the lines l i0 with lines l i from image I, a histogram-based ap-
proach is designed where every optical flow endpoint pi0 votes for its nearby lines l i0 . The votes are then accumulated over all points originating from the same line l i . The line l i0 with the most votes is then the match of l i . This procedure explicitly allows one-to-many matches since several lines in image I could match to the same line in image I 0 . Differences in line segmentation are thus taken into account. Algorithm 4.1 illustrates this histogram-based matching process in detail.
Algorithm 4.1 Histogram-based line matching using optical flow vectors. Input: L ← lines in image I with |L | = n Input: L 0 ← lines in image I 0 with |L 0 | = m Input: P ← “corner-like” points for optical flow estimation on the lines L Input: P 0 ← endpoint of flow vectors, there is a one-to-one correspondence between points in P and P 0 . for all lines l i ∈ L do h(l i0 ) = 0 set histogram entry for all lines l i0 ∈ L 0 to 0. Pl i ← all points { pi with pi ∈ P and pi lies on line l i } for all points pi ∈ Pl i do pi0 ← corresponding � 0 point0 to pi0 0 L p0 ← all lines l i with l i ∈ L and l i0 in distance d ≤ dth to pi0 i
for all lines l i0 ∈ L p0 0 do i
h(l i0 ) = h(l i0 ) + 1d with d distance of pi0 to l i0 end for end for � Save match l i , l i0 with l i0 = argmax` h(`) end for
The only adjustable parameter in this histogram-based matching process is dth which defines the search region for nearby lines around point pi0 . In Section 4.4.2, the influence of dth on the matching performance is evaluated and it is found that 2 px is a good value. Figure 4.5 shows the resulting line matches.
36
4.4. Experiments and Evaluation
Figure 4.5.: Line matches generated with the optical flow line matching algorithm. Matching lines have the same color.
4.4. Experiments and Evaluation In the following, the matching performance of the matching algorithm proposed is analyzed and compared to other state-of-the-art line matching approaches. Before starting with the evaluation, a matching test set is defined in Section 4.4.1. This test set is then used to tune the algorithms in Section 4.4.2, and to evaluate the matching performance compared to the state-of-the-art in Section 4.4.3.
4.4.1. Matching Test Set The test set consists of 14 image pairs showing different indoor and outdoor scenes. For each image in the test set, line segments are detected using the LSD algorithm1 [110]. Corresponding lines in the image pairs are then manually labeled and saved as ground truth matches. Note that a line segment can correspond to multiple line segments in the other image as the line segmentation may vary. Example images are shown in Figure 4.6, the whole image database is presented in Appendix C. A subset of 6 image pairs is used to find the best parameter configuration for the algorithm. In detail, this configuration set consists of the image pairs “Demoarea01”, “HCI01”, “KITTI01”, “Modelhouse01”, “Office01” and “Oxford01”. The remaining 8 image pairs are used for the evaluation of the algorithms. Two common measures known from binary classification tasks are used to evaluate the matching performance: Precision and recall. The precision is defined as the ratio 1 The
implementation in OpenCV 3.0.0 with default parameters is used here.
37
4. Line Matching
(a) “HCI01”
(b) “KITTI01”
(c) “Warehouse01”
(d) “Facade01”
(e) “Oxford01”
(f) “Office01”
Figure 4.6.: Examples for image pairs of the test set.
38
4.4. Experiments and Evaluation of the correctly identified matches to all retrieved matches. The group of retrieved matches contains correctly identified matches (“true positive matches”) and those falsely classified as matches (“false positive matches”). The recall states how many of all the labeled matches are successfully retrieved and is defined as the ratio of all correct matches to all labeled matches. A perfect matching algorithm would have precision and recall values of 1 because all matches would be found (recall = 1) and every match would be correct (precision = 1). The harmonic mean of precision and recall - the F-score - is used in addition. correct matches all retrieved matches correct matches recall = all labeled matches 2 · precision · recall F-score = precision + recall
precision =
(4.3) (4.4) (4.5)
The execution time of the algorithms is also measured. All experiments are conducted on a desktop PC with Intel® Xeon™ CPU with 3.2 GHz and 32 GB RAM.
4.4.2. Configuration of the Optical Flow-based Matching As the test setup has now been introduced, the next step is tuning the internal parameters of the algorithm to suitable values. The optical flow-based matching algorithm has two parameters: The first parameter encodes how many “corner-like” points should be used for the optical flow calculation (cf. Section 4.3.1). The second parameter dth defines the size of the neighborhood in which an endpoint of a flow vector is associated with a line (cf. Section 4.3.3). It is expected that varying the proportion of “corner-like” points has a big impact on the runtime since the more points that are used, the more optical flow vectors need to be calculated. On the other hand, if this parameter is set so as to be too small, matches are missed because the consistency check could discard all points of a line. Concerning the parameter dth , it is expected that an increase will lower the precision as more lines lie in the neighborhood of a point, thus increasing the risk of voting for a false one. On the other hand, if dth is too small, correct lines could be missed because they are outside of the neighborhood. This means that expanding the neighborhood is predicted to lead to a higher recall.
39
4. Line Matching The proportion of “corner-like” points is varied between 0.1 and 1.0, and dth is varied between 0 and 10 pixels, and the matching algorithm is evaluated for the configuration set by measuring the mean F-score and the mean runtime. The F-score is chosen as it combines precision and recall and enables an easy evaluation. The results are plotted in Figures 4.7 and 4.8. As expected, the execution takes more time as more and more points are used for the optical flow calculation. The question now is whether using more points is beneficial to the performance of the algorithm in terms of the F-score to the extent that this would justify a higher runtime. The answer is clearly no, as it is observed that the F-score stays almost constant when the proportion of “corner-like” points used is 0.3 and higher. Between 0.1 and 0.2 an increase in the F-score by 15% from 0.75 to 0.90 is observed. This shows that matches are indeed missed because too few optical flow points remain for association. Analyzing the effect of the parameter dth , it is observed that the F-score varies as expected. With dth = 0 px, the algorithm described here finds no matches at all. From dth = 1 px to dth = 2 px, the F-score increases about 1%, the maximum is reached at dth = 2 px and dth = 3 px. Using higher values, the F-score decreases again since the search regions become too big and too many lines fall into them, which favors false matches. The maximum F-score of 0.932 is achieved using dth = 2 px and a proportion of “corner-like” points of 0.6. Since decreasing the proportion of “corner-like” points has only a marginal impact on the F-score, the value chosen for it here is 0.5, so as to benefit from the better runtime (here the mean F-score is 0.928). It is thus recommended that the proportion of “corner-like” points be set to 0.5 and dth to 2 px.
4.4.3. Comparison with the State-of-the-Art Now that the optical flow-based matching algorithm has been tuned, it is compared to other state-of-the-art approaches. Appearance-only methods are chosen for comparison since algorithms which use additional constraints are computationally very expensive and therefore unsuitable for the targeted localization system, which requires real-time performance. In addition, the focus here is on the processing of image sequences, which generally means that the change between two successive
40
4.4. Experiments and Evaluation
Maximum 0.932 0.8
Mean F-score
1
0.6
0.4
0.5 1 0.8
0 0
0.6
2
Maxim
4
0.4
6
8 ance d th (in px )
um dist
dth (in px)
0.1
0.2
0 1 2 3 4 5 6 7 8 9 10
0.000 0.757 0.767 0.768 0.765 0.764 0.762 0.762 0.759 0.759 0.758
0.000 0.907 0.921 0.920 0.912 0.909 0.906 0.903 0.899 0.897 0.897
10
0.2
f .o p o Pr
o
“c
” ke -li r e rn
Mean F-score Proportion of “corner-like” points 0.3 0.4 0.5 0.6 0.7 0.8 0.000 0.917 0.931 0.930 0.921 0.919 0.916 0.913 0.911 0.908 0.907
0.000 0.916 0.931 0.929 0.920 0.917 0.915 0.911 0.908 0.905 0.904
0.000 0.914 0.928 0.926 0.918 0.915 0.912 0.909 0.906 0.902 0.902
0.000 0.917 0.932 0.930 0.922 0.919 0.917 0.913 0.909 0.906 0.904
0.001 0.918 0.931 0.928 0.920 0.917 0.915 0.912 0.909 0.906 0.904
0.001 0.916 0.930 0.927 0.919 0.916 0.913 0.910 0.907 0.903 0.901
s
t in po
0.2
0
0.9
1
0.001 0.918 0.931 0.928 0.923 0.918 0.916 0.911 0.908 0.904 0.903
0.001 0.916 0.929 0.928 0.923 0.917 0.915 0.910 0.907 0.903 0.902
Figure 4.7.: Impact of the proportion of “corner-like” points and the maximum allowed distance dth on the matching performance. The values represent the mean F-score over the configuration set.
41
4. Line Matching
70
60
Mean Runtime (ms)
80
50
60
40
40 1
s
0.8
20 0
0.6
2
4 Maxim um dist
0.4
6
8
ance d th (in px )
10
0.2
. op Pr
of
o “c
e”
e rn
dth (in px)
0.1
0.2
0 1 2 3 4 5 6 7 8 9 10
25.5 22.3 20.6 21.6 19.4 20.7 21.3 20.8 19.7 21.3 23.2
23.8 26.5 25.3 23.7 25.3 25.4 25.1 24.7 25.6 25.3 27.0
29.3 30.0 32.3 31.2 30.5 30.4 30.7 30.7 28.4 30.0 29.4
39.6 41.9 40.3 39.5 40.1 41.5 40.3 37.1 38.3 41.8 41.1
47.7 46.9 43.4 46.5 46.9 46.4 44.7 46.2 47.5 46.2 48.1
52.8 54.1 53.4 52.1 51.7 54.7 53.5 49.0 51.3 55.3 53.1
30
ik r-l
Mean runtime (in ms) Proportion of “corner-like” points 0.3 0.4 0.5 0.6 0.7 0.8 35.3 35.1 33.8 34.7 37.1 35.4 34.5 34.8 35.5 35.6 36.1
t in po
57.9 56.3 60.8 58.5 54.4 56.4 62.9 61.3 59.0 57.9 55.7
20
0.9
1
66.2 64.6 63.5 65.5 66.6 62.8 62.6 65.2 68.7 66.4 65.2
68.2 75.7 70.8 68.5 70.5 73.0 73.4 67.5 63.7 59.8 75.6
Figure 4.8.: Impact of the proportion of “corner-like” points and the maximum allowed distance dth on the execution time of the matching. Timings are given as the mean value over the configuration set.
42
4.4. Experiments and Evaluation images is small, so appearance-only approaches are still suitable. In detail, the approaches used are LEHF2 from Hirose et al. [52], MSLD3 from Wang et al. [115] and LBD4 from Zhang and Koch [122, 123]. Note that, for LBD, only the descriptor is used; the spectral matching technique is not employed. All three methods are combined with the LRC matching strategy and a global threshold on the descriptor distance. Although LRC enforces one-to-one matching, it has been proven to achieve better results under rotation and viewpoint change (cf. [115]) and is therefore used here. The threshold for LEHF and MSLD is set to 0.6 whereas LBD has a threshold of 52. All the thresholds were tuned to the configuration dataset. Figure 4.9 shows the matching precision and recall of the different matching algorithms for the evaluation data. First of all, it is observed that the matching algorithm proposed in this thesis gives poor results on the “Facade01” and “Facade02” image pairs. These two image pairs clearly mark the limit of this approach as the images change considerably due to the huge variation in viewpoint (“Facade01”) or camera rotation (“Facade02”). As a consequence, the optical flow method does not succeed in calculating a correct flow, which explains the low precision and recall values. Besides this, the matching precision of the algorithm proposed is comparable to that of the other approaches; in the case of the “Office03” image pair it is even 5% better than the next best one (1.000 compared to 0.949 for MSLD). The recall increases in most cases between 4% for the “Warehouse01” image pair (from 0.925 for LEHF to 0.963) and 19% for the “Office03” image pair (from 0.804 for LEHF to 0.957). One reason is that the method described here allows one-to-many matching in order to handle differences in line segmentation, whereas the other methods are restricted to one-to-one matching. The conclusion drawn here is that this method is preferable to the other methods under small baseline motion as it has succeeded in retrieving more correct matches with the same precision. In Figure 4.10 the mean time spent on matching over 50 iterations of the different algorithms is plotted. As LEHF, MSLD, and LBD need a descriptor for matching, the construction time of the descriptors in both images has also been visualized. It is observed that the matching process of MSLD and LEHF is very fast compared to this optical flow-based method. But the descriptor calculation consumes most of the time. The MSLD descriptor in particular is expensive to compute, resulting 2 Many
thanks to the authors for the courtesy of providing their code. from https://github.com/bverhagen/SMSLD/tree/master/MSLD/MSLD/MSLD 4 Implementation from OpenCV 3.0.0 3 Implementation
43
4. Line Matching
0.8
0.6
0.6
0.4
0.4
Fa
ca Fa de ca 01 de H 02 C W KI I0 ar T 2 eh TI ou 02 O se0 ffi 1 O ce0 f 2 O fice x f 03 or d0 2
0.8
Image Pair LEHF
Recall
1
Fa ca Fa de ca 01 de H 02 C W K I I0 ar T 2 e h TI ou 02 O se0 ffi 1 O ce0 f 2 O fice x f 03 or d0 2
Precision
1
Image Pair MSLD
LBD
This method
Sequence
LEHF
Precision MSLD LBD
Facade01 Facade02 HCI02 KITTI02 Warehouse01 Office02 Office03 Oxford02
0.9412 0.9552 0.9917 0.9520 0.9900 1.0000 0.9024 0.9765
0.9577 0.8972 0.9912 0.9037 0.9655 0.9877 0.9487 0.9630
0.9602 0.8692 0.9744 0.9562 0.9703 0.9877 0.8947 0.9643
Sequence
LEHF
MSLD
Recall LBD
Facade01 Facade02 HCI02 KITTI02 Warehouse01 Office02 Office03 Oxford02
0.8205 0.7442 0.9520 0.6800 0.9252 0.9651 0.8043 0.8218
0.7735 0.5581 0.8960 0.6971 0.7850 0.9302 0.8043 0.7723
0.8248 0.6570 0.9120 0.7486 0.9159 0.9302 0.7391 0.8020
This method 0.4233 0.6779 0.9917 0.9441 0.9717 0.9878 1.0000 0.9688
This method 0.2949 0.5872 0.9600 0.8686 0.9626 0.9419 0.9565 0.9208
Figure 4.9.: Comparison of the precision and recall of different matching approaches for the evaluation test set.
44
4.4. Experiments and Evaluation
1,000
Runtime (in ms)
800
600
400
K
IT TI W 02 ar eh ou se 01 O ffi ce 02 O ffi ce 03 O xf or d0 2
2
H C
ca de 0
Fa
Fa
ca
de 0
1
0
I0 2
200
Image Pair LEHF Matching MSLD Matching LBD Matching LEHF Descriptor MSLD Descriptor LBD Descriptor This method
Sequence
M
LEHF D
Facade01 Facade02 HCI02 KITTI02 Warehouse01 Office02 Office03 Oxford02
22.6 11.3 5.8 11.1 4.7 2.4 0.9 3.7
37.1 24.5 18.7 24.4 16.5 11.9 7.7 14.8
∑
M
59.7 35.8 24.5 35.5 21.1 14.3 8.5 18.5
13.1 6.5 4.3 10.5 2.7 1.6 0.6 2.2
Runtime (in ms) MSLD D M ∑
LBD D
∑
288.8 187.1 1060.1 237.8 169.3 337.3 318.0 140.9
54.4 47.9 75.1 33.6 17.8 22.0 16.6 22.5
139.9 109.9 111.0 85.8 45.3 39.9 25.9 49.0
301.9 193.6 1064.4 248.3 171.9 338.8 318.7 143.1
85.5 62.1 35.9 52.2 27.5 17.9 9.4 26.4
This 79.1 48.9 30.2 23.4 13.9 16.4 12.8 14.4
Figure 4.10.: Comparison of the execution time of different matching approaches for the evaluation test set. The values plotted are the mean over 50 executions. The time for the descriptor calculation is additionally visualized for the descriptor-based approaches LEHF, MSLD and LBD.
45
4. Line Matching in an accumulated matching and description time of between 143 ms and 1, 064 ms. The LEHF descriptor is much more efficient and has accumulated runtimes of between 9 ms and 59 ms, making it comparable to the runtime of the optical flow-based matching described here with runtimes of between 13 ms and 79 ms. The matching time of LBD is comparable to the algorithm presented here but with the descriptor calculation, the runtime increases and results in overall runtimes of between 26 ms and 140 ms. From the evaluation of matching performance and runtime, the conclusion is that the optical flow-based matching technique proposed here outperforms the state-ofthe-art methods in matching under small baseline motion. The same precision as the state-of-the-art is achieved while a higher recall is attained. The runtime is on a par with the fastest state-of-the-art approach (LEHF) and clearly better than the other methods evaluated.
4.5. Conclusion This chapter has presented a novel line matching method for application under small baseline motion. The matching is based on optical flow computations along the line segments where, in a first step, unreliable flow vectors are discarded and the remaining ones are associated with lines in the second image. A histogram is calculated which counts the associations from flow vectors to lines, and the line with the most votes is chosen for the match. The algorithm is explicitly designed to allow oneto-many matches, which helps to compensate for differences in line segmentation between the images. It has been demonstrated on different test images that the approach used here is suitable for line matching under small baseline motion and its performance has been compared to other state-of-the-art approaches. It has been found that the algorithm used here achieves the same precision as the state-of-the-art while attaining higher recall. In addition, the method described here saves valuable execution time compared to the state-of-the-art methods as no descriptor needs to be calculated. Furthermore, the optical flow point correspondences provide the means to reconstruct spatial lines from degenerate configurations (e.g. when the direction of the spatial line is parallel to the camera translation), which is discussed in Chapter 6.
46
5. Relative Pose Estimation from Lines 5.1. Introduction Relative pose estimation is the problem of calculating the relative motion between two or more images. It is a fundamental component of many computer vision algorithms as used in visual odometry, visual SLAM or structure from motion, for example. In robotics, these computer vision algorithms are heavily used for visual navigation. The classical approach to estimating the relative pose between two images combines point feature matches (e.g. SIFT [79]) and a robust (e.g. RANSAC [34]) version of the 5-point-algorithm [91]. For lines, it is in general not possible to calculate the relative pose from two images alone [116] unless further knowledge of the scene geometry is assumed. This is done by Elqursh and Elgammal [24] which base their solution on the “Manhattan World” assumption. In this chapter, a novel relative pose estimation scheme for lines is presented which takes its inspiration from the work of Elqursh and Elgammal [24]. It is proposed that the relative pose estimation process is started with a new spatial line direction estimation step which allows to replace the restricting “Manhattan world” assumption with a less stricter form in which different spatial directions of arbitrary orientation are allowed. Moreover, it is proposed that this direction information is used throughout all steps of the processing, thus enabling the computation time of the relative pose estimation to be drastically improved. The contributions of this work are: • an improved line clustering algorithm to estimate the spatial line directions per image with a novel clustering initialization • a new spatial line direction matching scheme in which corresponding line directions of two different views are found
47
5. Relative Pose Estimation from Lines • a robust and fast framework combining all necessary steps for using lines in relative pose estimation which enables to replace the restricting “Manhattan world” assumption by a less stricter variant Large parts of this chapter have been published previously in [111, 112]. The chapter is structured as follows: First, related work is highlighted in Section 5.2. The following sections describe the methods by which the relative pose is estimated. First, spatial line directions are found through clustering and used for estimating the rotational part of the relative pose (Section 5.3). Once the rotation between the two views is estimated, the translational component is calculated from line intersections (Section 5.4). Section 5.5 presents the robust relative pose estimation framework which combines the rotation and translation estimation. The method proposed here is evaluated in Section 5.6 and compared to the state-of-the-art. The chapter concludes with Section 5.7.
5.2. Related Work The trifocal tensor is the standard method for relative pose estimation using lines. The trifocal tensor calculation requires at least 13 line correspondences across three views [45, 48]. For two views, it is generally not possible to estimate camera motion from lines, as demonstrated by Weng et al. [116], unless further knowledge of the lines observed is taken into account. For instance, if different pairs of parallel or perpendicular lines are available, as is always the case in the “Manhattan world”, the number of views required can be reduced to two. When using two views, only five degrees of freedom need to be estimated (three for the rotational displacement and two for the translation up to scale) compared to 26 for the trifocal tensor. Problems with fewer degrees of freedom are ideal for robust estimation methods like RANSAC as less data is needed to generate a solution hypothesis and hence the number of iterations required is lower (cf. [34]). In the work of Elqursh and Elgammal [24], the “Manhattan world” is assumed and employed to find “triplets” of lines, where a triplet consists of three lines of which two are parallel and the third is perpendicular to the others. The pose estimation process is divided into two steps: First, the vanishing point information inherent to a triplet is used to calculate the relative rotation. Then, the relative translation is estimated from line intersections using the rotation already calculated. The detection of valid triplets for rotation estimation is left to a “brute force” approach in which
48
5.3. Rotation Estimation from Spatial Line Directions all possible triplet combinations are tested by means of RANSAC. As the number of possible triplets is of O(n3 ) for n line matches, this computation is very expensive. In contrast, the rotation estimation method proposed here is more computationally efficient as it is calculated from corresponding spatial line directions, and the number m of different spatial line directions is much smaller than the number of line matches (in this case m < 10 whereas n > 100). In addition, there is no need for the restricting “Manhattan world” assumption, which would require orthogonal, dominant directions, but a less stricter form where arbitrary directions are allowed. Similar approaches have been presented by Wang et al. [113] and Bazin et al. [7]. In both works, the pose estimation is split into rotation and translation estimation as well, where the rotation calculation relies on parallel lines. Bazin et al. estimate the translation from SIFT feature point matches. Their approach is also optimized for omnidirectional cameras. The method used in this thesis requires only lines and no additional point feature detection as the translation is calculated from intersection points.
5.3. Rotation Estimation from Spatial Line Directions The relative rotation estimation is based on the fact that the rigid transformation of 3-dimensional line directions depends only on the rotational part (cf. Equation (3.15)): c2
d=
c2
c1 R
c1
d
(5.1)
Given m corresponding (and possible noisy) directions, the aim is to find the rotation c2
c1 R
between two cameras c1 and c2 which minimizes c2
where
c1 R
= argmin k c2 D − R c1 D k
c1 D
and
(5.2)
R c2 D
are 3 × m matrices that contain the corresponding directions in
each column. This problem is an example of the “Orthogonal Procrustes Problem” [42]. The solution employed in this work is the one presented by Umeyama [108], which is based on singular value decomposition (SVD) and returns a valid rotation matrix as its result by enforcing det( c2 c1 R ) = 1: c2
c1 R
= USVT
(5.3)
49
5. Relative Pose Estimation from Lines with � � UDVT = svd c2 D c1 D T 1 0 S = 0 1
(5.4) 0
0
(5.5)
0 0 sgn (det(U) det(V))
At least two non-collinear directions are required to calculate a solution.
At this point, the challenging task is extracting 3-dimensional line directions from line observations in the two images and bringing these extracted directions into correspondence. Here, the direction estimation is solved using a parallel line clustering approach which is explained in Section 5.3.1. In Section 5.3.2, the matching of spatial line directions is described.
5.3.1. Spatial Line Direction Estimation by Parallel Line Clustering
The goal of this phase is to cluster lines of an image that are parallel in the real world and to extract the shared spatial line direction for each cluster. This problem is closely related to the vanishing point detection, as the vanishing point vi of parallel lines is the projection of the spatial line direction cd [48]: v i = K cd
(5.6)
This thesis suggests working directly with spatial line directions cd and not with the vanishing points in the image space. Working in 3-space is advantageous because it does not depend on the actual camera (perspective, fisheye, etc.) and allows for an intuitive initialization of the clustering. Equation (5.6) introduces how the vanishing point and the spatial line direction are related. At this point, the line l i has to be transferred into its corresponding 3-dimensional expression – its back-projection. The back-projection of an image line is the plane cπ whose plane normal vector is given by (cf. Section 3.4.5): c
50
n = KT l i
(5.7)
5.3. Rotation Estimation from Spatial Line Directions Expectation-Maximization Clustering Many of the vanishing point detection algorithms employ the Expectation-Maximization (EM) clustering method [18] to group image lines with the same vanishing point [3, 69]. This research was inspired by the work of Košecká and Zhang [69] and their algorithm is adapted so that it directly uses spatial line directions instead of vanishing points. This enables a new and much simpler cluster initialization to be introduced in which initial directions are derived directly from the target environment. The EM algorithm iterates the expectation and the maximization steps. In the expectation phase, the posterior probabilities p( cd mirrors the likelihood that a line l i
( j)
(k) c ( j) |n )
are calculated. The posterior
(with back-projected plane normal cn ( j) ) be-
longs to a certain cluster k represented by direction cd
(k)
. Bayes’ theorem is applied
to calculate the posterior:
p
�
c (k) c ( j)
d
|n
�
�
p
cn ( j ) | cd ( k )
= p
�
� � � (k) p cd �
(5.8)
cn ( j )
The likelihood is defined as
p
�
c ( j) c (k)
n
|d
�
=q
1 2πσk2
− exp
�
cn ( j ) T cd ( k )
�2 .
2σk2
(5.9)
The likelihood reflects the fact that a spatial line in the camera frame (and its direction c ( j)
d ) lies in cπ ( j) and is therefore perpendicular to the plane normal cn ( j) . If cn ( j) and
c (k)
d
are replaced with Equations (5.6) and (5.7), the same likelihood term in image
space is obtained as proposed in the work of Košecká and Zhang [69]. In the maximization step, the probabilities from the expectation step remain fixed. In this phase, the direction vectors are re-estimated by maximizing the objective function: argmax ∏ p c (k)
�
c ( j)
n
�
c (k)
j
d
= argmax ∑ log p d
�
c ( j)
n
�
(5.10)
j
with p
�
c ( j)
n
�
=∑p
�
c (k)
d
� � � (k) p cn ( j ) | cd
(5.11)
k
As pointed out in [69], in the case of a Gaussian log-likelihood term, which is the
51
5. Relative Pose Estimation from Lines case here, maximizing the objective function is equivalent to solving a weighted least squares problem for each cd c (k)
d
= argmin ∑ p c
d
�
(k)
:
c ( j) c
n
|d
��
c ( j) T c
n
�2 d
(5.12)
j
After each EM iteration, clusters with less than two assignments are deleted to gain robustness. The EM process is stopped when the assignment from the lines to clusters no longer changes.
Cluster Initialization For initialization, a set of 3-dimensional directions is defined which are derived from the targeted environment as follows: The method proposed here is applied in indoor and urban outdoor scenes, hence it is expected that the three dominant directions of the “Manhattan world” will be present. In addition, the camera is mounted pointing forward with no notable tilt or rotation against the scene, therefore the three main directions (1 0 0)T , (0 1 0)T , (0 0 1)T are used for initialization. For robustness, all possible diagonals like (1 1 0)T , (1 − 1 0)T , . . . , (1 1 1)T are added (e.g. to capture the staircase in Figure 5.1b), resulting in 13 line directions overall. All line directions are normalized to unit length and initially have the same probability. The variance of each cluster is initially set to σk2 = sin2 (1.5°), which reflects the fact that the plane normal and the direction vector should be perpendicular with a deviation of up to 1.5°. Note that this derivation of the initial directions can be easily adapted to other scenes or camera mountings. If, for example, the camera is mounted so as to be rotated, the directions can simply be rotated accordingly. If such a derivation is not possible, it is suggested that the initialization technique proposed in [69] be used, where the initial vanishing points are calculated directly from the lines in the image. If an image sequence is processed, it is proposed that the directions estimated from the previous image be used in addition in the initialization as “direction priors”. In this case, these priors are assigned a higher probability. It is argued that the change between two consecutive images is rather small so the directions estimated from the previous image seem to be a valid initial assumption. This assumption is proven to be correct in the experiments in Section 5.6.2.
52
5.3. Rotation Estimation from Spatial Line Directions Results from the clustering step are visualized in Figure 5.1.
(a)
(b)
Figure 5.1.: Results of the parallel line clustering. Lines with the same color belong to the same cluster and are parallel in the real world. Each cluster has a 3-dimensional direction vector cd assigned to it which represents the line direction as seen in this image.
5.3.2. Spatial Line Direction Matching Correspondences between the spatial line directions (the clusters) of the two images need to be established in order to calculate the relative rotation. This is done using RANSAC [34]. The mathematical basis for the algorithm is that – as stated above – the transformation of a direction c1 d from the first camera to the direction c2 d in the second camera depends only on the rotation c2
d=
c2
c1 R
c1
c2
c1 R :
d
(5.13)
This equation does not hold in the presence of noise, so the signed angular distance δ ( c2 d , c2 c1 R c1 d ) between the directions (cf. Equation (3.43)) is used. The RANSAC process tries to hypothesize a rotation that has a low angular distance over a maximized subset of all possible correspondences. A rotation is hypothesized from two randomly selected direction correspondences as described above and then tested against all other correspondences. The idea behind this procedure is that only the correct set of correspondences yields a rotation matrix with small angular distances. Hence, the correct rotation matrix selects only the correct correspondences into the consensus set.
53
5. Relative Pose Estimation from Lines This method has one drawback: It turns out that different rotation hypotheses with different sets of correspondences result in the same angular distance. This happens especially in a “Manhattan world” environment. This ambiguity is illustrated in Figure 5.2. R1
??? R2 Figure 5.2.: Ambiguity in the direction matching. Which is the correct correspondence assignment for the directions from the left to the right? The rotation could either be 45° clockwise in the plane (R1 ) or 45° counter-clockwise and then about the green direction vector (R2 ). In this setting, the angular distances for R1 and R2 are the same.
As no other sensors are present in the system used here to resolve these ambiguities, it is assumed there are small displacements between the images and therefore the permissible rotation is restricted to less than 45°. As the target application is visual odometry, this is a valid assumption. Alternatively, if an inertial measurement unit (IMU) is present, for example, its input could also be used.
5.4. Translation Estimation from Intersection Points
The translation is estimated in the same way as proposed by Elqursh and Elgammal [24]. Intersection points of coplanar spatial lines are invariant under projective transformation and therefore fulfill the epipolar constraint [48]: p i2 T K −T
�c
2
t c1
� ×
c2
c1 R K
−1
p i1 = 0
(5.14)
If intersection point correspondences and the relative rotation are given, a linear
54
5.5. Robust Relative Pose Estimation Framework equation system is formed from the epipolar constraint to solve c2 t c1 : � � p i2 T K −T c2 t c1 × c2 c1 R K −1 p i1 = 0 h i �� � � c2 p i2 T K −T − c2 c1 R K −1 p i1 t c1 = 0
(5.16)
A ( j ) c2 t c1 = 0
(5.17)
(5.15)
×
Every intersection point correspondence yields one linear equation. These equations are stacked to form the overall system A c2 t c1 = 0 .
(5.18)
This linear equation system is solvable up to scale in least squares sense using singular value decomposition if at least two intersection point correspondences exist. As no knowledge is available about which intersection points from all
n ( n −1) 2
possi-
bilities (with n the number of line correspondences) belong to coplanar lines, the idea from [24] is followed and RANSAC used to select the correct correspondences from all possible combinations while minimizing the Sampson distance defined in [48]. In contrast to [24], the number of initial correspondence candidates can be reduced as the clusters are taken into account and only intersection points between lines of different clusters are calculated.
5.5. Robust Relative Pose Estimation Framework In this section, the algorithms explained are combined to a robust framework for relative pose estimation. The overall structure of the framework is depicted in Figure 5.3. At first, the parallel line clustering is executed to estimate the spatial directions of the lines observed in both images. Each spatial line direction cd is associated with a probability p( cd ) which reflects the size of the corresponding cluster. The more lines share the same direction, the higher the probability. This probability is used to guide the direction matching process: At the start, only line directions from both images whose probability exceeds 0.1 are selected and their direction matching is computed using the RANSAC procedure as described. If the RANSAC process fails, the probability threshold is halved so more directions are selected and the RANSAC process is started again. This procedure is continued until a match is found or all spatial line directions are selected and still no solution is obtained. In this case, the
55
5. Relative Pose Estimation from Lines
Lines from Images
Relative Pose Estimation
Relative Rotation Estimation
no Start
Parallel Line Clustering
yes
Direction Matching
line clusters and directions for two images?
R
t End
Ambiguity Resolving
Nonlinear Relative Pose Refinement
Relative Translation Estimation
Relative Pose
Figure 5.3.: The relative pose estimation framework. Solid lines link the different processing steps. Dashed lines mark relevant data exchange between the modules. Failure cases are not shown.
56
5.5. Robust Relative Pose Estimation Framework whole relative pose estimation process stops with an error. If successful, the matched spatial directions and the corresponding rotation matrix are returned. This rotation matrix is the rotation
c2
c1 R
between the two cameras.
Once the rotation is estimated, the translation is calculated from intersection points as described above. Translation c2
transformation
c1 T
c2
t c1 and rotation
c2
c1 R
combined form the overall
between the two cameras. As errors in the rotation directly affect
the translation estimation, the inlier intersection points from the RANSAC step are used for a nonlinear optimization of the overall pose.
The optimized pose still has an ambiguity in the orientation of the translation vector which needs to be resolved. All line matches are triangulated with respect to c1 . For every triangulated line c1 L with endpoints
c1 p
1
and
c1 p
2,
the parallax ρ between the
two observations (this is the angle between the two back-projected planes c2 π
c1 π
and
which intersect in the triangulated line) is measured and a check is made as to
whether the triangulation result is in front of the camera by calculating the visibility score υ: υ = sgn
�
c1
� � � r 1 T c1 p1 + sgn c1 r 2 T c1 p2
(5.19)
where c1 r i denote the back-projected rays of the endpoints of the line segment seen in c1 (cf. Equation (3.36)). This value is weighted by the parallax angle and summed over all triangulated lines to form the ambiguity score a. To mitigate the effect of large parallax angles, ρ is cut off if it becomes bigger than a certain threshold ρth :
ρc =
ρ ρ
if ρ ≤ ρth th
(5.20)
otherwise
The overall ambiguity score a is then a=
∑ ρc υ .
c1
(5.21)
L
If a < 0, the sign of the translation vector is changed, otherwise the translation stays as it is.
57
5. Relative Pose Estimation from Lines
5.6. Experiments and Evaluation 5.6.1. Datasets
The experiments conducted in this thesis use synthetic and real image sequences. As synthetic data, a typical indoor scene is represented by a 3-dimensional wireframe model and images generated from it by projecting the line segments from the model into a virtual pinhole camera. The sequence generated consists of 843 images. Example images are shown in Figure 5.4.
(a)
(b)
Figure 5.4.: Synthetic images showing a typical indoor scenario.
To see how image noise affects the processing, Gaussian noise is added to the image lines. Noise is not added at the endpoints of the line segments because this affects segments of different length differently. Rather, the segments are rotated around their center point, where σ is the standard deviation of the rotation in degrees. For the experiments on real data, publicly available datasets with ground truth information on the camera poses are used. Both indoor and outdoor sequences from the robotic context are selected to test the algorithm developed here in a variety of environments. Robotic indoor scenes are represented by sequences from the “RGB-D SLAM benchmark” from TU Munich [104] and by the “Corridor” sequence from Oxford1 . For outdoor scenes, sequences from the automotive sector are chosen and the “HCI benchmark suite” [67, 68] and the “KITTI Vision Benchmark Suite” from KIT [40] are used. The detailed overview of the sequences used is given in Table 5.1. 1 http://www.robots.ox.ac.uk/~vgg/data1.html
58
5.6. Experiments and Evaluation
Table 5.1.: List of sequences Number of images
Image dimension
Trajectory length
Oxford Corridor TUM fr2/pioneer_3602 TUM fr2/pioneer_slam3 TUM fr2/pioneer_slam24 TUM fr2/pioneer_slam35
11 1, 185 2, 861 2, 053 2, 524
512 × 512 px 640 × 480 px 640 × 480 px 640 × 480 px 640 × 480 px
0.88 m 17.98 m 44.19 m 24.88 m 27.63 m
HCI 0_00006 HCI 0_00777 KITTI Odometry Dataset 058
101 600 2, 761
2, 560 × 1, 080 px 2, 560 × 1, 080 px 1, 226 × 370 px
4.17 m 21.68 m 2, 205.58 m
Sequence
As the datasets are now defined, the performance of the relative pose estimation proposed here is evaluated. First, the parallel line clustering step in Section 5.6.2 is tested since the estimated spatial line directions are crucial for the further processing. Second (Section 5.6.3), the accuracy of the resulting relative pose is evaluated and compared to state-of-the-art algorithms using points or lines. All experiments are conducted on a desktop PC with Intel® Xeon™ CPU with 3.2 GHz and 32 GB RAM.
5.6.2. Evaluation of Parallel Line Clustering In this section, the accuracy of the spatial line direction estimation is evaluated using the synthetic data with different noise levels. The proposed initialization technique, where a set of directions for initialization is predefined (cf. Section 5.3.1), is compared with the initialization approach proposed by Košecká and Zhang [69], in which the initial directions are estimated directly from the line observations in the image. Both techniques are also combined with “direction priors” where the estimated directions from the previous image are used in addition. 2 Starting
from image 40. from image 60. 4 Starting from image 60. 5 Starting from image 20. 6 Images 4, 500 to 4, 600 from the left camera are used. 7 Images 3, 621 to 4, 220 from the left camera are used. 8 Images from the left camera are used. 3 Starting
59
5. Relative Pose Estimation from Lines For each image, the parallel line clustering method is executed, and the line directions calculated are compared to the ground truth. The comparison is done by calculating the line direction error ed , which is the unsigned angular distance between the ground truth d gt and the estimated direction dest . Since the number of estimated clusters may differ from the actual number, each estimated direction vector is associated with the ground truth direction which results in the smallest angular error. ed = δu d gt , dest
�
(5.22)
Circular statistics [35] are applied to calculate the mean and standard deviation of the line direction error over each sequence. The mean angle α of n angle measurements α(i) is defined as α = atan2
1 n
1 ∑ sin α(i) , n i
∑ cos α(i)
! (5.23)
i
�T ∑i cos α(i) n1 ∑i sin α(i) is the mean result vector. The circular standard deviation sα is calculated from r α as where r α =
sα =
�
q
1 n
−2 ln (kr α k) .
(5.24)
The results of this experiment are summarized in Figure 5.5. As expected, the accuracy of the estimation drops as more and more noise is added to the data. With this kind of data, it is clearly seen that using the initialization introduced here gives better results than the method of Košecká and Zhang. It can also be seen that using direction priors is advantageous as the mean and standard deviation of the angular error is reduced. The “direction prior” strategy with predefined directions is therefore chosen for all subsequent experiments.
5.6.3. Evaluation of Relative Pose Estimation In this experiment, the accuracy of the relative pose computation introduced here is compared with the “Triplet” approach [24] – the state-of-the-art using lines – and with the “5-point” algorithm [91] as the state-of-the-art representative for relative pose estimation using points. As no reference implementation is available for the
60
Line direction error ed (in °)
5.6. Experiments and Evaluation
10 8 6 4 2 0 0
0.5 Image noise σ (in °)
Predefined directions Košecká and Zhang
Predefined Dir. σ (in °)
ed
sed
0.0 0.5 1.0
0.0601 1.4737 4.3742
1.4354 5.3881 9.1884
1
Predefined directions + priors Košecká and Zhang + priors
Line Direction Error (in °) Predefined Dir. Košecká / Zhang + priors ed sed ed sed
Košecká / Zhang + priors ed sed
0.0446 0.9056 2.1647
0.0072 1.3604 8.6948
1.3339 3.0344 3.9196
6.1131 8.8763 9.6020
13.1916 14.4582 13.9660
0.2824 5.3859 14.6973
Figure 5.5.: Evaluation of the parallel line clustering and the estimated line directions for the synthetic data.
61
5. Relative Pose Estimation from Lines Triplet approach, it was implemented by the author9 . The experimental setup is as follows: The line matching algorithm described in Chapter 4 is executed for each pair of consecutive images. For the 5-point algorithm, SIFT features [79] are detected and matched. The image lines (or points) detected along with their correspondences define the input for the relative pose estimation. The estimation algorithms are executed and the resulting relative poses compared to the ground truth of the test sequences. For each tuple of ground truth pose and estimated pose, the error in rotation and translation is computed, where the rotation error eR is the angle of Rest R gt T and the translation error et is expressed as the signed angular distance (Equation (3.43)) between the ground truth translation vector t gt and the estimated translation t est . eR = arccos
! � Tr Rest R gt T − 1 2 �
et = δ t gt , t est
(5.25) (5.26)
Again, mean and standard deviation over all the sequences is calculated using circular statistics. Additionally, the execution time of each relative pose estimation algorithm is measured. The evaluation is started on the synthetic dataset using different noise levels σ. Since the synthetic datasets contains only lines, the method proposed in this thesis and the Triplet algorithm are only compared. The accuracy of the algorithms in terms of rotation and translation error is shown in Figure 5.6. The runtime behavior is presented in Figure 5.7. As expected, the accuracy of the relative pose estimation decreases as more and more noise is added to the data. For the trial without noise, the algorithm proposed here attains near perfect results whereas the Triplet approach has a slightly lower accuracy with a translation error around 3°. When adding noise, the Triplet approach achieves better results, with a rotation error which is about 0.2° lower and a translation error around 4° lower. One explanation for the inferior behavior of the method described here lies in the rotation estimation approach used: As the method estimates the rotation using the directions from the parallel line clustering, the errors in the line directions (cf. evaluation of line clustering in Figure 5.5) translate directly to errors in 9 Owing
to a bug in the implementation of the Triplet approach employed here, the results reported previously were incorrect, resulting in the Triplet approach performing less well and favoring the method used here. The results and discussions in this thesis correct this.
62
20 0.6 15 0.4
10
0.2
5
0
0 0
0.5 1 Image noise σ (in °) Triplet
σ (in °) 0.0 0.5 1.0
σ (in °) 0.0 0.5 1.0
0
0.5 1 Image noise σ (in °)
Translation Error (et in °)
Rotation Error (eR in °)
5.6. Experiments and Evaluation
This method
Rotation Error Triplet This method eR s eR eR s eR 0.0171 0.2343 0.3804
0.1146 0.2292 0.2562
0.0036 0.4224 0.6462
0.0000 0.6779 1.1081
Translation Error (in °) Triplet This method et s et et s et 2.9670 11.8063 13.2492
13.9622 26.2927 44.5489
0.5967 16.1448 18.7944
3.6409 27.4969 43.1140
Figure 5.6.: Accuracy of the relative pose computation for the synthetic sequence.
63
5. Relative Pose Estimation from Lines
Average Runtime (in ms)
40
30
20
10 0
0.5 Image noise σ (in °) Triplet
σ (in °) 0.0 0.5 1.0
1
This method
Average Runtime (in ms) Triplet This method 26.31 35.07 37.94
9.66 11.54 11.41
Figure 5.7.: Runtime analysis of the relative pose computation for the synthetic sequence.
64
5.6. Experiments and Evaluation rotation. This is not the case for the Triplet approach since the rotation is estimated directly from triplets of line observations in the image. Here, RANSAC may eventually pick a line triplet less affected by noise and therefore achieve a better rotation estimate overall. Both methods base the translation estimation on the calculated rotation, which explains the higher translation error with the method proposed here since the rotation used at the start is not as good. The method used here has one advantage, however: It is much faster, which is important for online systems like visual odometry. The execution time of the relative pose algorithm depends on the number of input feature matches. There are 30.96 matches per image pair on avarage for the synthetic dataset. Despite having the same input, the algorithm proposed in this thesis is three times faster than the Triplet approach. This is due to the fact that, in the Triplet approach, all possible O(n3 ) triplet combinations (n is the number of line matches) are generated and then tested in a RANSAC scheme to calculate the rotation, and this is very time consuming. In contrast, the rotation estimation here is based on the line directions calculated in the clustering step. With this sequence, only around 3 different line directions per image are extracted, hence the rotation calculation is very fast. The number of intersection points generated in the translation estimation step is also lower as only intersection points for lines with different spatial direction are calculated, which excludes vanishing points and favors real intersections. Using fewer points in RANSAC speeds up the estimation even more. The algorithm developed here is now evaluated on real world image sequences and its accuracy compared against the Triplet approach as before and additionally against the 5-point approach. The accuracy on the real image datasets is visualized in Figure 5.8, the runtime performance is shown in Figure 5.9. This experiment confirms the previous results. The Triplet approach achieves better results than the method proposed in this work due to the reasons given above. It also obtains better results than the 5-point algorithm on all TUM datasets, which demonstrates the suitability of line-based methods for relative pose estimation especially in highly structured surroundings. Taking a closer look at the rotation errors, it is seen that the Triplet method performs best except when used with the Oxford Corridor and KITTI sequences, where the 5-point algorithm dominates. On the HCI datasets, the method developed here achieves near perfect rotation estimates because the scene fits very well to the design of the parallel line clustering. Very precise line direction estimates are therefore obtained, which are the basis for the rotation estimation. Focusing on the translation error, the 5-point algorithm clearly outperforms
65
1.5
60
1
40
0.5
20
0
Sequence Triplet
Sequence This method
OxfordCorridor TUMPioneer360 TUMPioneerSLAM1 TUMPioneerSLAM2 TUMPioneerSLAM3 HCI_0_0000 HCI_0_0077 KITTI05
1.2308 0.7318 0.6772 0.6704 0.4831 0.0322 0.0348 0.3399
0.8537 1.3560 1.0627 2.4083 2.0582 0.0000 0.0000 0.3713
Triplet
5-Point
Rotation Error (in °) 5-Point This method eR s eR eR s eR
Triplet eR s eR
Sequence
0
Translation Error (et in °)
O xf Rotation Error (eR in °) TU TU ord M MP Co TU P i rr M io on id TU P nee ee or M ion rSL r36 Pi e e A 0 on rS M ee LA 1 H rSL M2 C A H I_0 M3 C _0 I_ 0 0_ 00 K 007 IT 7 TI 05 O xf TU TU ord M M C TU P Pi orr M io on id TU P nee ee or M ion rSL r36 Pi ee A 0 on rS M ee LA 1 H rSL M2 C A H I_0 M3 C _0 I_ 0 0_ 00 K 007 IT 7 TI 05
5. Relative Pose Estimation from Lines
1.1190 0.7559 0.7545 0.7984 0.5831 0.5994 0.1152 0.0744
0.6380 0.8062 1.0503 3.5568 1.6085 8.7049 3.5373 0.0810
1.5715 0.8426 0.9041 0.9185 0.5940 0.0352 0.0581 1.1061
Translation Error (in °) 5-Point et s et
Sequence
et
s et
OxfordCorridor TUMPioneer360 TUMPioneerSLAM1 TUMPioneerSLAM2 TUMPioneerSLAM3 HCI_0_0000 HCI_0_0077 KITTI05
21.6940 39.1231 32.2068 35.4261 45.0348 25.3052 24.1688 11.5395
6.7712 51.4581 46.4367 47.0001 57.3606 18.8696 10.0092 20.8172
5.1415 52.8364 45.2160 51.4822 58.8250 10.1912 12.0266 2.6801
3.1110 45.1679 41.2233 43.4052 49.3617 12.4241 13.1472 11.9137
0.7427 1.7828 2.3037 3.2667 2.2269 0.0000 0.0810 2.7294
This method et s et
19.2325 50.6351 46.8130 49.6455 58.3841 20.9745 26.9475 18.0136
9.3958 46.9933 44.0135 45.5643 51.4185 11.0472 21.8788 23.5677
Figure 5.8.: Accuracy of the relative pose computation for the real sequences.
66
104 103
103
102 101 100
Sequence Triplet
Sequence OxfordCorridor TUMPioneer360 TUMPioneerSLAM1 TUMPioneerSLAM2 TUMPioneerSLAM3 HCI_0_0000 HCI_0_0077 KITTI05
Sequence OxfordCorridor TUMPioneer360 TUMPioneerSLAM1 TUMPioneerSLAM2 TUMPioneerSLAM3 HCI_0_0000 HCI_0_0077 KITTI05
102
Average Matches
O xf Average Runtime (in ms) TU TU ord C M M TU P Pi orr M io on id TU P nee ee or M ion rSL r36 Pi ee A 0 on rS M ee LA 1 H rSL M2 C A H I_0 M3 C _0 I_ 0 0_ 00 K 007 IT 7 TI 05 O xf TU TU ord M M C TU P Pi orr M io on id TU P nee ee or M ion rSL r36 Pi ee A 0 on rS M ee LA 1 H rSL M2 C A H I_0 M3 C _0 I_ 0 0_ 00 K 007 IT 7 TI 05
5.6. Experiments and Evaluation
Sequence This method
5-Point
Average Runtime (in ms) Triplet 5-Point This method 1787.59 636.91 563.39 751.87 989.13 11212.11 9391.83 2667.42
1.19 1.61 1.59 1.62 1.44 7.09 5.93 2.18
38.64 20.51 22.33 22.00 25.50 57.13 76.81 44.56
Average Matches per Image Triplet 5-Point This method 84.18 67.52 65.15 72.73 81.49 195.84 193.73 109.26
180.27 208.43 188.67 190.57 232.30 2563.38 2715.03 434.99
84.18 67.61 65.15 72.73 81.49 195.84 193.73 109.26
Figure 5.9.: Runtime analysis of the relative pose computation for the real image sequences.
67
5. Relative Pose Estimation from Lines the line-based methods on the outdoor sequences. This is expected as many point features are detected due to the highly textured environment. This is not the case for the indoor sequences, especially the TUM dataset, where white walls and room structure dominate. Here, the translation error increases drastically for the 5-point algorithm and achieves similar accuracy to the algorithm proposed in this thesis. Regarding the execution time, it can be clearly seen that the greater the number of matches which need to be processed, the slower the algorithms become. The Triplet approach is of the order of one to two magnitudes slower than the approach proposed (e.g. 38 ms compared to 3, 500 ms on average) which is due to its expensive triplet calculation, as explained above. But the approach proposed is still around one order of magnitudes slower than the 5-point algorithm, which requires less than 3 ms on average. One reason is that the 5-point algorithm estimates rotation and translation in one step so only one RANSAC loop is executed. The Triplet algorithm and the approach developed here require two: One for the rotation estimation and one for the translation. Another important factor is the need for intersection points for translation estimation. The number of intersection points is of O(n2 ) for n matches. Even though there are fewer line matches than point matches (around 100 line matches compared to 200 point matches), the number of intersection points is much bigger. Overall, this experiment shows that the algorithm presented in this thesis is feasible for relative pose estimation. Although the Triplet method attains better average rotation and translation errors, the method described here has a huge advantage in that it requires much less computation time, which is important for online systems like visual odometry. In some scenarios, the method described can compete with point-based approaches in terms of accuracy but the computation time is a limiting factor.
5.7. Conclusion In this chapter, a relative pose estimation scheme based on lines has been proposed. This method can handle the two-view case as spatial lines with different directions are assumed to be present in the scene. Based on this assumption, which is weaker than the “Manhattan world” assumption often employed, the spatial line directions are calculated by means of parallel line clustering. The line directions are exploited to calculate the relative rotation. Line intersections are used in conjunction with the relative rotation to estimate the translation. Besides the mathematical derivation of
68
5.7. Conclusion the solution, an explanation is provided as to how the different steps are combined to give a robust relative pose estimation framework. In several experiments, the framework is evaluated and compared to the state-of-theart. Overall, it is shown that lines are feasible for relative pose estimation, especially in scenes with little texture as is often the case in indoor environments. Compared to the state-of-the-art line-based method, the approach proposed sacrifices a little precision (on average a 7° higher translation error and a 0.25° higher rotation error) to gain an unrivaled execution time (an average reduction from 3, 500 ms to below 40 ms). This increase in computational performance alone enables line-based relative pose estimation to be used in online systems like visual odometry.
69
6. Triangulation of Lines 6.1. Introduction Triangulation determines the position of an object in space using observations from different viewpoints and the camera projections of all views. It is a well-known problem in photogrammetry and has many applications in computer vision systems, e.g. 3D object reconstruction, SfM and SLAM. In the case of points, triangulation consists of calculating the intersection of the backprojected rays. Owing to noise in the measurements, linear or non-linear least squares methods have to be used as the back-projected rays are skew and do not intersect at one point. The triangulation concept is the same for lines: Here, the back-projected planes are intersected to recover the spatial line. Several such linear and non-linear methods were already presented [48, 4]. All these methods assume that no prior knowledge about the spatial line is available. This is not the case in this work as the direction of the line in known beforehand due to the parallel line clustering step (cf. Chapter 5). The aim here is therefore to extend line triangulation to allow the incorporation of such additional constraints. In order to achieve this, a novel, linear least squares triangulation scheme is derived from the Plücker line transformation. In addition, degenerate line configurations where the lines observed coincide or are near to epipolar lines are handled. It is proposed that spatial points along the line, which are reconstructed from optical flow (cf. Chapter 4), are included to overcome the degenerate configuration. Furthermore, pre-conditioning of the input data is considered and all methods proposed are combined in a line triangulation framework. The contributions of this work are: • a novel, linear least squares triangulation scheme for lines based on the Plücker transformation
70
6.2. Related Work • the incorporation of prior knowledge of the direction of the spatial line into the triangulation process • the handling of degenerate configurations by using spatial points from optical flow • a line triangulation framework which combines all methods proposed The chapter is organized as follows: First, related work is presented in Section 6.2. Then, in Section 6.3, a linear least squares method for line triangulation is derived from the transformation of Plücker lines. Based on this expression, Section 6.3.1 elaborates on how prior knowledge of the line direction can be included in the estimation. In Section 6.3.2, triangulation under degenerate configurations is considered. In Section 6.3.3, the pre-conditioning of the input data is dealt with. In Section 6.4, all methods are combined into one triangulation framework which chooses the best triangulation method depending on the line observation input. Finally, the framework is evaluated in Section 6.5. The conclusion and final remarks are given in Section 6.6.
6.2. Related Work A line in 3-space is uniquely defined by the intersection of two planes. The triangulation explained by Hartley and Zisserman [48] uses the back-projected plane parameters π and π 0 of image lines l i and l i0 from two different views. The reconstructed line L is then simply given in the span representation as
L=
πT π0
T
! .
(6.1)
This expression can easily be extended for more than two views: The back-projected planes of the different views are stacked into one matrix. The two right-singular vectors corresponding to the highest singular values of the matrix then define the line L. Heuel and Förstner [51] also use the intersection of back-projected planes to triangulate spatial lines but incorporate uncertainty into the estimation process. Bartoli and Sturm [4] propose triangulation procedures based on the Plücker coordinate representation. A biased version of the reprojection error is used in a linear least squares error function, where PL is the projection matrix for Plücker coordinates, L
71
6. Triangulation of Lines the line in Plücker coordinate representation and pi1 and pi2 are points on the image line observed:
L = argmin ∑ L
j
��
p i1
( j) T
( j)
PL L
�2
�
+ p i2
( j) T
( j)
PL L
�2 �
(6.2)
The problem with this method is that the solution calculated does not, in general, satisfy the Plücker constraint. Therefore, Bartoli and Sturm propose a “Plücker correction” algorithm which finds the nearest Plücker coordinate to a 6-vector. To overcome the bias in the error function, they propose a quasi-linear algorithm in which the linear method is iterated several times. After each iteration, the Plücker correction is employed and weight factors are computed to correct the bias. Instead of applying the Plücker correction, the Plücker constraint could also be modeled directly in the quasi-linear method, which gives better results. A drawback of their methods is that at least 3 line observations from different views are required to estimate L. Another iterative method is presented by Josephson and Kahl [60]. They develop a common triangulation framework for points, lines and conics based on a statistically optimal cost function which is used to find the global optimal solution. They directly include the Plücker constraint in their solution by using different relaxation techniques. A drawback of all iterative methods is that they require an initial estimate. Normally, this initial estimate is found with a closed-form solution. In the following, such a closed-form solution is presented. The triangulation method proposed here is derived directly from the transformation equation of Plücker lines. The method is designed to take the Plücker constraint into account so that no Plücker correction is necessary. Additionally, building upon the Plücker transformation makes it possible to directly introduce prior knowledge of the spatial line direction into the estimation process. A problem occurs if the line observations in the images coincide with epipolar lines. In this case, the equations are under-determined and no solution can be found. Ok et al. [93] tackle this problem and present a method to reconstruct such “near-epipolar” lines. They introduce artificial spatial points into the reconstruction process of a line which they estimate from intersection points of image lines located close to one another. The case of “near-epipolar” lines is also handled in the triangulation method used here. Additional spatial points are included which are generated from optical flow points resulting from the matching described in Chapter 4.
72
6.3. Line Triangulation from the Transformation of Plücker Lines
6.3. Line Triangulation from the Transformation of Plücker Lines In the following, linear methods to reconstruct a line wL from at least two different observations l i ( j) by cameras at pose cwT ( j) are derived. The solutions developed here have the form A wL = b based on the transformation of Plücker lines (cf. Equation (3.15)): cm c
!
d
c
=
wR
wm
+ [ ct w ] × c wR wd c R wd w
It is assumed that the Plücker line w
wL
! (6.3)
is normalized using Equation (3.8), which
c
results in d and d being unit vectors. For ease of understanding, Figure 6.1 provides a visualization of the triangulation from two views with all relevant parameters. wL
w
d
c n (1) c π (1) c n (2)
c o (1)
c π (2)
l i (2)
l i (1) c o (2)
Figure 6.1.: Visualization of the triangulation of a spatial line wL from line observations l i (1) and l i (2) . cπ ( j) is the back-projected plane of l i ( j) with normal vector cn ( j) . The reconstructed line has line direction wd .
The line observations l i ( j) have to be related to momentum cm ( j) and direction cd
( j)
in
order for the Plücker transformation to be employed. This is achieved here by using
73
6. Triangulation of Lines the line projection function from Equation (3.35), which defines � � −T l i ( j) = det K( j) K( j) cm ( j)
(6.4)
In combination with the back-projection of image lines (cf. Equation (3.42)), it is found that the normal cn ( j) of the back-projected plane coincides with the transformed momentum cm ( j) of the line (up to scale s( j) ): c ( j)
n
� � = det K( j) cm ( j)
(6.5)
s( j ) cn ( j ) = cm ( j )
(6.6)
Since s( j) is an arbitrary scale factor, cn ( j) is determined to have unit length. Substituting Equation (6.6) into the Plücker transformation definition and rearranging the equation allows s( j) to be eliminated: h i ( j) w ( j) w c ( j) c R m + t d w w wR × h h i i h i c ( j) = cn ( j ) c wR ( j ) wm + cn ( j ) tw
s( j ) cn ( j ) = 03×1
c
×
×
(6.7) c
×
wR
( j) w
d
(6.8)
The vector triple product is transformed into a series of scalar products using triple product extension: 03 × 1 =
h
=
h
c ( j)
n
i
c
×
c ( j)
n
i
c
× c
+ tw
The term ct w ( j)
�
( j) w m+ wR wR
�
( j)
( j) w
cn ( j ) T c
c ( j)
n
i h
c
×
t w ( j)
i
c
×
wR
( j) w
d
(6.9)
m
c ( j) T c
n
h
wR
( j) w
� d
−
c
wR
( j) w
� d
c ( j) T c
n
tw
( j)
� (6.10)
� ( j) w d vanishes as cn ( j) is perpendicular to cwR ( j) wd , which R w
is easily derived from the Plücker constraint: T
0 = cm ( j ) cd
= cm ( j )
Tc
c ( j) T c
∼ n
74
( j)
wR
wR
(6.11)
( j) w
( j) w
d
(6.12)
d
(6.13)
6.3. Line Triangulation from the Transformation of Plücker Lines Therefore, the following expression is obtained 03 × 1 =
h
c ( j)
n
i
c
×
wR
( j) w
m−
c
wR
( j) w
� d
c ( j) T c
n
tw
( j)
� (6.14)
from which a block of linear equations for line observation l i ( j) is formed:
�h
cn ( j )
i
c
×
wR
( j)
A ( j ) wL = b ( j ) ! � � � wm T − cn ( j ) ct w ( j ) c wR ( j ) = 03 × 1 w d
(6.15) (6.16)
Given k line observations, the overall system of linear equations A wL = b is formed by stacking the k blocks. The homogeneous system is solvable when at least two observations are available. The least-squares solution for wL is found by decomposing A using SVD into USVT = svd (A) .
(6.17)
The solution wL is then the last column of matrix V. It must have unit norm. As the Plücker line is a homogeneous entity, it is by definition invariant to scaling.
The resulting line wL fulfills the Plücker constraint as the constraint is incorporated into the derivation of the equations.
6.3.1. Integration of Spatial Line Direction Priors
In the parallel line clustering step of the relative pose estimation (cf. Section 5.3.1), the spatial line directions cd
( j)
in the current camera frame are calculated. This infor-
mation can be utilized to constrain the direction of the reconstructed line.
First, a spatial line direction prior is calculated using the direction information from the clustering step. This direction prior is then incorporated as a constraint into the triangulation.
75
6. Triangulation of Lines Line Direction Prior Estimation
Given the directions cd
( j)
in two or more views, the line direction prior wd p can be
calculated as A d ( j ) wd p = b d ( j ) i � �h �� c ( j) c R ( j) w d d w p = 03 × 1 . ×
(6.18) (6.19)
This follows directly from the transformation of Plücker lines (cf. Equation (3.15)). This expression involving the cross product is chosen over the naive solution c
wR
( j) w
d p = cd
( j)
since the signs of different cd
(6.20) ( j)
may vary. Using the cross product removes this
unwanted degree of freedom. Again, this is solved using SVD. This calculated direction prior is now used to constrain the system of linear equations discussed above (cf. Equation (6.16)).
Linear Estimation with Constraints
Linear least squares problems of the form Ax = 0 can easily be extended so that the solution sought x is additionally subjected to Cx = 0 (cf. [48]). As the problem in Equation (6.16) has the required structure A wL = 0, the aim is to express the constraints which the calculated direction prior wd p inflict on the final Plücker line in the form of C wL = 0. The first restriction is that the Plücker constraint (Equation (3.2)) should be fulfilled: w
dp
Tw
m=0
(6.21)
This constraint enforces the orthogonality between the momentum and the direction prior. Second, the direction of the line can be restricted with respect to the prior direction: �w
76
dp
w
� ×
d = 03×1
(6.22)
6.3. Line Triangulation from the Transformation of Plücker Lines The two are combined to form the constraint matrix C used here:
w
dp
T
03 × 3
01×3 �w � dp ×
!
C w L = 04 × 1 ! wm = 04 × 1 w d
(6.23) (6.24)
The constraint is now incorporated into the estimation. First, it is ensured that C is square by adding two rows of zeros. The orthogonal complement of the row space Co of C is calculated with singular value decomposition: USVT = svd (C)
(6.25)
The orthogonal complement of the row space Co then consists of the last 6 − r columns of V, where r is the rank of C. In this case, r = 3 and the last three columns are used. The next step is to solve ACo y = 0
(6.26)
using SVD. The final result is then calculated as
L = Co y
(6.27)
6.3.2. Triangulation under Degenerate Configurations When the line observations coincide with epipolar lines, the solution space for wL is the whole epipolar plane: A degeneracy occurs. This problem is far more severe than the degeneracy for point triangulation, where only points along the baseline cannot be recovered. Here, every line which lies on an epipolar plane is not reconstructable. This includes every line parallel to the direction of the camera motion. This is shown in Figure 6.2. To underline the severity of this problem, a typical automotive scene is considered where the car follows a straight road. In this scenario, all lane markings are impossible to triangulate from line observations since the car’s motion is aligned with the lanes. This is visualized in Figure 6.3 by coloring the angular distance of the line observations to their corresponding epipolar lines. If a line coincides (or is near to) an epipolar line, it suffers from degeneracy.
77
6. Triangulation of Lines
(2)
ei c o (2)
epipolar plane
l i (2) c π (2)
(1) ei c o (1)
l i (1)
wL
c π (1)
Figure 6.2.: In a degenerate configuration, the back-projected planes cπ (1) and cπ (2) coincide with the epipolar plane. The image line l i ( j) contains the epipole ( j) ei and is therefore an epipolar line.
Figure 6.3.: Visualization of the angular distance from each line segment detected in the image to its corresponding epipolar line. The color indicates the angular distance, where yellow is “near” and green “far” from the epipolar line. The blue point marks the epipole.
78
6.3. Line Triangulation from the Transformation of Plücker Lines How can these degenerate configurations be avoided? This thesis uses the idea of Ok et al. [93] and integrates point measurements into the estimation. But there is no need to create artificial points from line pairs as Ok et al. do, since point matches are calculated with optical flow during line matching (cf. Chapter 4). These optical flow measurements are used to triangulate spatial points that are then employed in the line triangulation process. In the following, an explanation is given of how spatial points are incorporated into the line triangulation process. The linear estimation here is derived from the incidence relation between a spatial point p and a line L. The point lies on the line if (cf. [50]) Γ¯ (L)
p 1
!
= 04 × 1
(6.28)
with Γ¯ (L) the dual Plücker matrix of L: Γ¯ (L) =
− [d]× −m mT 0
! .
(6.29)
The point-line incidence equation is rearranged to separate L:
− [ wd ] × − wm wm T 0
!
wp
1
!
= 04 × 1
! − [ wd ] × w p − wm = 04 × 1 wm T w p ! ! wm − I 3×3 [ w p ] × = 04 × 1 w wpT 01×3 d
(6.30) (6.31) (6.32)
Thus, one spatial point w p ( j) contributes the following block of linear equations:
− I 3×3 w p ( j) T
h
w p ( j)
A ( j ) wL = b ( j ) ! wm × = 04×1 w d
(6.33)
i
01 × 3
(6.34)
Stacking the blocks of different points results in the final matrix A. The line wL can be retrieved from the matrix using SVD when at least two points are available.
79
6. Triangulation of Lines In this case as well, it is of course possible to integrate a line direction prior. The first step is to calculate the direction as explained in Section 6.3.1. The momentum is then calculated from the point-line incidence relation as before: A m ( j ) wm = b m ( j ) h i ! w w p ( j) � � dp I 3×3 wm = × w p ( j) T 0
(6.35) (6.36)
At least one point is required to solve wm when a direction prior is used.
Testing for Degenerate Configuration To determine if line observations correspond to a degenerate configuration, the test proposed by Ok et al. [93] is used. In this test, the angle between line observation and corresponding epipolar line is calculated. If this angle is less than 10°, the line segment is assumed to be near-epipolar and therefore classified to be in a degenerate configuration for triangulation. The angle γ(l i , el ) between the line observation l i and the corresponding epipolar line el is the unsigned angular distance (Equation (3.44)), where dli is the 2-dimensional direction vector of the line segment observed and de the direction vector of the epipolar line: γ(l i , el ) = δu (dli , de )
(6.37)
The corresponding epipolar line of the line segment is composed of the epipole ei and the endpoints of the line segment. For each endpoint, the epipolar line containing the epipole and the endpoint is constructed. Then, the angles between the line segment and the two epipolar lines are calculated using Equation (6.37). The epipolar line with the smaller angle is then taken as the corresponding epipolar line for the line segment. Line segment and corresponding epipolar line are visualized in Figure 6.4.
6.3.3. Pre-Conditioning The normalization of the data is an important step to ensure the quality of the results by enforcing a low condition number on the linear equation system. A high condition
80
6.3. Line Triangulation from the Transformation of Plücker Lines
ei l i (1)
e l (2)
l i (2)
e l (1)
γ ( l i (1) , e l (1) )
γ ( l i (2) , e l (2) )
Figure 6.4.: Line segments l i ( j) with their endpoints are shown in black. The epipole ei is indicated in blue. The dashed colored lines from the epipole to the line segment endpoints define the epipolar lines. The epipolar line with lower angle γ(l i ( j) , el ( j) ) defines the corresponding epipolar line el ( j) . number indicates very different orders of magnitude in the coefficients of the A matrix of the equation system. Hartley and Zisserman [48] argue that a high condition number on noisy data serves to amplify the divergence from the correct result. The aim here is therefore to transform the input data so that the data coefficients are in a similar range. The pre-conditioning is demonstrated on the standard triangulation approach h i given in Equation (6.16). As cn ( j) is scaled to unit length, the term on the left
cn ( j )
c
×
wR
( j)
will only contain numbers in the range [−1; 1]. Since the translation ct w ( j) takes arbitrary values and is not bound like the normal vector or the rotation � matrix, �its maximum component defines the range of the term on the right −
cn ( j ) T ct ( j ) w
c
wR
( j)
.
Assuming the maximum value of ct w ( j) is 1, 000, the term on the right would then hold numbers in the order of magnitude of 103 , while the term on the left would contain values in the order of magnitude of 100 . How can the input be transformed so that all values are in the same range? It can be modified in such a way that the translation is in the same range as the rotation and normal vector. This is achieved by first shifting the camera positions so that their centroid is at the origin. In a second step, the camera positions are scaled so that the average distance to the origin is 1. With the modified camera poses, the triangulation method described is followed. Finally, the transformation on the triangulated line must be reversed by rescaling the momentum and shifting the line back from the origin to the centroid. The whole conditioning process is explained in Algorithm 6.1.
81
6. Triangulation of Lines Algorithm 6.1 Line triangulation using Plücker transformation with conditioning of input data. nh i o c R ( j) , ct ( j) camera pose of image I ( j) , T = n Input: T ← | | w w n o Input: L ← l i ( j) observed line in image I ( j) T
← centroid of all camera positions wc ( j) = − cwR ( j) ct w ( j) s∅ ← average distance of all camera positions wc ( j) to wc∅ for all camera poses [ cwR , ct w ] ∈ T do wc ← − c R T ct the camera position w w 1 w wc w cond ← s∅ ( c − c∅ ) w ct c w cond ← − wR ccond the conditioned translation Append [ cwR , ct w cond ] to set of conditioned camera poses Tcond end for �T � Calculate spatial line wLcond = wmcond T wdcond T by solving the linear equation (6.16) (or (6.27) when direction prior is available) using all normalized camera poses in Tcond and the corresponding line observations in L . Normalize wLcond using Equation (3.8) w w wm ← s wm cond + c∅ × dcond reverse conditioning �∅ �T T wL ← w T w m dcond wc
∅
The conditioning can be transferred to the triangulation in degenerate cases (Equation (6.34)). Here, the spatial points can take arbitrary values, which leads to an unbound condition number. The points are therefore transformed. A strategy similar to the one already explained can be followed and all points are shifted so that their centroid lies at the origin. All points are then scaled so that their average distance to the origin becomes 1. The triangulation method is applied using the normalized points and the normalization on the solution obtained reversed. The details are listed in Algorithm 6.2.
6.4. Triangulation Framework
The triangulation framework combines the line triangulation methods explained and chooses the best one according to the input. The framework is explicitly designed for the triangulation of a spatial line from two observations. The pseudocode of the framework is given in Algorithm 6.3.
82
6.4. Triangulation Framework
Algorithm 6.2 Line triangulation method under degenerate configuration with conditioning of input data. Input: P ← all spatial points w p ( j)
← centroid of all points ∈ P s∅ ← average distance of all points w p ( j) to w p∅ for all points w p ∈ P do � 1 w wp p − w p∅ cond ← s∅ w Append pcond to set of conditioned points Pcond end for �T � Calculate spatial line wLcond = wmcond T wdcond T by solving the linear equation (6.34) (or (6.19) and (6.36) when direction priors are given) using all normalized points in Pcond . Normalize wLcond using Equation (3.8) w wm ← s wm w ∅ cond + p∅ × dcond reverse conditioning � �T T wL ← w T w m dcond wp
∅
Algorithm 6.3 Line triangulation framework with two observations of a spatial line. i o nh c R ( j) , ct ( j) camera pose of image I ( j) , T = 2 Input: T ← | | w w n o Input: L ← l i ( j) observed line in image I ( j) el ( j) ← calculate corresponding epipolar line for all l i ( j) ∈ L if for at least one γ(l i ( j) , el ( j) ) < 10° then Degenerate configuration detected. Pi ( j) ← optical flow points from line matching step (cf. Section 4.3) for l i ( j) if |Pi ( j) | = ∅ then return without solution end if P ← triangulate corresponding optical flow points in both cameras. L ← triangulate line using Algorithm 6.2 for degenerate configuration. else L ← triangulate line using Algorithm 6.1. end if return L
83
6. Triangulation of Lines
6.5. Experiments and Evaluation
The triangulation method proposed here is evaluated both qualitatively and quantitatively on the Oxford Corridor sequence and the HCI benchmark suite dataset 0_0000 (cf. Section 5.6.1) and compared to a simple plane intersection approach (e.g. from Hartley [48]). These sequences are chosen as they come with ground truth information which allows the quantitative evaluation. The Oxford Corridor sequence already comes with a set of spatial line segments and their observations in the images. For the HCI dataset, the spatial lines per image pair are generated on the basis of the ground truth optical flow information provided. The ground truth information is visualized in Figure 6.5.
(a)
(b)
(c)
(d)
Figure 6.5.: Visualization of the ground truth spatial lines for Oxford Corridor and HCI 0_0000 datasets.
84
6.5. Experiments and Evaluation
6.5.1. Qualitative Analysis For the qualitative analysis, a visual comparison is done of the triangulation results of the plane intersection triangulation approach and the full triangulation framework presented including direction prior information and detection of degenerate configurations, as shown in Figures 6.6 and 6.7.
(a)
(b)
(c)
(d)
Figure 6.6.: Qualitative comparison of plane intersection-based triangulation (left) and the triangulation framework presented (right) on the Oxford Corridor dataset in front view (top) and side view (bottom).
It is observed that the plane intersection approach has problems in reconstructing lines in a degenerate configuration, e.g. the lines in the direction of the motion which are marked with purple ellipses. The approach presented here successfully reconstructs these lines, which is highlighted accordingly. Furthermore, the inconsistency in the line directions (green ellipses) in the plane intersection method can be seen as no prior direction is incorporated. This is clearly resolved with the algorithm proposed here. This qualitative evaluation suggests that the method proposed here is
85
6. Triangulation of Lines
(a)
(b)
(c)
(d)
Figure 6.7.: Qualitative comparison of plane intersection-based triangulation (left) and the triangulation framework presented (right) on the HCI 0_0000 dataset in front view (top) and side view (bottom).
86
6.5. Experiments and Evaluation able to include line direction priors successfully and can also handle degenerate configurations better.
6.5.2. Quantitative Analysis The aim now is to evaluate the method developed here quantitatively and compare it to the plane intersection method. Two measurands are considered: The line direction error ed and the line distance error ed . The line direction error is the unsigned angular distance between ground truth line direction d gt and triangulated line direction dest . The line distance error is the minimal distance between any two points of ground truth L gt and estimated line Lest (cf. Equation (3.48)). � ed = δu d gt , dest � ed = d L gt , Lest
(6.38) (6.39)
The triangulation is executed on every consecutive pair of images of each sequence, and the line direction and line distance errors are calculated. The circular mean ed and standard deviation sed of the line direction error are reported as defined in Equations (5.23) and (5.24). The line distance error is displayed as the mean dr and standard deviation sdr of the relative error dr . The relative error relates the line distance � error and the distance of the ground truth line to the origin do L gt (cf. Equation (3.46)): � dr L gt , Lest =
ed � do L gt
(6.40)
The results for both methods are shown in Figure 6.8. Comparing the line directions of the two methods, it is clearly shown that the integration of direction priors has a high impact. With the integration of direction priors, the average line direction error is decreased from 26° to 12° on the Oxford Corridor sequence and from over 52° to around 13° on the HCI dataset. Although the two sequences are very different (the Oxford sequence shows an indoor sequence with all lines relatively close to the camera whereas in the outdoor scenario of the HCI dataset the objects are rather distant), it can be seen that with the method described here the line direction error stays at a comparable level. But the improvement in line direction error comes at a price – the method proposed here has a greater line distance. The relative distance is increased from around 3 % to 16 % for the Oxford sequence
87
0.2
20
0.1
0 00 0_ 00
or id
C I_
O
H
H C
or r
or or dC xf O
xf or dC
or
I_ 0_ 00 00
0
Sequence
Sequence
Plane intersection
Sequence OxfordCorridor HCI_0_0000
Sequence OxfordCorridor HCI_0_0000
This framework
Line Direction Error (in °) Plane intersection This framework ed sed ed sed 26.1161 52.6888
22.3266 25.8910
12.0560 13.1684
15.5077 22.0199
Line Distance Error Plane intersection This framework dr sdr dr sdr 0.0335 0.0000
0.0620 0.0001
0.1630 0.2573
0.5201 2.2172
Figure 6.8.: Accuracy of the triangulation.
88
Line Distance Error (dr )
40
rid
Line Direction Error (ed in °)
6. Triangulation of Lines
6.6. Conclusion and from 0 % to 25 % for the HCI dataset compared to the standard plane intersection approach. This increase can be explained by the linear estimation process itself. As the direction is constrained to the direction prior calculated, the estimation is restricted to finding a linear least squares solution for the momentum. The momentum encodes the distance of the line to the origin (cf. Equation (3.46)) and therefore also the distance between lines. Finally, the numbers of degenerate configurations detected are presented: For the HCI 0_0000 dataset there were 11, 813 triangulation attempts overall, of which 2, 828 were detected as being in a degenerate configuration. This is around 24 %. For the Oxford Corridor sequence, the triangulation process was called 545 times, of which in a degenerate configuration was detected in 49 cases. This is around 9 % of all attempts.
6.6. Conclusion In this chapter, closed-form line triangulation methods based on the definition of Plücker line transformation have been presented. Using the Plücker line transformation allowed the easy integration of the Plücker constraint and prior knowledge of the direction of the spatial line, which is derived from the estimated directions calculated during parallel line clustering in relative pose estimation (cf. Chapter 5). Furthermore, the problem of degenerate line configurations has been tackled and a proposal made to leverage the optical flow point matches from the line matching step (cf. Chapter 4) to generate spatial points along the line which are integrated into the triangulation process. To mitigate the influence of differently scaled data, it has been proposed that the camera poses or spatial points be pre-conditioned. Lastly, all methods proposed have been combined to a line triangulation framework for triangulation from two views. The framework proposed has been evaluated qualitatively and quantitatively and compare to standard plane intersection line triangulation. In the experiments, the positive effects of using direction priors and handling degenerate configurations has been shown.
89
Part II.
Systems for Visual Localization
7. Visual Odometry with Lines 7.1. Introduction The Oxford dictionaries define odometry as “Measurement by an odometer of distances travelled”. If this definition is transferred to the computer vision domain, visual odometry aims to estimate the motion of a moving camera. Visual odometry is a dead reckoning system as the displacements between consecutive camera views are accumulated to build the trajectory. The ability to determine the camera motion is very important for robotics and augmented reality applications, for example. Visual odometry is heavily used in robotics because it is not affected by wheel slip and other degenerating effects as is the case for wheel odometry. It has been shown that VO is capable of providing more accurate trajectories than wheel odometry [97]. Most of the VO systems proposed rely on point features. First, features are detected and then matched between consecutive frames. In a typical monocular pipeline, the relative pose is estimated using the first images to bootstrap the local map. Once a local map is available, the camera pose with respect to the map is estimated using the perspective-n-point problem. Finally, sliding-window bundle adjustment is used to smooth map and trajectory locally. Very little work has been done on line-based visual odometry, however. Approaches using stereo camera systems have been proposed [118, 57], but monocular systems have so far been ignored. This thesis aims to close this gap and investigates monocular line-based visual odometry. The solution presented here calculates the frame-toframe motion by using the novel line matching (cf. Chapter 4) and the relative pose estimation proposed (cf. Chapter 5). As the relative pose is scale ambiguous, the scale between different image pairs has to be adapted. The proposal made here is to derive the scale adjustment from the trifocal tensor. Sliding-window bundle adjustment on a local map is used to smooth the trajectory. The local map is constructed from spatial lines which are triangulated using the framework presented (cf. Chapter 6).
91
7. Visual Odometry with Lines The contributions of this work are: • a novel scale adjustment scheme for lines based on the trifocal tensor • adaptation of sliding-window bundle adjustment for line-based visual odometry • the first line-based visual odometry framework for monocular cameras A preliminary version of the visual odometry pipeline has been published previously in [111]. The chapter is structured as follows: Related work is summarized in Section 7.2. In Section 7.3, the structure of the visual odometry system proposed here is explained. It includes a description of the novel scale estimation scheme (Sections 7.3.1 and 7.3.2) and of the sliding-window bundle adjustment strategy (Section 7.3.3). The framework developed here is evaluated and compared to a state-of-the-art system in Section 7.4. The chapter is concluded in Section 7.5.
7.2. Related Work Although the term “visual odometry” was coined by Nister et al. [92] in 2004, research on the topic began more than 20 years earlier. One of the first publications is from Moravec [87] who describes a so-called “slider stereo” system (one camera which can slide horizontally to mimic a stereo camera) mounted on a robot rover. The robot stops every meter, takes 9 images with the slider stereo at this position, extracts and matches features along the epipolar lines using normalized cross correlation, and uses the disparity information derived to create spatial points. At the next position, 9 new images are taken and correlation-based matching with the previous image set is used to find the feature points again. Then, the spatial points are recalculated from the new position and the relative motion is calculated from the coordinate transformation which relates the two point sets. Moravec’s work has been extended in several ways, e.g. by Matthies and Shafer [84] who incorporate a more accurate error model for triangulation, or by Olson et al. [94] who use the Förstner corner detector to speed up the feature extraction. Additionally, they include an absolute orientation sensor (e.g. compass) to increase the overall accuracy. These early approaches led to visual odometry being applied to the Mars rovers Spirit and Opportunity [81].
92
7.2. Related Work Yet another feature selection scheme is presented by Lacroix et al. [71] who first calculate a dense disparity map and, in a second step, select candidate points which are good for tracking by calculating the similarity to neighboring pixels. Milella and Siegwart [86] also use a dense stereo algorithm but select interest points with the Shi-Tomasi feature detector [100]. Besides, ICP [10] is used to refine the motion estimate. All stereo methods presented so far have a common feature in that they estimate the motion by aligning the spatial point clouds from two stereo pairs. Nister et al. [92] propose instead that the perspective-n-point problem be used to do 2D-3D absolute pose estimation, which gives more accurate results. Another class of visual odometry algorithms uses monocular cameras. The main difference between stereo and monocular algorithms is that a monocular camera alone cannot provide the absolute scale. Therefore, the distance between the first two images is usually set to 1. Nister et al. [92] present a monocular visual odometry scheme in addition to their stereo approach. Here, features are tracked at first over multiple images to estimate the relative pose with a robust version (e.g. using RANSAC) of the 5-point algorithm [91]. The features tracked are then triangulated and used for 2D-3D pose estimation as in the stereo case. To further increase the accuracy, sliding-window bundle adjustment could be used as proposed by Zhang and Shan [126] and Mouragnon et al. [88]. Tardif et al. [105] decouple the estimation of rotation and translation in the 2D-3D pose calculation. They argue that relative pose estimation should be taken into account as the number of image-to-image point correspondences is much higher than the number of spatial points tracked. Additionally, points far away from the camera tend to be inaccurate in position but their orientation information is still reliable. They therefore calculate the rotation with the 5-point algorithm. The absolute translation is then estimated from the triangulated points while the rotation is kept constant. Monocular approaches suffer not only from drift in orientation and position, which is natural in a dead reckoning system, but also from drift in scale. Numerous methods have been proposed to reduce the scale drift. Fraundorfer et al. [38] introduce a bundle adjustment scheme in which only the scale factors are optimized. Initially, all scale factors are set to 1 and in each iteration all features tracked are triangulated using the current scale estimates. From the triangulated points, the reprojection error
93
7. Visual Odometry with Lines is then calculated and minimized. Esteban et al. [29] calculate a least-squares scale estimate for relative poses directly from known 2D-3D correspondences. All methods discussed above rely on some kind of feature extraction and matching technique from which the relative or absolute pose is estimated. Another class of algorithms calculates the pose directly from the photometric information in the images without the abstraction to features. This class is therefore called direct visual odometry. Prominent examples from this group are the methods of Engel et al. [25, 28] and Forster et al. [36]. Engel et al. [25] retain a probabilistic estimate of the inverse depth for every edge pixel in the image. This inverse depth is propagated to the next image by finding the relative displacement which minimizes the photometric error. The inverse depth map is constantly updated with new disparity values found by a 1-dimensional search along the epipolar line. The disparity estimation allows the baseline to be adapted on a per-pixel basis which enables accurate inverse depth estimation for distant and adjacent regions. Forster et al. [36] present a “semi-direct” method named “SVO” in which FAST corners [95] are detected to initialize new spatial points. But once the points are initialized, they rely on direct motion estimation and minimize the photometric error between the image patches around the spatial points projected. The feature correspondences are therefore given implicitly through the alignment process. Bundle adjustment is performed as in normal feature-based approaches to refine pose and structure. Until now, only point-based visual odometry methods have been covered. But in recent years, line-based methods have also been proposed, and will be discussed now. Witt and Weltin [118] present a line-based visual odometry algorithm using a stereo camera. The relative motion between consecutive stereo pairs is estimated by a nonlinear optimization of the spatial line reconstruction similar to ICP, which they call “ICML”. Holzmann et al. [57] propose another line-based visual odometry pipeline for stereo cameras. They take their inspiration from direct methods and calculate the displacement between two camera poses by minimizing the photometric error of image patches around vertical lines. A more detailed overview of visual odometry methods is given in the tutorials of Scaramuzza and Fraundorfer [97, 37].
94
7.3. Structure of the Visual Odometry System As far as the author is aware, the line-based visual odometry system for monocular cameras proposed here is the first of its kind. The method is based on relative motion estimation between consecutive frames. To calculate a consistent scale, a novel scale adjustment based on the trifocal tensor is presented. Finally, sliding-window bundle adjustment is integrated to optimize the estimates.
7.3. Structure of the Visual Odometry System The structure of the visual odometry system proposed here is illustrated in Figure 7.1.
Camera
Visual Odometry no, set first two images as scale reference images
no Start
Line Acquisition
yes
Line Matching
Relative Pose Estimation
two or more images processed?
has scale reference images?
no End
Sliding Window Bundle Adjustment
yes
Scale Estimation
yes
last image?
Trajectory
Figure 7.1.: Processing pipeline of the visual odometry. Solid lines link the different processing steps. Dashed lines mark relevant data exchange between the modules. Failure cases are not shown here.
The processing starts with the detection of line segments in the current image of the camera stream. The line extraction algorithm used is from Witt and Weltin1 [118] where edges are detected using the Canny detector [13] and then split into line segments using the Douglas-Peucker algorithm [20]. It is worth mentioning that any 1 Many
thanks to the authors for the courtesy of providing their code.
95
7. Visual Odometry with Lines other line detection algorithm would work, e.g. the LSD algorithm from von Gioi et al. [110] or EDLines from Akinlar and Topal [2]. The line matching algorithm is executed for each pair of consecutive images, as discussed earlier in Chapter 4. Transitivity is used to link line matches over multiple image pairs. These line observations over various images are called tracks. Once the line matches are found, the relative pose estimation algorithm from Chapter 5 is executed to recover the relative motion between the consecutive frames. If the relative pose estimation fails for some reason (e.g. not enough line matches found), the relative pose estimated previously is used as constant velocity is assumed. The relative pose has no meaningful scale, hence it has to be adjusted to reflect the real distance traveled. The trifocal tensor is exploited to estimate the scale based on previous measurements; this is described in the next Section 7.3.1. A scheme for selecting previous measurements for the scale estimation – the so-called scale reference images – is discussed thereafter in Section 7.3.2. Until now, the camera pose has only been derived from a very small number of measurements (e.g. from the neighboring frame for relative pose estimation). It is important to take more measurements into account to gain robustness. A sliding-window bundle adjustment is therefore employed to refine the estimated poses. The method is described in Section 7.3.3.
7.3.1. Scale Estimation from Trifocal Tensor The relative pose computation does not provide a scale, but in order to calculate a consistent trajectory, the translation part has to be scaled in respect of previous estimates. The proposal here is to use the trifocal tensor to link the current relative pose estimate with the preceding poses of the trajectory. A short introduction to the trifocal tensor is given before the proposed scale estimation scheme is explained.
The Trifocal Tensor The trifocal tensor can be understood as an extension of the fundamental matrix which describes relations between three views. As the fundamental matrix encodes the relative displacement between two views, so the trifocal tensor encodes the displacements between three views. What is useful for this work is that the trifocal tensor preserves the relative scaling of the displacements between the views. This is
96
7.3. Structure of the Visual Odometry System exploited here. In the following derivations, the simplified tensor notation of Hartley and Zisserman [48] is followed. Three views c1 , c2 and c3 are defined where c1 is the reference view and c2 and c3 are positioned relative to it with transformation matrices c2
c2
c1 T
=
c1 T
c2
=
c1 R
t c1
c1 T
and
c3
c1 T
as
! (7.1)
1
0 1×3 c3
c3
c1 R
c2
c3
t c1
! .
1
0 1×3
(7.2)
The trifocal tensor is then described by three matrices Γ(i) where r c j (i) is the i-th column of
cj
c1 R :
Γ ( i ) = r c2 ( i ) c3 t c1 T − c2 t c1 r c3 ( i )
T
(7.3)
The incidence relation between the observations of a line wL in all three views with back-projected plane normals c1 n , c2 n and c3 n is then given up to scale by c1
ni ∼ c 2 n T Γ ( i ) c 3 n
(7.4)
where c1 ni is the i-th entry of c1 n . D E The notation Γ(i) is introduced to denote the concatenation of the previous equation for all three indices to form the vector c
2
n T Γ (1) c3 n
c1
n ∼ c2 n T Γ (2) c3 n c2 n T Γ (3) c3 n D E c1 n ∼ c2 n T Γ ( i ) c3 n .
(7.5)
(7.6)
The vector cross product is applied to both sides to remove the scale ambiguity and this then gives 03 × 1 = c 1 n ×
�
c2 T
n
D
Γ (i )
E
c3
n
�
.
(7.7)
A thorough discussion of the trifocal tensor is given by Hartley and Zisserman [48].
97
7. Visual Odometry with Lines Derivation of Linear Scale Estimation from Trifocal Tensor
As the trifocal tensor has now been introduced, a linear equation system will be derived from the incidence relation (7.7) to find the unknown scale adjustment factor s which scales c3 t c1 according to c2 t c1 . First, c3 t c1
t3 =
c3 t c 1
(7.8)
is defined so that c3
t c1 = st 3 .
(7.9)
Inserting the definition of the trifocal tensor (7.3) and (7.9) into the incidence relation (7.7) results in 03×1 = c1 n ×
�
c2 T
n
D
r c2 (i) st 3 T − c2 t c1 r c3 (i)
T
E
c3
n
�
.
(7.10)
This equation is rearranged to separate the unknown s: E � T r c2 (i) st 3 T − c2 t c1 r c3 (i) c3 n E D E � � D T 03×1 = c1 n × c2 n T r c2 (i) st 3 T c3 n − c2 n T c2 t c1 r c3 (i) c3 n � D E � � D E � T 03×1 = c1 n × c2 n T r c2 (i) st 3 T c3 n − c1 n × c2 n T c2 t c1 r c3 (i) c3 n � � D E �� � � � � D E �� c1 n × c2 n T r ( i ) t T c3 n c1 n × c2 n T c2 t r ( i ) T c3 n = s c2 3 c1 c3
03×1 = c1 n ×
�
c2 T
n
D
(7.11) (7.12) (7.13) (7.14)
This yields a linear equation block for one line observation across three views: A( j) s = b( j) � D E �� � � � � � D E �� T c c1 n × c2 n T r ( i ) t T c3 n s = c1 n × c2 n T 2 t c1 r c3 ( i ) c3 n c2 3
(7.15) (7.16)
A system of linear equations As = b is formed by stacking the A( j) and b( j) blocks of different line observations. This system is solvable when at least one line observation across three views and the transformations c2 c1 T and c3 c1 T are known. A unique solution does not exist when the line observed coincides with an epipolar plane between c1 and c2 or c1 and c3 . In this case, either c2 n T c2 t c1 or t 3 T c3 n is equal to 0.
98
7.3. Structure of the Visual Odometry System This scale estimation is applied in a RANSAC scheme. All lines which can be tracked over all three views are used. One of the line observations is selected at random and the scale factor is calculated using the method described. To test this scale factor, all lines are triangulated using the observations in camera c1 and c2 and the reprojection error in c3 is calculated where the pose of c3 is scaled using the estimated factor. RANSAC then selects the scale estimate with the lowest reprojection error overall. The RANSAC solution is refined in a last step using nonlinear optimization.
7.3.2. Reference Image Selection for Scale Estimation This section describes the strategy to select the two reference images which serve as c1 and c2 in the scale estimation. This step is crucial to the overall performance of the visual odometry as it has a strong influence on the scale drift which is inherent in monocular visual odometry systems. Scale drift is understood as the error in the calculated scale due to small errors in all estimations which are propagated through the lifetime of the system. The approach proposed takes its inspiration from the keyframe selection of ORBSLAM [90]. Although its keyframe selection method is used to determine whether a frame should be added to the map of the SLAM system, the basic concept also applies to the problem at issue here. The idea is to update the reference image once the visual difference between the last reference image and the current frame becomes “big enough” while ensuring that enough lines are still trackable. As the scale estimation here is based on the trifocal tensor, two reference frames r1 and r2 are always retained. To decide whether the older reference image r1 needs to be updated when the new frame f is processed, the number of line tracks between the current reference images mr1 ,r2 are counted. This number is compared with the number of lines that can be tracked from r1 up to the current frame f mr1 , f . This number has a maximum value as high as mr1 ,r2 . The interest now focuses on the ratio of trackable lines in the current frame to the trackable lines between the reference images. If this ratio drops below a certain threshold, r1 is replaced by r2 and frame f is set as the new reference image r2 . mr 1 , f < mth mr1 ,r2
(7.17)
The reference image selection is visualized in Figure 7.2
99
7. Visual Odometry with Lines
r1
r2
f
Figure 7.2.: The two reference images r1 and r2 and the current frame f are shown with the extracted lines in each image. The green connections mark which lines are tracked over the different images. In this example mr1 ,r2 = 4 and mr , f mr1 , f = 2. The ratio is therefore mr 1,r = 24 = 0.5. 1 2
The reference image selection is executed after each scale estimation. When the pipeline is started, the first two images are used as reference frames. The distance between the first camera poses is fixed to 1.
7.3.3. Sliding-Window Bundle Adjustment Until now, only one or two preceding images were taken into account for the pose estimate of the current image (e.g. one in relative pose estimation or two for scale estimation). This section proposes a local bundle adjustment scheme which incorporates the measurements of more images to improve the overall accuracy of the estimated poses. Given initial estimates of camera poses
c
wT
( j)
, spatial points w p (k) and their observa-
tions pi ( j,k) in the images (where the k-th spatial point is measured in the j-th image), bundle adjustment simultaneously refines the camera poses and the spatial points by minimizing the reprojection error (cf. Equation (3.49)): argmin c
� �2 ( j,k) ( j) w (k) $ p , P , p ∑ i
(7.18)
( j) w (k) j,k wT , p
P( j) is the projective mapping for camera j as defined in Section 3.4.3. In structure from motion, it is also common to optimize the calibration matrices of each camera as well. Since it is assumed in this thesis that the calibration is known beforehand and stays constant over the runtime of the pipeline, it is not included in the optimization. Overall, this is a nonlinear function which requires the use of nonlinear least squares algorithms like Levenberg-Marquardt [82]. As lines are used, this objective function has to be reformulated. A naive way to adapt it is by representing a spatial line wL (k) by two points w p1 (k) , w p2 (k) and using
100
7.3. Structure of the Visual Odometry System the point-line distance defined in Equation (3.45) between the projected spatial point and the line observed in the image l i ( j,k) as the error measure:
c
� � �2 � �2 � ( j,k) ( j) w (k) (k) ( j) w (k) argmin ∑ d l i ,P p1 + d li , P p2
wT
( j) , w L (k)
(7.19)
j,k
A drawback of this method is that the spatial line representation is overparameterized: 6 parameters are required to represent a line with two points but a line has only 4 degrees of freedom. This overparameterization affects the update step of the optimization as the updated points could still represent the same line as before, e.g. when they just shift along it. This affects the speed and reliability of the optimization greatly, which is why Triggs et al. [107] state that “the most suitable parametrizations for optimization are as uniform, finite and well-behaved as possible near the current state estimate”. There exists no simple global parametrization for spatial lines as is the case for points. All expressions have more parameters than the degree of freedom suggests and therefore require constraints which must be satisfied to form a valid line, e.g. the Plücker constraint. Different parametrizations are discussed in [4]. This resembles the difficulty in representing rotations in bundle adjustment, e.g. rotation matrices consist of 9 parameters but have only 3 degrees of freedom. It is obvious that not every 3 × 3 matrix represents a rotation, therefore internal constraints between the parameters must be fulfilled. To circumvent these difficulties, one tries to find a local parameterization which is minimal and therefore free of constrains from which the current estimate could be updated. For rotation matrices, it is common to use local perturbations for the update like R ← R∂R with ∂R = I + [r ]× where r is a 3-vector (cf. [107]). Regarding lines, the literature provides different methods for a minimal 4-parameter update of Plücker lines. Bartoli and Sturm [4] develop an update scheme for Plücker lines using an “orthonormal representation”. These 4 parameters have geometrical meaning and encode angles which are used to transform the line in space. Zhang and Koch [124] propose another 4-parameter update for Plücker lines based on the Cayley transform. The reprojection error (cf. Equation (3.50)) which is optimized is the same as previously defined in Equation (7.19) but with the terms measurement in the image and spatial estimate meaning something different: Here, the measurements in the images are points on the observed line segment p1i ( j,k) and p2i ( j,k) (usually the line segment
101
7. Visual Odometry with Lines endpoints) corresponding to camera j and spatial line estimate wL (k) :
∑$ ( )
argmin c
( j) w wT , L
k
j,k
�
p1i ( j,k) , p2i ( j,k) , PL ( j) , wL (k)
�
(7.20)
In the implementation employed here, Plücker lines in orthonormal representation from [4] are used with the 4-parameter update and the objective function is optimized as given in Equation (7.20). The endpoints of the line segments detected are used as image points. To increase the stability in respect of outliers, the Cauchy cost function is used as the robust cost function in the optimization. As bundle adjustment has now been introduced, the sliding-window strategy employed here is described next. Whenever the visual odometry process selects new scale reference frames (cf. Section 7.3.2), a new local map is calculated which is constantly optimized using bundle adjustment. This local map consists initially of the camera poses of two scale reference images r1 and r2 and all spatial lines which are reconstructed from the common line observations between these images using the triangulation framework from Chapter 6. This local map is extended by adding the camera poses of the last w processed images and the observations of the spatial lines. w defines the window size in which the bundle adjustment takes place. Only camera poses and spatial lines observed in this window are optimized. As this window is shifted for every new image, the method is called “sliding-window bundle adjustment”. The “sliding-window” and the camera poses and spatial lines it contains are visualized in the optimization graph in Figure 7.3.
L1
r1
r2
L3
L2
...
f t − w −2
f t − w −1
f t−w ...
f t −1
ft
Figure 7.3.: The bundle adjustment problem is visualized as a bipartite graph. The camera poses (drawn as circles) and the spatial lines (as squares) are the nodes of the graph. The edges visualize the observation of the line Li in camera view f j . Black circles denote the scale reference frames from which the local map is built. Green circles mark the cameras which are in the current sliding window. Only green nodes are optimized. Gray circles denote cameras which are not included in the optimization.
102
7.4. Experiments and Evaluation A screenshot showing the visual odometry pipeline which has been presented here in action is given in Figure 7.4.
Figure 7.4.: Visual odometry in action. On the left side, the two most recent images are shown with the line segments detected. The different colors indicate the matching. The center part visualizes the current reconstructed trajectory. On the right, the local map is drawn with the scale reference frames and the current camera poses of the sliding window.
7.4. Experiments and Evaluation The aim now is to evaluate the visual odometry pipeline proposed here. It is tested on real image sequences and compared to SVO from Forster et al. [36]. SVO is a semidirect visual odometry pipeline for monocular cameras which is freely available2 and is considered state-of-the-art. Note that SVO is designed for downwards-looking cameras in drone applications and that the same performance cannot be expected for front-looking cameras as are used here. For all experiments, the same set of parameters is used which is listed in Table 7.1. SVO is used in its default configuration. All experiments are conducted on a desktop PC with Intel® Xeon™ CPU with 3.2 GHz and 32 GB RAM. 2 Implementation
available at https://github.com/uzh-rpg/rpg_svo.
103
7. Visual Odometry with Lines
Table 7.1.: Parameter settings for the visual odometry pipeline proposed in this thesis Parameter -
Description
Value
Proportion of “corner-like” points to keep in line matching Size of neighborhood to assign flow vector with line Cluster initialization strategy Error threshold for rotation estimation RANSAC Error threshold for translation estimation RANSAC Minimum cluster probability in robust relative pose framework Threshold for maximum parallax angle in robust relative pose framework Angle between image line and corresponding epipolar line in triangulation framework Ratio threshold for new scale reference frame Error threshold in scale estimation RANSAC Window size of sliding-window BA Value for Cauchy cost function in sliding-window bundle adjustment
dth ρth mth w -
0.5 2 px Predef. dir. + priors 3° 10−3 0.1 0.1° 10° 0.6 15 px 5 5 px
The pipelines are evaluated on the Oxford Corridor sequence and the HCI benchmark suite datasets 0_0000 and 0_0077 as presented in Section 5.6.1.
The analysis is done as follows: First, both visual odometry pipelines are executed on the sequences and the resulting trajectories are saved. Then, the trajectories are aligned with the ground truth so that they are in the same coordinate frame, which is a prerequisite for comparison. For alignment, the estimated trajectory has to be scaled as monocular methods cannot recover a metric scale. This scale factor is calculaed from the first two estimated camera poses: It is defined so that the distance between these camera poses equals the distance between the corresponding ground truth poses. Then, the estimated trajectory is shifted in such a way that the first estimated pose corresponds to the ground truth pose.
As the trajectories are now aligned to the ground truth, several metrics can be defined for evaluation. The well-known relative pose error (RPE) and absolute trajectory error (ATE) are chosen, which are easily computable using the tools provided with the RGB-D benchmark as described in [104].
The RPE characterizes the transformation difference between two estimated camera poses
104
w
cT est
( j)
,
w
cT est
(k)
and their corresponding ground truth poses
w
cT gt
( j)
,
7.4. Experiments and Evaluation w
cT gt
(k)
:
T RPE ( j,k) =
�
w
( j) cT gt
−1 w
(k) cT gt
� −1 �
w
( j) cT est
−1 w
(k) cT est
� (7.21)
To represent this difference in one value, the length of the translational component is used:
� �
RPE( j, k ) = Trans T RPE ( j,k)
(7.22)
Sturm et al. [104] argue that it is sufficient to take the translation into account as “rotational errors show up as translational errors when the camera is moved”. The RPE values are calculated for every pair of consecutive images of each sequence and the mean, standard deviation and root mean squared error (RMSE) are reported. The RMSE is calculated as s RMSE( RPE) =
1 m RPE(i, i + 1)2 . m i∑ =1
(7.23)
It was decided to compare consecutive images as proposed in [104] since, in this work, the visual odometry derives the pose from consecutive images.
The ATE gives the error between a ground truth pose and its corresponding estimated pose directly: T ATE ( j) =
w
cT gt
( j ) −1 w
cT est
( j)
(7.24)
In analogy with the RPE, only the translational component is considered. Mean, standard deviation and RMSE over the whole sequence are reported.
� �
ATE( j) = Trans T ATE ( j) s 1 n ATE(i )2 RMSE( ATE) = n i∑ =1
(7.25) (7.26)
Several sets of statistics are also reported, e.g. the stage of the visual odometry pipeline over time. In addition, the execution time of the different steps of the pipeline proposed here is measured.
105
7. Visual Odometry with Lines
7.4.1. Qualitative Analysis In the qualitative analysis, the trajectories resulting from the method proposed here and SVO are plotted in comparison with the ground truth. Figure 7.5 shows the estimated trajectories on the Oxford Corridor sequence. In Figures 7.6 and 7.7 the results for the HCI datasets are shown. 0.4
0.6
y (in m)
z (in m)
0.8
0.2
0.4 0
0.2
−0.2
0
−0.5
0 x (in m) Top view
0
Ground truth
0.2
0.4 0.6 z (in m) Side view
This method
0.8
SVO
Figure 7.5.: Estimated trajectory of Oxford Corridor sequence 2 4
0
2
y (in m)
z (in m)
1
−1 0
−2
0 x (in m) Top view
2
Ground truth
0
2 z (in m) Side view
This method
4
−2
SVO
Figure 7.6.: Estimated trajectory of HCI 0_0000 sequence A visual comparison of the SVO trajectory and the ground truth shows that SVO needs some time to initialize properly but then the trajectory seems reasonable. This is expected as SVO starts to build an initial map when the features tracked show clear displacement. A problem is that SVO easily gets lost. On the Oxford sequence, the
106
7.4. Experiments and Evaluation 10 20
0
10
y (in m)
z (in m)
5
−5 0
−10
0
10
x (in m) Top view Ground truth
0
10 z (in m) Side view
This method
20
−10
SVO
Figure 7.7.: Estimated trajectory of HCI 0_0077 sequence tracking is lost immediately after initialization, and on the HCI 0_0077 sequence in the first half of the sequence. The failure on the Oxford sequence is expected since SVO as a direct method is designed for small baseline motion, which is clearly not the case here. In comparison, the pipeline described here generates a pose estimate for every image. For the Oxford sequence, the overall length of the trajectory seems to be comparable to the ground truth, which shows that the scale estimation works. On the other hand, a drift in the position, especially in the upwards direction, is observed. Focusing on the HCI sequences, it is seen there is a difference in the overall length of the trajectories. This indicates scale drift. Also, the HCI 0_0000 trajectory drifts to the left and upwards, whereas on the HCI 0_0077 sequence a drift to the right is observed. This drift to left or right can be explained by the fact that the lines detected are not uniformly distributed over the image. In fact, on the HCI 0_0000 sequence, more lines are found on the left side of the image, whereas on the HCI 0_0077 dataset more lines are detected in the right-hand part. This uneven distribution biases the pose estimation. This is shown in Figure 7.8 on one image of the HCI 0_0077 dataset.
7.4.2. Quantitative Analysis The actual numbers and statistics are now discussed. The stage of the visual odometry pipeline is plotted over time in Figure 7.9, where the stage defines whether a pose can be recovered from the current image, whether the tracking is lost, or whether the pipeline is still in initialization mode. It should be noted that the implementation of
107
7. Visual Odometry with Lines
Figure 7.8.: Lines are not evenly distributed over this image of the HCI 0_0077 sequence. It is clear that more lines are detected on the right-hand side, which biases the pose estimation. SVO always discards the first image, which is why it is marked as “lost” in the plots.
These numbers support the previous findings. The initialization of SVO takes some time (up to 71 images in the HCI 0_0000 dataset) whereas the method proposed here is always fully initialized with the second image since it is based on the relative pose estimate. In the plot, it becomes obvious that SVO has troubles on the HCI 0_0077 sequence before getting lost completely, something which is not observable from the trajectory alone as the pipeline switches several times between lost and tracking stage. This is probably due to the fact that, as mentioned before, SVO is not designed for front-looking cameras. It is definitely not due to large baseline motion like in the Oxford sequence since the HCI datasets are recorded with a very high frame rate of 200 Hz. Figures 7.10 and 7.11 list RPE and ATE measurements. The relative pose error cannot be calculated for SVO on the Oxford data since too few poses are returned. SVO achieves the best performance on the HCI 0_0000 dataset with an RMSE of around 5 mm. On the same sequence, the method used in this thesis achieves an RMSE of around 20 mm. On the HCI 0_0077 dataset, SVO is notably inferior compared to the result on HCI 0_0000 with an RMSE of just under 20 mm. Here, the method presented is also slightly worse with an RMSE of 36 mm but the result is still of the same order as on the HCI 0_0000 sequence. On the Oxford sequence, a comparable result of just under 36 mm is achieved. The conclusion is that the method proposed exhibits similar behavior on the different datasets.
108
7.4. Experiments and Evaluation
10
Tr ac k Tr a
.
ck
Lo
50 Image Index HCI 0_0000
0
100
This method
Sequence
# Lost
OxfordCorridor HCI 0_0000 HCI 0_0077
7 1 401
200 400 Image Index HCI 0_0077
600
st
0
Lo
st
t
In
it
i In
Stage
ck
.
a Tr
Stage
Lo
st
In it
Stage
.
0
Image Index Oxford 5
SVO
Stage Statistics SVO This method # Init # Tracking # Lost # Init # Tracking 3 71 41
1 29 158
0 0 0
1 1 1
10 100 599
Figure 7.9.: Stage of the visual odometry pipeline for every image on the Oxford Corridor sequence (top), HCI 0_0000 (left) and HCI 0_0077 (right) dataset.
109
7. Visual Odometry with Lines
RMSE( RPE) (in m)
·10−2
3
2
07 7 I_ 0_ 0 H C
O
H
C
xf or dC
I_
or
rid
0_ 00 0
or
0
1
Sequence SVO
This method
RPE (in m) Sequence
RMSE
SVO Mean
OxfordCorridor HCI_0_0000 HCI_0_0077
n/a 0.0054 0.0197
n/a 0.0042 0.0141
Std. n/a 0.0033 0.0137
This method RMSE Mean Std. 0.0356 0.0208 0.0361
Figure 7.10.: RPE Evaluation
110
0.0324 0.0185 0.0271
0.0156 0.0094 0.0239
15 2 10 77
0
0_ 00 I_
O
H
H C
C
I_
or r
0_ 00 0
id or
7 xf or dC
I_ C
O
xf
H
H
C
or dC
I_
or
0_
rid
00
0_ 00 7
00
0
RMSE( ATE) (in % of GT trajectory length)
4
or
RMSE( ATE) (in m)
7.4. Experiments and Evaluation
Sequence
Sequence SVO
This method
ATE (in m) Sequence
RMSE
SVO Mean
OxfordCorridor HCI_0_0000 HCI_0_0077
0.1987 0.1906 0.4859
0.1405 0.1868 0.4472
Std. 0.1405 0.0377 0.1902
This method RMSE Mean Std. 0.0815 0.7270 4.0107
0.0744 0.6245 3.3153
0.0348 0.3741 2.2590
ATE (in m)
Sequence
RMSE
SVO GT length recon. traj.
OxfordCorridor HCI_0_0000 HCI_0_0077
0.1987 0.1906 0.4859
n/a 1.1736 5.8016
RMSE in % of length
RMSE
n/a 16.2403 8.3759
0.0815 0.7270 4.0107
This method GT length RMSE in % recon. traj. of length 0.8780 4.1721 21.6754
9.2813 17.4258 18.5036
Figure 7.11.: ATE Evaluation
111
7. Visual Odometry with Lines The absolute trajectory error shows the full extent of the scale drift. Whereas the trajectory plots from SVO seemed correct, it is now seen that SVO is also affected by scale drift. On the Oxford and HCI 0_0000 sequences, the RMSE is around 0.19 m and nearly 0.5 m on the HCI 0_0077 sequence. For the method developed here, the results on the HCI sequences look even worse: 0.72 m on HCI 0_0000 and over 4 m on HCI 0_0077. The ATE has a comparably low value of 0.08 m on the Oxford sequence only. As SVO and this method reconstruct different parts of the trajectory, the RMSE is additionally related to the ground truth length of the reconstructed trajectory and the percentage of RMSE in relation to this length is reported. Here, it is seen that both methods exhibit similar behavior on the HCI 0_0000 sequence as the RMSE percentage is 16.2 % for SVO and 17.4 % for the method presented here. The percentage on the HCI 0_0077 dataset stays at a similar value for the method propsed (18.5 %) but SVO is significantly better at 8.4 %. For the Oxford sequence, the value with the method proposed is reported as 9.3 %. As SVO tracks just one frame, it is not possible to calculate the reconstructed trajectory length. Finally, the execution times of the method described are reported in Table 7.2. Table 7.2.: Runtime evaluation of the visual odometry pipeline proposed in this thesis Sequence
Line Acq.
OxfordCorridor HCI_0_0000 HCI_0_0077
28.08 297.33 292.76
Average Runtime (in ms) Match. Rel. Pose Scale SW BA 21.77 66.45 105.39
31.34 44.92 60.19
33.63 79.48 93.52
47.38 40.30 72.30
∑ 162.21 528.48 624.16
On the HCI datasets, the line acquisition takes most of the time. This step is clearly dependent on the image size as line acquisition on the Oxford sequences is significantly faster (2, 560 × 1, 080 px versus 512 × 512 px). The runtime of the other processing steps depends on the number of lines detected or the number of matches. On the HCI 0_0000 and HCI 0_0077 sequences, around 220 lines are detected per image on average of which around 190 are matched between consecutive frames. On the Oxford dataset, 114 lines are detected on average and it is possible to match 84. Overall, the pipeline needs on average 162 ms on the Oxford sequence, 528 ms on HCI 0_0000 and 624 ms on HCI 0_0077. This translates to frame rates of between 2 Hz and 6 Hz, which is clearly inferior to the frame rate of state-of-the-art methods like SVO, which achieve up to 300 Hz on the HCI 0_0077 dataset during tracking.
112
7.5. Conclusion
7.5. Conclusion In this chapter, what is believed to be the first ever monocular visual odometry system based purely on lines has been introduced. This system combines the localization components presented earlier – line matching (cf. Chapter 4), relative pose estimation (cf. Chapter 5), and triangulation (cf. Chapter 6) – in a meaningful way. Lines are first extracted and matched between consecutive images. Then, relative pose estimation provides an unscaled initial pose estimate which is then adjusted in proportion to the previous pose estimates using a scale adjustment scheme based on the trifocal tensor. Lastly, sliding-window bundle adjustment incorporates more image measurements and helps to refine the trajectory. The evaluation demonstrates that line-based monocular visual odometry makes it possible to solve the localization problem. It has been shown that the method developed here gives repeatable results in different indoor and outdoor scenarios. The system is fully initialized with the second frame and provides poses whenever the relative pose estimation is successful. In fact, the method here could process all test sequences without getting lost. Compared to SVO – a state-of-the-art monocular visual odometry pipeline – and to ground truth, however, it is recognized that there is still room for many improvements. Although SVO has a longer initialization phase and repeatably gets lost (due to its focus on downwards-looking cameras and not on forward-facing ones which are used here), its accuracy is higher: SVO reaches an RPE below 20 mm whereas the method described here has an RPE between 20 mm and 36 mm. This is also shown in the ATE as a percentage of the trajectory length. Here, SVO is between 1 % and 10 % better then the method of this thesis. The performance of SVO must be seen in the light that it is the result of decades of research on point-based visual odometry. The line-based visual odometry presented here, however, is opening a new branch of monocular visual odometry research where only little preliminary work has been done. Another drawback of this method is its computational complexity. Even on the small images of the Oxford sequence, the pipeline can only run at around 6 Hz.
113
8. Conclusion and Outlook This thesis has focused on components for line-based visual localization and combined them to a monocular visual odometry system to solve the visual localization problem. Lines were used since the target was localization in man-made indoor and outdoor environments that are very structured and in which many lines are found. The first steps in line-based visual localization are feature acquisition and matching. A novel line matching scheme was proposed which targets the small baseline motion case and is based on optical flow, and which does not require the calculation of additional descriptors and is hence lightweight and fast to compute. The matching was designed to allow one-to-many matching to take differences in line segmentation between consecutive views into account. It has been demonstrated that this method outperforms current state-of-the-art line matching approaches in the scenarios targeted. Since the focus was on monocular cameras, relative pose estimation was required to determine the camera displacement between successive views. Line-based relative pose estimation from two views was therefore investigated and a solution developed which separates rotation and translation estimation. The underlying assumption is that spatial lines with different dominant directions are observed, which makes the separation possible. The rotational part was calculated from these spatial line directions, which were retrieved through a parallel line clustering step. The translation was estimated from line intersections and the relative rotation. Both steps were combined in a robust relative pose framework. Compared to the state-of-the-art, it has been possible to drastically improve the computational complexity and thus the speed from several seconds to below 40 ms. The cost of this vast improvement was a slight decrease in accuracy. Line triangulation was the last component investigated. The research on triangulation was motivated by two challenges: First, a desire to include spatial line directions, which were generated in the relative pose estimation, into the reconstruction process. Second, a desire to circumvent the problem of degenerate configurations since up to 24 % of the lines in the scenes targeted here suffer from degeneracy. To overcome
114
8.1. Future Work the first challenge, a closed-form triangulation method was derived from the Plücker line transformation equation. This allowed the Plücker constraint to be taken into account and line direction priors to be incorporated. Regarding the second challenge, use was made of the optical flow point correspondences of the line matching method. It was proposed that the flow points be triangulated and the resulting spatial points taken into account. A triangulation framework was introduced which combines and selects the most suitable methods according to the input. Lastly, the first monocular line-based visual odometry system ever presented was developed. The VO integrates all previously discussed components. Consecutive images were matched and the relative pose was estimated. A scale adjustment scheme to correct the unscaled relative displacement was proposed which is based on the trifocal tensor. It was discussed which frames should be used in the tensor calculation and explained how sliding-window bundle adjustment is adopted to lines. It was demonstrated that line-based visual odometry for monocular cameras is feasible. But there is still room for improvements in both computational requirements and accuracy as the estimated trajectory drifts up to 18.5 % of the overall ground truth trajectory length while being able to process only between 2 and 6 frames per second.
8.1. Future Work Several ideas come to mind to improve the current components and systems. Regarding the accuracy, it is essential to enhance the relative pose estimation. One major point is the parallel line clustering as the prerequisite for the rotation estimation. Currently, the cluster initialization uses a predefined set of directions which limits the method to certain scenes. It is future work to adapt the clustering for the general case and also to improve the accuracy of the estimated directions. More accurate directions would result in better rotation estimates. As rotation and translation estimation is separate, it would be possible to add a test for pure-rotational motion between rotation and translation estimation stages. This would further robustify the estimate as it makes it possible to recognize whether the camera was moved or not. Regarding the computation time, a significant amount of time is spent in the translation estimation and the nonlinear refinement which both require line intersections. The number of intersection points is in O(n2 ) for n line matches but a number of points in O(n) would be needed to make a difference. This could be solved by using corresponding optical flow points with strong corner indication, but it is unclear if the position of
115
8. Conclusion and Outlook the corresponding flow points is stable enough or if they shift too much along the lines due to the aperture problem. Line matching under large baseline motion is still an open research topic as the methods proposed are computationally very expensive. Until now, all line descriptors and additional matching constraints which have been proposed have been designed manually. One idea would be to investigate whether better descriptors or constraints could be found with machine learning methods. Regarding the visual odometry pipeline, a major part of the time is spent with line extraction and matching. One idea would be to fix the number of lines and to guide the line extraction so that the lines are evenly distributed over the whole image. A uniform distribution of the lines would also prevent a biased pose estimate due to line clusters. How to select a subset of the lines without losing too much information is an open topic. Another open topic is the fusion of relative pose estimation and scale adjustment. It is possible to directly use the trifocal tensor for pose estimation and therefore to directly generate scaled poses which would make the scale adjustment obsolete. To overcome the main drawback of the trifocal tensor, its high number of degrees of freedom, the suggestion is made to combine the proposed rotation estimation and the trifocal tensor. In that way, only the translational components of the tensor must be estimated which are five degrees of freedom for three views. Moving from a visual odometry to a visual SLAM system would also be a natural step for future research. Here, problems like loop closure detection must be additionally addressed. As a global map is maintained, the usage of perspective-n-line algorithms for pose estimation seems reasonable. An open topic is how the line direction information could be integrated here, as was proposed in this work for the relative pose. Since points and lines are complementary, it is also advisable to build a system which fuses both to be able to handle versatile scenes. This could either happen on the component level (e.g. similar to how spatial points are leveraged for line triangulation in degenerate cases in this thesis) or on the system level where the system decides which component to use according to the input signals.
116
Appendices
A. Derivation of the Transformation of Plücker Lines The transformation for Plücker coordinates is proven by replacing the definition of momentum and direction of Plücker lines in Equations (3.5) and (3.6) with the rigid point transformation (Equation (3.9)): t
t
d=
sR
t
t
s
� q + tt s −
s
t
t
sR
s
p + tt s
�
(A.1)
s
= sR q − sR p
(A.2)
= t sR ( sq − s p )
(A.3)
= t sR sd
(A.4)
t
m=
sR
s
� p + tt s ×
t
sR
s
q + tt s
�
(A.5)
= t sR s p × t sR sq + t sR s p × tt s + tt s × t sR sq t
s
s
t
t
s
t
t
s
(A.6)
= sR ( p × q ) − t s × sR p + t s × sR q � = t sR sm + tt s × t sR sq − t sR s p
(A.7)
= t sR sm + tt s × t sR ( sq − s p )
(A.9)
= t sR sm + tt s × t sR sd
(A.8)
(A.10)
The deduced expressions for tm and td equal the Plücker coordinate transformation matrix tsTL : t
L = t sT L sL ! �t � t ! s ! tm t R t s × sR m s = t s t d 0 3×3 d sR ! � � s t R sm + tt t s × sR d = s t R sd s
118
(A.11) (A.12) (A.13)
Similar, the expansion of the Plücker matrix transformation reaches the same result: T
t
� � − tm × t T
d �t � − m × t T
d
L = t sT sL t sT (A.14) ! ! !T ! t R tt t R tt − td − [ sm ] × − sd s s s s = (A.15) T s 0 1×3 1 0 1×3 1 d 0 0 ! ! ! ! s t RT 0 sm t R tt − td − d − ] [ 3×1 s s s × (A.16) = s T tt T d 0 0 1×3 1 1 0 s ! ! T T tt t R − [ sm ] × t sR − sd tt s − sd s s (A.17) = T s Tt 0 1×3 1 d sR 0 � � ! t R T − sd tt T + tt sd T t R T − t R sd t R − sm ] [ s s s s × s = s T s Tt d sR 0 t
=
sR
T
T
T [− sm ]× tsR − tsR sd tt s + tt s sd tsR � t R sd T s
T
(A.18) ! − t sR sd 0 (A.19)
= = = =
T
s Tt
T
− t sR sd tt s + tt s d sR − t sR sd � t R sd T 0 s ! � t s � �t � − sR m × − t s × t sR sd × − t sR sd � t R sd T 0 s ! � t s � − sR m − tt s × t sR sd × − t sR sd � t R sd T 0 s ! �t � − m × − td �
− t sR sm
t T
d
�
×
0
! (A.20) (A.21) (A.22) (A.23)
119
B. Derivation of the Projection of Plücker Lines The projection of Plücker lines is derived from the image line construction from two points (3.18) and the projection of points (3.27): l i = pi × qi
=
P
=
�
wp
(B.1) !!
wq
× P
1 K 03×1
�
c
!! (B.2)
1 !
wR
ct
0 1×3
1
w
wp
1
!!
×
�
K 03×1
�
c
!
wR
ct
0 1×3
1
w
wq
!!
1 (B.3)
= ( K c wR w p + K ct w ) × ( K c wR wq + K ct w )
(B.4)
= K c wR w p × K c wR wq + K c wR w p × K ct w + K ct w × K c wR wq
(B.5)
In combination with the relation of cofactor matrix and cross product, the equation becomes: l i = det (K) K−T cwR ( w p × wq ) + det (K) K−T ( cwR w p × ct w )
+ det (K) K−T ( ct w × cwR wq )
(B.6) (B.7)
= det (K) K−T ( cwR ( w p × wq ) + ( cwR w p × ct w ) + ( ct w × cwR wq ))
(B.8)
= det (K) K−T ( cwR ( w p × wq ) − ( ct w × cwR w p ) + ( ct w × cwR wq ))
(B.9)
= det (K) K−T ( cwR ( w p × wq ) + ct w × ( cwR wq − cwR w p )) = det (K) K
−T c
w
w
c
( wR ( p × q ) + t w ×
c
wR
w
w
( q − p ))
(B.10) (B.11)
Replacing the definition of line momentum (3.5) and direction (3.6) in the equation gives: l i = det (K) K−T ( cwR wm + ct w × cwR wd )
120
(B.12)
Finally, the transformation of the momentum of the line is applied (cf. Equation (A.10)): l i = det(K)K−T cm
(B.13)
This corresponds to the line projection definition: l i = P L wL � � = det(K)K−T 03×3 � � = det(K)K−T 03×3
= det(K)K−T cm
(B.14) c
wR
0 3×3 ! cm c
d
[ ct w ] × c wR c R w
!
wm w
d
! (B.15) (B.16) (B.17)
121
C. Matching Database The matching database consists of 14 image pairs with labeled line segment matches. Line segments are extracted with the LSD algorithm [110]. Table C.1.: Properties of the matching database Image Pair Name
Number of Ground Truth Matches
Image Dimension
“Demoarea01” “Facade01” “Facade02” “HCI01” “HCI02” “KITTI01” “KITTI02” “Warehouse01” “Modelhouse01” “Office01” “Office02” “Office31” “Oxford01” “Oxford02”
247 234 172 186 125 110 175 107 63 242 86 46 109 101
1024 × 768 px 800 × 600 px 640 × 480 px 2560 × 1080 px 2560 × 1080 px 1226 × 370 px 1226 × 370 px 752 × 480 px 768 × 576 px 1024 × 768 px 1032 × 778 px 1032 × 778 px 512 × 512 px 512 × 512 px
The image pairs “Facade01” and “Facade02” are taken from [122, 123]. “HCI01” and “HCI02” are from the HCI benchmark suite [67, 68]. “KITTI01” and “KITTI02” are image pairs from the KITTI odometry benchmark [40]. “Oxford01”, “Oxford02” and “Modelhosue01” are from the Oxford multiview dataset1 .
1 http://www.robots.ox.ac.uk/~vgg/data1.html
122
(a) “Demoarea01”
(b) “Facade01”
(c) “Facade02”
(d) “HCI01”
(e) “HCI02”
(f) “KITTI01”
123
C. Matching Database
124
(g) “KITTI02”
(h) “Warehouse01”
(i) “Modelhouse01”
(j) “Office01”
(k) “Office02”
(l) “Office03”
(m) “Oxford01”
(n) “Oxford02”
Figure C.1.: The matching test set.
125
Abbreviations Abbreviation
Meaning
ATE
Absolute Trajectory Error
DLT
Direct Linear Transform
EM
Expectation-Maximization
ICP
Iterative Closest Points
IMU
Inertial Measurement Unit
LBD
Line Band Descriptor
LEHF
Line-based Eight-directional Histogram Feature
LICF
Line Intersection Context Feature
LRC
Left/Right Checking
MSLD
Mean Standard Deviation Line Descriptor
MVG
Multiple View Geometry
NCC
Normalized Cross-Correlation
NNDR
Nearest Neighbor Distance Ratio
PnL
Perspecitve-n-Line problem
PnP
Perspective-n-Point problem
RANSAC
RANdom SAmple Consensus
RMSE
Root Mean Squared Error
RPE
Relative Pose Error
SfM
Structure from Motion
(v)SLAM
(visual) Simultaneous Localization and Mapping
SVD
Singular Value Decomposition
VO
Visual Odometry
126
Bibliography [1] S. Agarwal, N. Snavely, I. Simon, S. M. Seitz, and R. Szeliski. Building Rome in a day. In 2009 IEEE 12th International Conference on Computer Vision (ICCV), pages 72–79, 2009. doi:10.1109/ICCV.2009.5459148. [2] C. Akinlar and C. Topal. EDLines: A real-time line segment detector with a false detection control. Pattern Recognition Letters, 32(13):1633–1642, 2011. ISSN 01678655. doi:10.1016/j.patrec.2011.06.001. [3] M. E. Antone and S. Teller. Automatic recovery of relative camera rotations for urban scenes. In IEEE Conference on Computer Vision and Pattern Recognition. CVPR 2000, pages 282–289, 2000. doi:10.1109/CVPR.2000.854809. [4] A. Bartoli and P. Sturm. Structure-from-motion using lines: Representation, triangulation, and bundle adjustment. Computer Vision and Image Understanding, 100(3):416–441, 2005. ISSN 10773142. doi:10.1016/j.cviu.2005.06.001. [5] H. Bay, V. Ferrari, and L. van Gool. Wide-Baseline Stereo Matching with Line Segments. In IEEE Computer Society Conference on Computer Vision and Pattern Recognition (CVPR), pages 329–336, 2005. doi:10.1109/CVPR.2005.375. [6] H. Bay, T. Tuytelaars, and L. van Gool. SURF: Speeded Up Robust Features. In D. Hutchison, T. Kanade, J. Kittler, J. M. Kleinberg, F. Mattern, J. C. Mitchell, M. Naor, O. Nierstrasz, C. Pandu Rangan, B. Steffen, M. Sudan, D. Terzopoulos, D. Tygar, M. Y. Vardi, G. Weikum, A. Leonardis, H. Bischof, and A. Pinz, editors, Computer Vision – ECCV 2006, volume 3951 of Lecture Notes in Computer Science, pages 404–417. Springer Berlin Heidelberg, Berlin, Heidelberg, 2006. ISBN 978-3-540-33832-1. doi:10.1007/11744023_32. [7] J. Bazin, C. Demonceaux, P. Vasseur, and I. Kweon.
Motion estima-
tion by decoupling rotation and translation in catadioptric vision.
Com-
puter Vision and Image Understanding, 114(2):254–273, 2010. ISSN 10773142. doi:10.1016/j.cviu.2009.04.006.
127
Bibliography [8] P. A. Beardsley, A. Zisserman, and D. W. Murray. Navigation using affine structure from motion. In J.-O. Eklundh, editor, Computer Vision — ECCV ’94, volume 801 of Lecture Notes in Computer Science, pages 85–96. Springer-Verlag, Berlin/Heidelberg, 1994. ISBN 3-540-57957-5. doi:10.1007/BFb0028337. [9] P. Bergström and O. Edlund. Robust registration of point sets using iteratively reweighted least squares. Computational Optimization and Applications, 58(3): 543–561, 2014. ISSN 0926-6003. doi:10.1007/s10589-014-9643-2. [10] P. J. Besl and H. D. McKay. A method for registration of 3-D shapes. IEEE Transactions on Pattern Analysis and Machine Intelligence, 14(2):239–256, 1992. ISSN 0162-8828. doi:10.1109/34.121791. [11] J.-Y. Bouguet. Pyramidal implementation of the affine lucas kanade feature tracker description of the algorithm. Intel Corporation, 5:1–10, 2001. [12] M. Calonder, V. Lepetit, C. Strecha, and P. Fua. BRIEF: Binary Robust Independent Elementary Features. In D. Hutchison, T. Kanade, J. Kittler, J. M. Kleinberg, F. Mattern, J. C. Mitchell, M. Naor, O. Nierstrasz, C. Pandu Rangan, B. Steffen, M. Sudan, D. Terzopoulos, D. Tygar, M. Y. Vardi, G. Weikum, K. Daniilidis, P. Maragos, and N. Paragios, editors, Computer Vision – ECCV 2010, volume 6314 of Lecture Notes in Computer Science, pages 778–792. Springer Berlin Heidelberg, Berlin, Heidelberg, 2010. ISBN 978-3-642-155604. doi:10.1007/978-3-642-15561-1_56. [13] J. Canny. A Computational Approach to Edge Detection. IEEE Transactions on Pattern Analysis and Machine Intelligence, PAMI-8(6):679–698, 1986. ISSN 01628828. doi:10.1109/TPAMI.1986.4767851. [14] Y. Chen and G. Medioni. Object modeling by registration of multiple range images. In 1991 IEEE International Conference on Robotics and Automation, pages 2724–2729, 1991. doi:10.1109/ROBOT.1991.132043. [15] N. Chiba and T. Kanade. A Tracker For Broken And Closely-Spaced Lines. In In ISPRS Int. Society for Photogrammetry and Remote Sensing Conf., pages 676 – 683., Hakodate,Japan, pages 676–683, 1998. [16] A. J. Davison. Real-time simultaneous localisation and mapping with a single camera. In ICCV 2003: 9th International Conference on Computer Vision, pages 1403–1410 vol.2, 2003. doi:10.1109/ICCV.2003.1238654.
128
Bibliography [17] A. J. Davison, I. D. Reid, N. D. Molton, and O. Stasse. MonoSLAM: Real-Time Single Camera SLAM. IEEE Transactions on Pattern Analysis and Machine Intelligence, 29(6):1052–1067, 2007. ISSN 0162-8828. doi:10.1109/TPAMI.2007.1049. [18] A. P. Dempster, N. M. Laird, and D. B. Rubin. Maximum likelihood from incomplete data via the EM algorithm. Journal of the Royal Statistical Society. Series B (Methodological), pages 1–38, 1977. [19] R. Deriche and O. Faugeras. Tracking line segments. In O. Faugeras, editor, Computer Vision — ECCV 90, volume 427 of Lecture Notes in Computer Science, pages 259–268. Springer-Verlag, Berlin/Heidelberg, 1990. ISBN 3-540-52522-X. doi:10.1007/BFb0014872. [20] D. H. Douglas and T. K. Peucker. Algorithms for the Reduction of the Number of Points Required to Represent a Digitized Line or its Caricature. Cartographica: The International Journal for Geographic Information and Geovisualization, 10 (2):112–122, 1973. ISSN 0317-7173. doi:10.3138/FM57-6770-U75U-7727. [21] R. O. Duda and P. E. Hart. Use of the Hough transformation to detect lines and curves in pictures. Communications of the ACM, 15(1):11–15, 1972. ISSN 00010782. doi:10.1145/361237.361242. [22] E. Eade and T. Drummond.
Edge Landmarks in Monocular SLAM.
In
M. Chantler, R. B. Fisher, and E. Trucco, editors, British Machine Vision Conference 2006, pages 2.1–2.10. BMVA, [Edinburgh], 2006. ISBN 1-904410-14-6. doi:10.5244/C.20.2. [23] E. Eade and T. Drummond. Scalable Monocular SLAM. In 2006 IEEE Computer Society Conference on Computer Vision and Pattern Recognition - Volume 1 (CVPR’06), pages 469–476, 2006. doi:10.1109/CVPR.2006.263. [24] A. Elqursh and A. Elgammal. Line-based relative pose estimation. In 2011 IEEE Conference on Computer Vision and Pattern Recognition (CVPR), pages 3049–3056, 2011. doi:10.1109/CVPR.2011.5995512. [25] J. Engel, J. Sturm, and D. Cremers. Semi-dense Visual Odometry for a Monocular Camera. In 2013 IEEE International Conference on Computer Vision (ICCV), pages 1449–1456, 2013. doi:10.1109/ICCV.2013.183. [26] J. Engel, T. Schöps, and D. Cremers. LSD-SLAM: Large-Scale Direct Monocular SLAM. In D. Fleet, T. Pajdla, B. Schiele, and T. Tuytelaars, editors, Computer Vision – ECCV 2014, volume 8690 of Lecture Notes in Computer Science, pages
129
Bibliography 834–849. Springer International Publishing, Cham, 2014. ISBN 978-3-319-106045. doi:10.1007/978-3-319-10605-2_54. [27] J. Engel, J. Stuckler, and D. Cremers. Large-scale direct SLAM with stereo cameras. In 2015 IEEE/RSJ International Conference on Intelligent Robots and Systems (IROS), pages 1935–1942, 2015. doi:10.1109/IROS.2015.7353631. [28] J. Engel, V. Koltun, and D. Cremers. Direct Sparse Odometry. In arXiv. 2016. [29] I. Esteban, L. Dorst, and J. Dijk. Closed Form Solution for the Scale Ambiguity Problem in Monocular Visual Odometry. In D. Hutchison, T. Kanade, J. Kittler, J. M. Kleinberg, F. Mattern, J. C. Mitchell, M. Naor, O. Nierstrasz, C. Pandu Rangan, B. Steffen, M. Sudan, D. Terzopoulos, D. Tygar, M. Y. Vardi, G. Weikum, H. Liu, H. Ding, Z. Xiong, and X. Zhu, editors, Intelligent Robotics and Applications, volume 6424 of Lecture Notes in Computer Science, pages 665– 679. Springer Berlin Heidelberg, Berlin and Heidelberg, 2010. ISBN 978-3-64216583-2. doi:10.1007/978-3-642-16584-9_64. [30] B. Fan, F. Wu, and Z. Hu. Line matching leveraged by point correspondences. In 2010 IEEE Conference on Computer Vision and Pattern Recognition (CVPR), pages 390–397, 2010. doi:10.1109/CVPR.2010.5540186. [31] B. Fan, F. Wu, and Z. Hu. invariants.
Robust line matching through line–point
Pattern Recognition, 45(2):794–805, 2012.
ISSN 00313203.
doi:10.1016/j.patcog.2011.08.004. [32] G. Farnebäck. Two-Frame Motion Estimation Based on Polynomial Expansion. In G. Goos, J. Hartmanis, J. van Leeuwen, J. Bigun, and T. Gustavsson, editors, Image Analysis, volume 2749 of Lecture Notes in Computer Science, pages 363–370. Springer Berlin Heidelberg, Berlin, Heidelberg, 2003. ISBN 978-3-540-40601-3. doi:10.1007/3-540-45103-X_50. [33] L. Ferraz, X. Binefa, and F. Moreno-Noguer. PnP Problem with Algebraic Outlier Rejection.
Very Fast Solution to the In 2014 IEEE Conference
on Computer Vision and Pattern Recognition (CVPR), pages 501–508, 2014. doi:10.1109/CVPR.2014.71. [34] M. A. Fischler and R. C. Bolles.
Random sample consensus: a paradigm
for model fitting with applications to image analysis and automated cartography.
Communications of the ACM, 24(6):381–395, 1981.
doi:10.1145/358669.358692.
130
ISSN 00010782.
Bibliography [35] N. I. Fisher. Statistical Analysis of Circular Data. Cambridge University Press, Cambridge, 1993. ISBN 9780511564345. doi:10.1017/CBO9780511564345. [36] C. Forster, M. Pizzoli, and D. Scaramuzza. SVO: Fast semi-direct monocular visual odometry. In 2014 IEEE International Conference on Robotics and Automation (ICRA), pages 15–22, 2014. doi:10.1109/ICRA.2014.6906584. [37] F. Fraundorfer and D. Scaramuzza. Visual Odometry: Part II: Matching, Robustness, Optimization, and Applications. IEEE Robotics & Automation Magazine, 19(2):78–90, 2012. ISSN 1070-9932. doi:10.1109/MRA.2012.2182810. [38] F. Fraundorfer, D. Scaramuzza, and M. Pollefeys. A constricted bundle adjustment parameterization for relative scale estimation in visual odometry. In 2010 IEEE International Conference on Robotics and Automation (ICRA 2010), pages 1899–1904, 2010. doi:10.1109/ROBOT.2010.5509733. [39] A. Geiger, J. Ziegler, and C. Stiller. StereoScan: Dense 3d reconstruction in real-time. In 2011 IEEE Intelligent Vehicles Symposium (IV), pages 963–968, 2011. doi:10.1109/IVS.2011.5940405. [40] A. Geiger, P. Lenz, and R. Urtasun. driving?
Are we ready for autonomous
The KITTI vision benchmark suite.
In 2012 IEEE Conference
on Computer Vision and Pattern Recognition (CVPR), pages 3354–3361, 2012. doi:10.1109/CVPR.2012.6248074. [41] D. B. Gennery. Generalized Camera Calibration Including Fish-Eye Lenses. International Journal of Computer Vision, 68(3):239–266, 2006. ISSN 0920-5691. doi:10.1007/s11263-006-5168-1. [42] J. C. Gower and G. B. Dijksterhuis. Procrustes problems, volume 3. Oxford University Press, 2004. [43] C. Harris and M. Stephens. A combined corner and edge detector. In Alvey vision conference, 1988. [44] R. Hartley, R. Gupta, and T. Chang. Stereo from uncalibrated cameras. In 1992 IEEE Computer Society Conference on Computer Vision and Pattern Recognition, pages 761–764, 1992. doi:10.1109/CVPR.1992.223179. [45] R. I. Hartley. Projective reconstruction from line correspondences. In Proceedings of IEEE Conference on Computer Vision and Pattern Recognition, pages 903– 907, 1994. doi:10.1109/CVPR.1994.323922.
131
Bibliography [46] R. I. Hartley. In defense of the eight-point algorithm. IEEE Transactions on Pattern Analysis and Machine Intelligence, 19(6):580–593, 1997. ISSN 0162-8828. doi:10.1109/34.601246. [47] R. I. Hartley and P. Sturm. Triangulation. Computer Vision and Image Understanding, 68(2):146–157, 1997. ISSN 10773142. doi:10.1006/cviu.1997.0547. [48] R. I. Hartley and A. Zisserman. Multiple View Geometry in Computer Vision. Cambridge University Press, ISBN: 0521540518, second edition, 2004. [49] J. Heinly, J. L. Schonberger, E. Dunn, and J.-M. Frahm. Reconstructing the world* in six days. In 2015 IEEE Conference on Computer Vision and Pattern Recognition (CVPR), pages 3287–3295, 2015. doi:10.1109/CVPR.2015.7298949. [50] S. Heuel. Uncertain Projective Geometry, volume 3008 of Lecture Notes in Computer Science. Springer Berlin Heidelberg, Berlin, Heidelberg, 2004. ISBN 9783-540-22029-9. doi:10.1007/b97201. [51] S. Heuel and W. Förstner. Matching, reconstructing and grouping 3D lines from multiple views using uncertain projective geometry. In 2001 IEEE Computer Society Conference on Computer Vision and Pattern Recognition. CVPR 2001, pages II–517–II–524, 2001. doi:10.1109/CVPR.2001.991006. [52] K. Hirose and H. Saito. Fast Line Description for Line-based SLAM. In R. Bowden, J. Collomosse, and K. Mikolajczyk, editors, British Machine Vision Conference 2012, pages 83.1–83.11, 2012. doi:10.5244/C.26.83. [53] H. Hirschmuller. Stereo processing by semiglobal matching and mutual information. IEEE transactions on pattern analysis and machine intelligence, 30(2): 328–341, 2008. ISSN 0098-5589. doi:10.1109/TPAMI.2007.1166. [54] M. Hofer, A. Wendel, and H. Bischof. Line-based 3D Reconstruction of Wiry Objects. In The 18th Computer Vision Winter Workshop (CVWW), 2013. [55] M. Hofer, A. Wendel, and H. Bischof. Incremental Line-based 3D Reconstruction using Geometric Constraints. In T. Burghardt, D. Damen, W. MayolCuevas, and M. Mirmehdi, editors, British Machine Vision Conference 2013, pages 92.1–92.11, 2013. doi:10.5244/C.27.92. [56] M. Hofer, M. Maurer, and H. Bischof. Efficient 3D scene abstraction using line segments. Computer Vision and Image Understanding, 2016. ISSN 10773142. doi:10.1016/j.cviu.2016.03.017.
132
Bibliography [57] T. Holzmann, F. Fraundorfer, and H. Bischof. Direct Stereo Visual Odometry based on Lines. In International Conference on Computer Vision Theory and Applications, pages 474–485, 2016. doi:10.5220/0005715604740485. [58] B. K. P. Horn. Closed-form solution of absolute orientation using unit quaternions. Journal of the Optical Society of America A, 4(4):629, 1987. ISSN 1084-7529. doi:10.1364/JOSAA.4.000629. [59] A. Jain, C. Kurz, T. Thormahlen, and H.-P. Seidel. Exploiting global connectivity constraints for reconstruction of 3D line segments from images. In 2010 IEEE Conference on Computer Vision and Pattern Recognition (CVPR), pages 1586– 1593, 2010. doi:10.1109/CVPR.2010.5539781. [60] K. Josephson and F. Kahl. Triangulation of Points, Lines and Conics. In B. K. Ersbøll and K. S. Pedersen, editors, Image Analysis, volume 4522 of Lecture Notes in Computer Science, pages 162–172. Springer Berlin Heidelberg, Berlin, Heidelberg, 2007. ISBN 978-3-540-73039-2. doi:10.1007/978-3-540-73040-8_17. [61] H. Kim and S. Lee. A novel line matching method based on intersection context. In 2010 IEEE International Conference on Robotics and Automation (ICRA 2010), pages 1014–1021, 2010. doi:10.1109/ROBOT.2010.5509472. [62] H. Kim and S. Lee. Wide-baseline image matching based on coplanar line intersections. In Intelligent Robots and Systems (IROS), 2010 IEEE/RSJ International Conference on, pages 1157–1164, 2010. doi:10.1109/IROS.2010.5650309. [63] B. Kitt, A. Geiger, and H. Lategahn. Visual odometry based on stereo image sequences with RANSAC-based outlier rejection scheme. In 2010 IEEE Intelligent Vehicles Symposium (IV), pages 486–492, 2010. doi:10.1109/IVS.2010.5548123. [64] G. Klein and D. Murray.
Parallel Tracking and Mapping for Small AR
Workspaces. In 2007 6th IEEE International Symposium on Mixed and Augmented Reality (ISMAR), pages 1–10, 2007. doi:10.1109/ISMAR.2007.4538852. [65] G. Klein and D. Murray. Improving the Agility of Keyframe-Based SLAM. In D. Forsyth, P. Torr, and A. Zisserman, editors, Computer Vision – ECCV 2008, volume 5303 of Lecture Notes in Computer Science, pages 802–815. Springer Berlin Heidelberg, Berlin and Heidelberg, 2008.
ISBN 978-3-540-88685-3.
doi:10.1007/978-3-540-88688-4_59. [66] L. Kneip, D. Scaramuzza, and R. Siegwart. A novel parametrization of the perspective-three-point problem for a direct computation of absolute camera
133
Bibliography position and orientation. In 2011 IEEE Conference on Computer Vision and Pattern Recognition (CVPR), pages 2969–2976, 2011. doi:10.1109/CVPR.2011.5995464. [67] D. Kondermann, R. Nair, S. Meister, W. Mischler, B. Güssefeld, K. Honauer, S. Hofmann, C. Brenner, and B. Jähne. Stereo Ground Truth with Error Bars. In D. Cremers, I. Reid, H. Saito, and M.-H. Yang, editors, Computer Vision – ACCV 2014, volume 9007 of Lecture Notes in Computer Science, pages 595– 610. Springer International Publishing, Cham, 2015. ISBN 978-3-319-16813-5. doi:10.1007/978-3-319-16814-2_39. [68] D. Kondermann, R. Nair, K. Honauer, K. Krispin, J. Andrulis, A. Brock, B. Gussefeld, M. Rahimimoghaddam, S. Hofmann, C. Brenner, and B. Jahne. The HCI Benchmark Suite: Stereo and Flow Ground Truth With Uncertainties for Urban Autonomous Driving. In The IEEE Conference on Computer Vision and Pattern Recognition (CVPR) Workshops, 2016. [69] J. Košecká and W. Zhang.
Video Compass.
In G. Goos, J. Hartmanis,
J. Leeuwen, A. Heyden, G. Sparr, M. Nielsen, and P. Johansen, editors, Computer Vision — ECCV 2002, volume 2353 of Lecture Notes in Computer Science, pages 476–490. Springer Berlin Heidelberg, Berlin, Heidelberg, 2002. ISBN 9783-540-43748-2. doi:10.1007/3-540-47979-1_32. [70] U. Köthe. Edge and Junction Detection with an Improved Structure Tensor. In G. Goos, J. Hartmanis, J. van Leeuwen, B. Michaelis, and G. Krell, editors, Pattern Recognition, volume 2781 of Lecture Notes in Computer Science, pages 25– 32. Springer Berlin Heidelberg, Berlin, Heidelberg, 2003. ISBN 978-3-540-408611. doi:10.1007/978-3-540-45243-0_4. [71] S. Lacroix, A. Mallet, R. Chatila, and L. Gallo. Rover Self Localization in Planetary-Like Environments. In M. Perry, editor, Artificial Intelligence, Robotics and Automation in Space, volume 440 of ESA Special Publication, page 433, 1999. [72] H. Lategahn, J. Beck, B. Kitt, and C. Stiller. How to learn an illumination robust image feature for place recognition. In 2013 IEEE Intelligent Vehicles Symposium (IV), pages 285–291, 2013. doi:10.1109/IVS.2013.6629483. [73] J. H. Lee, G. Zhang, J. Lim, and I. H. Suh. Place recognition using straight lines for vision-based SLAM. In 2013 IEEE International Conference on Robotics and Automation (ICRA), pages 3799–3806, 2013. doi:10.1109/ICRA.2013.6631111.
134
Bibliography [74] T. Lemaire and S. Lacroix. Monocular-vision based SLAM using Line Segments. In 2007 IEEE International Conference on Robotics and Automation, pages 2791–2796, 2007. doi:10.1109/ROBOT.2007.363894. [75] S. Leutenegger, M. Chli, and R. Y. Siegwart. BRISK: Binary Robust invariant scalable keypoints. In 2011 IEEE International Conference on Computer Vision (ICCV), pages 2548–2555, 2011. doi:10.1109/ICCV.2011.6126542. [76] T. Lindeberg. Edge Detection and Ridge Detection with Automatic Scale Selection. International Journal of Computer Vision, 30(2):117–156, 1998. ISSN 09205691. doi:10.1023/A:1008097225773. [77] Y. Liu, T. Huang, and O. Faugeras. Determination of camera location from 2D to 3D line and point correspondences. In Proceedings CVPR ’88: The Computer Society Conference on Computer Vision and Pattern Recognition, pages 82–88, 1988. doi:10.1109/CVPR.1988.196218. [78] H. C. Longuet-Higgins. from two projections.
A computer algorithm for reconstructing a scene Nature, 293(5828):133–135, 1981.
ISSN 0028-0836.
doi:10.1038/293133a0. [79] D. G. Lowe. Distinctive Image Features from Scale-Invariant Keypoints. International Journal of Computer Vision, 60(2):91–110, 2004.
ISSN 0920-5691.
doi:10.1023/B:VISI.0000029664.99615.94. [80] B. D. Lucas and T. Kanade. An iterative image registration technique with an application to stereo vision. In IJCAI, volume 81, pages 674–679, 1981. [81] M. Maimone, Y. Cheng, and L. Matthies. Two years of Visual Odometry on the Mars Exploration Rovers. Journal of Field Robotics, 24(3):169–186, 2007. ISSN 15564959. doi:10.1002/rob.20184. [82] D. W. Marquardt. An Algorithm for Least-Squares Estimation of Nonlinear Parameters. Journal of the Society for Industrial and Applied Mathematics, 11(2): 431–441, 1963. ISSN 0368-4245. doi:10.1137/0111030. [83] J. Matas, O. Chum, M. Urban, and T. Pajdla.
Robust Wide Baseline
Stereo from Maximally Stable Extremal Regions. In D. Marshall and P. L. Rosin, editors, British Machine Vision Conference 2002, pages 36.1–36.10, 2002. doi:10.5244/C.16.36.
135
Bibliography [84] L. Matthies and S. Shafer.
Error modeling in stereo navigation.
Journal on Robotics and Automation, 3(3):239–248, 1987.
IEEE
ISSN 0882-4967.
doi:10.1109/JRA.1987.1087097. [85] B. Micusik and H. Wildenauer. Structure from Motion with Line Segments under Relaxed Endpoint Constraints. In 2014 2nd International Conference on 3D Vision (3DV), pages 13–19, 2014. doi:10.1109/3DV.2014.17. [86] A. Milella and R. Siegwart. Stereo-Based Ego-Motion Estimation Using Pixel Tracking and Iterative Closest Point. In Fourth IEEE International Conference on Computer Vision Systems (ICVS’06), page 21, 2006. doi:10.1109/ICVS.2006.56. [87] H. Moravec. Obstacle Avoidance and Navigation in the Real World by a Seeing Robot Rover. Dissertation, Stanford University, 1980. [88] E. Mouragnon, M. Lhuillier, M. Dhome, F. Dekeyser, and P. Sayd. Real Time Localization and 3D Reconstruction. In 2006 IEEE Computer Society Conference on Computer Vision and Pattern Recognition (CVPR’06), pages 363–370, 2006. doi:10.1109/CVPR.2006.236. [89] R. Mur-Artal and J. D. Tardos. ORB-SLAM2: an Open-Source SLAM System for Monocular, Stereo and RGB-D Cameras. In arXiv. 2016. [90] R. Mur-Artal, J. M. M. Montiel, and J. D. Tardos. ORB-SLAM: A Versatile and Accurate Monocular SLAM System. IEEE Transactions on Robotics, 31(5):1147– 1163, 2015. ISSN 1552-3098. doi:10.1109/TRO.2015.2463671. [91] D. Nister. An efficient solution to the five-point relative pose problem. IEEE Transactions on Pattern Analysis and Machine Intelligence, 26(6):756–770, 2004. ISSN 0162-8828. doi:10.1109/TPAMI.2004.17. [92] D. Nister, O. Naroditsky, and J. Bergen. Visual odometry. In Proceedings of the 2004 IEEE Computer Society Conference on Computer Vision and Pattern Recognition, 2004. CVPR 2004, pages 652–659, 2004. doi:10.1109/CVPR.2004.1315094. [93] A. Ö. Ok, J. D. Wegner, C. Heipke, F. Rottensteiner, U. Sörgel, and V. Toprak. Accurate Reconstruction of Near-Epipolar Line Segments from Stereo Aerial Images. PFG Photogrammetrie, Fernerkundung, Geoinformation, 2012(4):345–358, 2012. doi:10.1127/1432-8364/2012/0122. [94] C. F. Olson, L. H. Matthies, M. Schoppers, and M. W. Maimone. Rover navigation using stereo ego-motion. Robotics and Autonomous Systems, 43(4):215–229, 2003. ISSN 09218890. doi:10.1016/S0921-8890(03)00004-6.
136
Bibliography [95] E. Rosten and T. Drummond. Machine Learning for High-Speed Corner Detection. In D. Hutchison, T. Kanade, J. Kittler, J. M. Kleinberg, F. Mattern, J. C. Mitchell, M. Naor, O. Nierstrasz, C. Pandu Rangan, B. Steffen, M. Sudan, D. Terzopoulos, D. Tygar, M. Y. Vardi, G. Weikum, A. Leonardis, H. Bischof, and A. Pinz, editors, Computer Vision – ECCV 2006, volume 3951 of Lecture Notes in Computer Science, pages 430–443. Springer Berlin Heidelberg, Berlin, Heidelberg, 2006. ISBN 978-3-540-33832-1. doi:10.1007/11744023_34. [96] E. Rublee, V. Rabaud, K. Konolige, and G. Bradski. ORB: An efficient alternative to SIFT or SURF. In 2011 IEEE International Conference on Computer Vision (ICCV), pages 2564–2571, 2011. doi:10.1109/ICCV.2011.6126544. [97] D. Scaramuzza and F. Fraundorfer.
Visual Odometry [Tutorial].
Robotics & Automation Magazine, 18(4):80–92, 2011.
IEEE
ISSN 1070-9932.
doi:10.1109/MRA.2011.943233. [98] C. Schmid and A. Zisserman. Automatic line matching across views. In IEEE Computer Society Conference on Computer Vision and Pattern Recognition, pages 666–671, 1997. doi:10.1109/CVPR.1997.609397. [99] J. L. Schonberger, A. C. Berg, and J.-M. Frahm. PAIGE: PAirwise Image Geometry Encoding for improved efficiency in Structure-from-Motion. In 2015 IEEE Conference on Computer Vision and Pattern Recognition (CVPR), pages 1009–1018, 2015. doi:10.1109/CVPR.2015.7298703. [100] J. Shi and C. Tomasi.
Good features to track.
In Proceedings of IEEE
Conference on Computer Vision and Pattern Recognition, pages 593–600, 1994. doi:10.1109/CVPR.1994.323794. [101] P. Smith, I. Reid, and A. J. Davison. Real-Time Monocular SLAM with Straight Lines. In M. Chantler, R. B. Fisher, and E. Trucco, editors, British Machine Vision Conference 2006, pages 3.1–3.10. BMVA, [Edinburgh], 2006. ISBN 1-904410-14-6. doi:10.5244/C.20.3. [102] N. Snavely, S. M. Seitz, and R. Szeliski.
Photo tourism.
In J. Finnegan
and J. Dorsey, editors, ACM SIGGRAPH 2006 Papers, page 835, 2006. doi:10.1145/1179352.1141964. [103] H. Strasdat, J. Montiel, and A. J. Davison. ter?
Visual SLAM: Why fil-
Image and Vision Computing, 30(2):65–77, 2012.
ISSN 02628856.
doi:10.1016/j.imavis.2012.02.009.
137
Bibliography [104] J. Sturm, N. Engelhard, F. Endres, W. Burgard, and D. Cremers. A benchmark for the evaluation of RGB-D SLAM systems. In 2012 IEEE/RSJ International Conference on Intelligent Robots and Systems (IROS 2012), pages 573–580, 2012. doi:10.1109/IROS.2012.6385773. [105] J.-P. Tardif, Y. Pavlidis, and K. Daniilidis. Monocular visual odometry in urban environments using an omnidirectional camera.
In 2008 IEEE/RSJ In-
ternational Conference on Intelligent Robots and Systems, pages 2531–2538, 2008. doi:10.1109/IROS.2008.4651205. [106] S. Thrun, W. Burgard, and D. Fox. Probabilistic robotics. Intelligent robotics and autonomous agents series. MIT Press, Cambridge, Mass., 2006. ISBN 9780262201629. [107] B. Triggs, P. F. McLauchlan, R. I. Hartley, and A. W. Fitzgibbon. Bundle Adjustment — A Modern Synthesis. In G. Goos, J. Hartmanis, J. van Leeuwen, B. Triggs, A. Zisserman, and R. Szeliski, editors, Vision Algorithms: Theory and Practice, volume 1883 of Lecture Notes in Computer Science, pages 298–372. Springer Berlin Heidelberg, Berlin, Heidelberg, 2000. ISBN 978-3-540-67973-8. doi:10.1007/3-540-44480-7_21. [108] S. Umeyama. Least-squares estimation of transformation parameters between two point patterns. IEEE Transactions on Pattern Analysis and Machine Intelligence, 13(4):376–380, 1991. ISSN 0162-8828. doi:10.1109/34.88573. [109] C. Vogel, K. Schindler, and S. Roth. 3D Scene Flow Estimation with a Piecewise Rigid Scene Model. International Journal of Computer Vision, 115(1):1–28, 2015. ISSN 0920-5691. doi:10.1007/s11263-015-0806-0. [110] R. von Gioi, J. Jakubowicz, J.-M. Morel, and G. Randall. LSD: A Fast Line Segment Detector with a False Detection Control. IEEE Transactions on Pattern Analysis and Machine Intelligence, 32(4):722–732, 2010. ISSN 0162-8828. doi:10.1109/TPAMI.2008.300. [111] N. von Schmude, P. Lothe, and B. Jähne. Relative Pose Estimation from Straight Lines using Parallel Line Clustering and its Application to Monocular Visual Odometry. In International Conference on Computer Vision Theory and Applications, pages 421–431, 2016. doi:10.5220/0005661404210431. [112] N. von Schmude, P. Lothe, J. Witt, and B. Jähne. Relative Pose Estimation from Straight Lines Using Optical Flow-based Line Matching and Parallel Line Clustering. In Computer Vision, Imaging and Computer Graphics Theory and Applica-
138
Bibliography tions, Communications in Computer and Information Science. Springer, to be published. [113] G. Wang, J. Wu, and Z. Ji. Single view based pose estimation from circle or parallel lines. Pattern Recognition Letters, 29(7):977–985, 2008. ISSN 01678655. doi:10.1016/j.patrec.2008.01.017. [114] L. Wang, U. Neumann, and S. You. Wide-baseline image matching using Line Signatures. In 2009 IEEE 12th International Conference on Computer Vision (ICCV), pages 1311–1318, 2009. doi:10.1109/ICCV.2009.5459316. [115] Z. Wang, F. Wu, and Z. Hu. matching.
MSLD: A robust descriptor for line
Pattern Recognition, 42(5):941–953, 2009.
ISSN 00313203.
doi:10.1016/j.patcog.2008.08.035. [116] J. Weng, T. Huang, and N. Ahuja. Motion and structure from line correspondences; closed-form solution, uniqueness, and optimization. IEEE Transactions on Pattern Analysis and Machine Intelligence, 14(3):318–336, 1992. ISSN 0162-8828. doi:10.1109/34.120327. [117] J. Witt. Visual localization, mapping and reconstruction using edges. Dissertation, Technischen Universität Hamburg-Harburg, 2016. [118] J. Witt and U. Weltin. Robust stereo visual odometry using iterative closest multiple lines. In 2013 IEEE/RSJ International Conference on Intelligent Robots and Systems (IROS 2013), pages 4164–4171, 2013. doi:10.1109/IROS.2013.6696953. [119] C. Xu, L. Zhang, L. Cheng, and R. Koch. Pose Estimation from Line Correspondences: A Complete Analysis and A Series of Solutions. IEEE transactions on pattern analysis and machine intelligence, 2016.
ISSN 0098-5589.
doi:10.1109/TPAMI.2016.2582162. [120] C. Zach, T. Pock, and H. Bischof. A Duality Based Approach for Realtime TV-L 1 Optical Flow. In F. A. Hamprecht, C. Schnörr, and B. Jähne, editors, Pattern Recognition, volume 4713 of Lecture Notes in Computer Science, pages 214–223. Springer Berlin Heidelberg, Berlin, Heidelberg, 2007. ISBN 978-3-540-74933-2. doi:10.1007/978-3-540-74936-3_22. [121] G. Zhang, M. J. Lilly, and P. A. Vela. Learning binary features online from motion dynamics for incremental loop-closure detection and place recognition. In 2016 IEEE International Conference on Robotics and Automation (ICRA), pages 765–772, 2016. doi:10.1109/ICRA.2016.7487205.
139
Bibliography [122] L. Zhang and R. Koch. Line Matching Using Appearance Similarities and Geometric Constraints. In D. Hutchison, T. Kanade, J. Kittler, J. M. Kleinberg, F. Mattern, J. C. Mitchell, M. Naor, O. Nierstrasz, C. Pandu Rangan, B. Steffen, M. Sudan, D. Terzopoulos, D. Tygar, M. Y. Vardi, G. Weikum, A. Pinz, T. Pock, H. Bischof, and F. Leberl, editors, Pattern Recognition, volume 7476 of Lecture Notes in Computer Science, pages 236–245. Springer Berlin Heidelberg, Berlin, Heidelberg, 2012. ISBN 978-3-642-32716-2. doi:10.1007/978-3-642-32717-9_24. [123] L. Zhang and R. Koch. An efficient and robust line segment matching approach based on LBD descriptor and pairwise geometric consistency. Journal of Visual Communication and Image Representation, 24(7):794–805, 2013. ISSN 10473203. doi:10.1016/j.jvcir.2013.05.006. [124] L. Zhang and R. Koch. Structure and motion from line correspondences: Representation, projection, initialization and sparse bundle adjustment. Journal of Visual Communication and Image Representation, 25(5):904–915, 2014. ISSN 10473203. doi:10.1016/j.jvcir.2014.02.013. [125] L. Zhang, C. Xu, K.-M. Lee, and R. Koch. Robust and Efficient Pose Estimation from Line Correspondences. In D. Hutchison, T. Kanade, J. Kittler, J. M. Kleinberg, F. Mattern, J. C. Mitchell, M. Naor, O. Nierstrasz, C. Pandu Rangan, B. Steffen, M. Sudan, D. Terzopoulos, D. Tygar, M. Y. Vardi, G. Weikum, K. M. Lee, Y. Matsushita, J. M. Rehg, and Z. Hu, editors, Computer Vision – ACCV 2012, volume 7726 of Lecture Notes in Computer Science, pages 217–230. Springer Berlin Heidelberg, Berlin, Heidelberg, 2013. ISBN 978-3-642-37430-2. doi:10.1007/978-3-642-37431-9_17. [126] Z. Zhang and Y. Shan. Incremental motion estimation through modified bundle adjustment. In International Conference on Image Processing, pages II–343–6, 2003. doi:10.1109/ICIP.2003.1246687.
140