Visual pattern recognition as a means to optimising building performance? Tristan Gerrish**, Kirti Ruikar*, Malcolm Cook*, Mark Johnson, and Mark Philip**.
Visual pattern recognition as a means to optimising building performance? Tristan Gerrish**, Kirti Ruikar*, Malcolm Cook*, Mark Johnson, and Mark Philip** *Loughborough University **BuroHappold
1 Introduction The move towards the use of smart systems to record data about the performance of building presents an opportunity to examine patterns of behaviour, which shed light on its performance peaks and troughs. Answers often lie within these peaks and troughs. For example, smart systems are used to record in-use data such as room temperatures, thermal comfort, and lighting usage. Each system is designed for an expected ‘behaviour pattern’ that is bounded by a ‘threshold’ boundary. This is the expected performance the system is designed for. Any deviations in this performance may indicate of a system malfunction, its overuse or underuse due to unexpected usage of building space/s (e.g. large number of visitors, doors/windows being left open). Performance when bounded within the threshold limits would be considered to be ‘normal’ or ‘expected’. Thus, answers fall within four categories of performance behaviours. These include system malfunction, system overuse, system underuse, and normal performance. As data and information are accumulated over a period of time they present opportunities to observe system behaviour patterns and present opportunities to map these patterns and classify within learning clusters of ‘expected’ and ‘unexpected’ thresholds. Doing so would enable building owners to truly understand the building, so performance can be firstly understood and then optimised. Thus, an unusual activity that is significantly beyond the expected ‘norm’ would present an opportunity to learn about the building so a healthy function can be determined and maintained. The generation of large datasets through extensive monitoring has created a potential environment in which big-data style analytics could be applied for holistic performance assessment and pattern recognition. This research builds on the work previously completed by Gerrish et al, (2016a, 2016b, 2015, 2014) and utilises techniques of visualisation to demonstrate such behaviour patterns and presents learning opportunities for optimal performance. This is demonstrated through visualisation of energy performance data for a case-study building in the UK.
2 Case-study This research explored how BIM could be used to support non-domestic building Energy Performance Management (EPM). For this purpose, an existing building was used as a casestudy for research development and application. This building was fitted with a comprehensive Building Management System (BMS) to control systems and record energy consumption data (e.g. CO2, temperature, lighting, etc.). The original design documentation and models of the building were available from the onset; however, since the original design was later subject to changes and updated versions were no longer available, it resulted in inaccuracies between the available models and the as-built building. To avoid misinterpretations as a result of inaccuracies, new ‘representative’ models of the as-built building were created. This was thought necessary because by modelling a building’s form, function and constituent systems, the evaluation of design decisions and their impact on a completed building can be better understood and contextualised. Measuring how each of these factors contributes toward its performance provides the designer with an improved understanding of how their decisions impact on the conditional aspects of performance. Thus, the main tasks performed at this stage were, 1) update and consolidate building energy performance related models and information generated during design, using information gathered from the case-study project’s design development directory; and 2) create an as-built modelled representation of the in-use building. This work was undertaken to provide a basis for further research into the operational
1
performance management and investigation of a case-study building using a performance data attributed BIM.
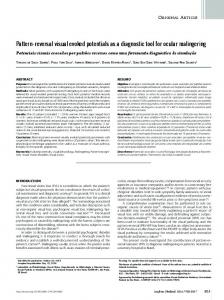
3 The case-study building The case-study building (Fig. 1) is a high-performance office located in the North of England. BuroHappold Engineering contributed to the building’s mechanical, structural, ground, fire and façade engineering designs in addition to providing specialist consulting on security, lighting design, acoustics, sustainability and environment. The primary reason for use of this building was the extent to which it was to be monitored upon completion, from which operational performance information could be obtained. The building is comprised of open-plan offices around a large atrium, conditioned using a complex Heating, Ventilation and Air-Conditioning (HVAC) system fed from two Combined Heat and Power (CHP) engines with gas boiler backups, propane and absorption chillers in conjunction with passive cooling towers and ground tempered ventilation. Space heating and cooling is achieved via perimeter trench heating and passive chilled beams across all floors above ground level, with Fan Coil Units (FCUs) supplementing this at ground floor and in server rooms. These systems are controlled via a BMS with 28 distinct modes of operation depending on external conditions and demand for heating and cooling.
Figure 1: Case-study Building (BuroHappold Engineering and Palin, 2016)
At research commencement, the building was in the process of final fit-out and commissioning, prior to handover and occupation in March 2013. Building geometry information was available in Revit format for architectural and structural detailing; however, mechanical services and building energy performance data were only available in a 2D CAD and the proprietary IESVE (building energy performance modelling and simulation program) format, respectively. Engineering data and level of detail for each discipline (constituting a description of holistic building performance) available at research commencement is detailed in Table 1. Project files containing all building models, building specifications and other supporting documentation and details about the building’s composition, as-designed performance criteria and the methods of operation were obtained and analysed for the purpose of the case-study.
2
Table 1: Building models available at research commencement Discipline
Modelling environment a
Modelled extent
Architectural design
Autodesk Revit Architecture
Geometry (based on preliminary Sketchup models); Orientation; Fabric specification; Junction detailing; Space scheduling; and Materials scheduling (not including performance specification)
Structural engineering
Autodesk Revit Structures
Geometry (based on Architectural specification); and Element performance specifications (from Autodesk Robot and Tekla Structures)
MEP engineering
AutoCAD
Geometry (for detailed junctions only); Electrical systems layout; Ventilation systems layout; CHW layout (including HTCHW and LTCHW); DHWS layout; and All system performance specifications derived from discipline specific tools and calculations to Stage D detail
EPM and sustainability engineering
IES-VE
Location; Geometry (simplified for EPM constraints); Fabric performance specifications; Heating system characteristics; Cooling system characteristics Ventilation system characteristics; and Space-type based thermal profiles
a
Modelling environment in this context is the principal data storage mechanism in which information describing a building's composition and systems is recorded. Modelling environment may also refer to platforms in which this data is generated, such as the IES-VE package and specific MEP design tools; however, these mainly serve to generate such information and provide reasoning for its implementation.
BuroHappold’s role within the building’s design process was that of a consultant engineer providing services during RIBA (2013) Stages 1-4 (with input into Stage 7 for commissioning and sign-off). Creation of system accurate as-built models during these stages were not a priority and for which creation would not be feasible given the likelihood for changes in construction and handover. Research into the use of BIM for managing building energy performance required the building to be supported by information stored in a BIM environment. However, the building was completed at the commencement of the BIM adoption strategy and models other than partial architectural and superseded structural models were unavailable. The client did not specify a BIM delivered project and as such the majority of the information describing the case-study building was primarily in the form of spreadsheets and drawings. The information gathered from handover documentation and from design and commissioning teams informed the development of further ‘enriched’ models in IES-VE and Autodesk Revit to a standard suitable for use in later research.
4 Adopted approach 4.1 Document review Document review was the primary method of collecting information describing the case-study building. Bowen (2009) explains the justification for documentation review as an inexpensive and unobtrusive method of gaining background information that provides a ‘behind the scenes’ view of information available through more prominent sources such as end of work stage reports and/or most recent models. However, a thorough review of all information generated during design could be too time consuming given that it can be subject to bias from selective information survival (Shermer, 2014) (where relevant information is not found due emphasis
3
on the documentation of more favourable information, the potential for incomplete or inaccurate records (Thabet et al., 2016) and often disorganised (Lucas and Bulbul, 2013; Hjelt and Björk, 2006; European Construction Research Network, 2005). Initially, the models developed by the design teams and their supporting documentation were obtained. These provided a comprehensive dataset detailing the building’s composition and its intended energy performance. A meta-analysis of the project’s documentation structure was undertaken showing the extent of information generated throughout design (Fig. 2). The majority of this information would likely be out-of-date upon building handover due to changes made throughout the design development, and the length of time between creation and utilisation of such information. Large numbers of simulation files created at early stages are likely disproportionate due to the number of documents created to support analysis between Preparation and Developed Design.
Figure 2: Design documentation type production frequency
4.2 Preparation and developed design Reports signifying handover of information for the next stage of design provided the primary source of information describing the building, and expected levels of performance; however, following handover to the specialist contractors at the Technical Design stage, changes became less documented. Handover documentation and drawings compiled into Operations and Maintenance (O&M) manuals provided the most concise and structured source of information from which to draw accurate designed performance and configuration data. However, just as Gallaher et al. (2004, pp. 3.3-3.6) found, this too contained errors from corruption in storage media and out-of-date documentation. Reliance on existing data would have likely produced further error later in research, providing justification for manual recreation of building performance and BIM environments.
4.3 Baseline performance model The most up to date building energy performance model that was available for this research was completed 2 years prior to construction. There were several differences between the ‘asdesigned’ and ‘as-built’ building, which would most likely result in gaps between predicted and in-use performance if comparisons were to be made. Differences between design and in-use performance depiction A substantial difference was identified between how prediction and measurement of the building’s performance differed. For example, the partial layout used in simulation simplified geometry to reduce simulation and modelling times; however, operational monitoring divided spaces in a completely different way for sub-metering (Fig. 3). These differences demonstrate one of the challenges in linking BIM and EPM, correlating their often-conflicting modelling requirements across discipline domains (Coakley et al., 2014; Bazjanac, 2008).
4
(a) Simplified EPM layout for simulation efficiency (61 spaces)
(b) EPM layout required for accurate simulation of spatial performance (79 spaces)
(c) Actual building control layout used by the BMS (36 spaces)
Figure 3: Spatial delineation differences for simulation and operation of a building’s systems on a representative floor-plan
Creating an as-built performance model Visual representation of complex operation of spatial conditioning in an energy performance model was attempted, incorporating changes found in the operations of the building. Using IES-VE (Integrated Environmental Solutions, 2016), a space-wise simulation of air supply and extract in conjunction with calibration of space-based electrical loading using available BMS monitored performance information was attempted; however, the complexity of the case-study building’s HVAC systems prevented completely accurate modelling of these and would have required excessive time in model calibration (Coakley et al., 2014), for which there was little justification in the context of this research. A simplified representation of the completed building’s composition was created without definition of the specific systems providing heating, cooling and ventilation, resulting in a less detailed and more general prediction of whole buildings energy performance, for the purpose of providing a baseline for comparison. The method used for creation of the representative model is defined by the U.S. Department of Energy (2002), which gives guidance for evaluation of holistic building energy. In particular, this method was chosen given the substantive effects of each complex HVAC system of operation, making isolation of these effects complex beyond the purpose of providing a baseline energy performance model.
4.4 BIM environment for performance data interaction This research began (in 2014) at the time when the mandated 2016 target for Level 2 BIM adoption had prompted many UK companies to take measures towards BIM readiness. This period also saw a drive from the Government to achieve energy efficiency targets, which prompted several buildings being designed to high-performance standards. The case-study building achieved a BREEAM Outstanding rating, which presented a ‘test-bed’ opportunity to examine, if/how data from energy simulation models could be linked to a BIM. The thinking at the time being that if the target of the industry had been to ultimately achieve ‘single model capability’, then this would be an effort to unify the currently disparate datasets, so process efficiency could be enhanced, and performance targets met. This was why a BIM focus was a starting point. Also, the case study building was fitted with state-of-the-art monitoring and management systems generating large amounts of energy performance data that provided valuable learning opportunities. The amount of information available at the stages of research commencement provided a rich source of data from which a BIM could be built, even when the majority of this information was stored in formats not directly compatible with transfer to a BIM environment without significant effort. The impact this has on building design development was identified by MacLeamy (2010), with Fig. 4 demonstrating how BIM is changing the information creation process.
5
Figure 4: MacLeamy curve, representing the effort required to change construction design per stage of design development (MacLeamy, 2010)
During the development of a BIM in which to store building energy performance information, methods of creating and transferring information within and outside the Revit platform were attempted. Lee et al. (2016), Kim et al. (2016), and Yalcinkaya and Singh (2015) all identified the potential for error inclusion in this process, with many of these errors encountered, including: • • • •
Interpretation of space bounding elements was variable across modelling tools. EPM tools require simplified geometry, but methods of simplifying this geometry are not yet available to the accuracy required for appropriate simulation use; Surface orientation necessary for EPM not inferred correctly; Intersections and slivers created as a result of poor geometry interpretation; and Data attribution lost between BIM authoring tools (geometric spaces ceased to be associated with their space meta-data).
In addition to user error, the remaining faults in data transfer came from incompatibility of data handling across modelling platforms, where interpretation and storage of information may differ significantly between tools, resulting in incompatible representation of the others original information (Gerrish et al., 2016c; Gerrish et al., 2015). It was therefore determined that the BIM environment should be simplified similar to the building energy performance model, to provide a platform in which data could be attributed, without excess complexity of modelling preventing any modifications later made to support the research. Spaces monitored by the onsite BMS were modelled (comprising all inhabited areas within the building and plant and service spaces without regular occupancy), with their design performance attributes provided by the energy performance model to provide a performance describing BIM.
5 Output The simplified BIM which was used as the basis for data attribution was manually rebuilt using the process described in Section 4.4 to avoid errors in data translation, and contained basic geometry describing the building’s form, with space meta-data describing purpose and predicted performance (from IES-VE) for comparison with operational data when available (Fig. 5). The impact of simplification of the building modelled against the as-built building had little effect on the overall outcome of this research (Section 6), given the purpose of that simplification and granularity of data collected in the as-built building. However, the need for this simplification was indicative of the extent of computing power, memory and data storage ontologies required to support the processes demonstrated in Section 4.3, necessitating more structured and efficient means of handling descriptive building performance information.
6
(a) Space model
(b) Space meta-data
Figure 5: Simplified partial BIM containing only spaces and their characteristic performances
5.1 BIM and performance meta-data extraction Data extraction from a BIM environment often requires access to the model via the same platform in which that model was created (Aranda-Mena and Wakefield, 2006). Codinhoto et al. (2013) identified that access to data stored within BIM environments is a factor in reducing its adoption by Facilities Management (FM). Accessibility has increased through development of tools interoperating between BIM authoring platforms (Khaja et al., 2016); however, a gap between the data generated during design and use remains that could be overcome using basic data management techniques. Because of the proliferation of open exchange formats such as Industry Foundation Classes (IFC), information can be accessed via less costly viewing tools and open source alternatives. A Dynamo (Autodesk, 2015a) script extracting space geometry information in conjunction with related spatial performance meta-data of the case-study building was created (Gerrish et al., 2017b). This information was extracted from the Revit BIM environment into a JavaScript Object Notation (JSON) lightweight data-interchange format (an object-mappable file which could be queried and accessed without need for proprietary software) capable of interpretation via the development language used. Utilising a non-standard format for extracting and processing data from the BIM environment distinguished the non-platform specific barriers to wider implementation of BIM from its authoring software. Dynamo was also used to attribute predicted performance data to the design model as meta-data describing spatial and system performance (Fig. 6). The more widely used IFC format was also considered as an appropriate carrier for this information but given the limitations in extract from Revit into this format and potential loss of data (Solihin et al., 2015), the alternative was created to avoid these errors and specify exact data to be included in output of a lightweight and platform agnostic format.
Figure 6: Data transfer, extraction and visualisation process
7
Use of these tools suggest a potential change in the role of the engineer in this process, as applied programming requires knowledge of the purpose of that programming, and where creation of scripts automating engineering processes must account for the needs of the engineer and the task. Khaja et al. (2016) and Fan et al. (2015) suggest that the skills necessary for these processes are becoming more common yet lag behind the pace of development of tools in this area. The potential for handling of large amounts of information in this way also suggests the platforms commonly used to design, organise and access engineering related data may not be suitable (Rathore et al., 2016; Fan et al., 2015), and demonstrate a need for new tools to assist in this new data paradigm. The Dynamo script used to extract space performance meta-data from the simplified BIM shown in Fig. 7, outputting a JSON file interpretable outside any proprietary BIM authoring environment.
(a) Dynamo script
(b) Revit data extract
Figure 7: Dynamo script with psuedocode annotation describing BIM data extraction process
At this stage of research, the method used to interact with this data was undefined; therefore accessibility of data was essential to support later development of BIM and building performance linking tools (further justification for this choice and description of the data extraction and interaction process given in Section 6).
5.2 Summary and findings Collation of this data into a set of parametrically rich models created an environment from which performance data could be extracted, linked and utilised for later investigation of BIM as a performance management tool. Several findings were made throughout the collection and utilisation of data for creation of representative models, the conclusions of which include: •
Upon creation of handover documentation (in O&M manuals and related drawings, guides and specifications), information describing the building is already out of date. Changes made during commissioning of the building may not be reflected in documentation, nor changes made during occupation where occupant behaviour and use of space can vary
8
•
•
•
significantly from design specifications (Wolfe et al., 2014; Clevenger and Haymaker, 2006). The result of these changes can be incorrect operation of conditioning systems to conditions no longer required, excess energy consumption through inefficient operation of plant equipment and discrepancies between the building its operational documents resulting in slower fault finding and fixing by FM; Requirements for simulation models do not translate well from BIM. These include the quality of space bounding (Bazjanac, 2010), interpretation of meta-data between simulation tools (Bazjanac, 2008) and level of detail suitable for inclusion in each environment (Gerrish et al., 2016c); A large amount of information is being duplicated and superseded using traditional documentation methods (Section 4.1). Until revision control as part of BIM implementation can be implemented as a standard working process, the inclusion of superseded or incorrect documents in ongoing design development is likely to continue, furthered by the utilisation of multiple design development platforms outside federated and integrated modelling environments (Dubler et al., 2010); and The data extracted from the embedded smart energy systems was largely numeric in nature, representing different metrics (e.g. lighting in kWh, CO2 in ppm, and temperature in °C). It is a challenge to interpret meaning from this amount of information or identify trends ‘hidden’ within this voluminous dataset without predefined methods for processing or summary, if sense is to be made from it and the learning extracted.
From research outset, it was evident that the volume of information being generated through build monitoring, presented ‘sense-making’ challenges using conventional graphical and tabular means. Thus, it was thought appropriate to visualise the data to cut out the ‘noise’ and observe the data trends visually. These visualisation techniques mapped the performance and helped with understanding the performance ‘behaviour pattern’. If conforming to the norm, the values would typically fall within a normal expected performance boundary. Outliers would be indicators of a system malfunction, its overuse and underuse due to unusual usage of building space/s (e.g. large number of visitors, doors windows being left open). This ‘visual performance map’, presents opportunities to develop intervening strategies that prompt ‘remedial’ actions so that the expected boundary conditions are maintained, lessons captured and performance optimised. This approach to visualising large volumes of data describing building performance is novel and presents ‘learning’ opportunities for the future. As a ‘critical mass’ of data about buildings and their performance behaviours is accumulated, so will the opportunity to maintain ‘healthy’ buildings grow. These are the next big steps for industry to avail of and learn from. Examples of some of the visual performance trends are included in Fig 8, showing where metering was incorrectly installed, thus not reporting values, where further calibration of sensors may be required and allowing the viewer to immediately recognise performance trends and outliers. For a building with 1000 sensors, each monitoring at 1-second intervals and storing values in an SQL database in float format (at 8-bytes each), this would result in 691.2 megabytes being generated each day. Because of the magnitude of the data, the first and foremost challenge was to represent the data in a simple format so that ‘trends’ could be observed, then classified and learning opportunities exploited. For example, Fig 8b shows annual lighting load for a single zone in the case-study building, clearly showing where it is automatically dimmed during the summer months where more natural light is available, and where occupant sensing is present. Interesting patterns visible include the operation of lights overnight corresponding to security walk rounds, changes between days of week for operational periods and indication that on some days the daylight dimming is not working (later discovered to be due to occupants leaving blinds down preventing the light sensors from reducing the artificial lighting levels).
9
(a) Visual spatial performance
(b) 2D-histogram historic space/systems performance log
(c) Summary performance record
Fig 8. Data Visualisation from a BIM and BMS records using Python Pandas and Matplotlib
6 Method for the management of building performance data using design data A method to link predicted performance data with and monitored data captured during the occupation of the case-study building was developed by applying the findings determined through the previous tasks. The aim being to develop a prototype for the interconnection of these two distinct, yet related sources of performance information using existing technologies. A triangulation approach using a version of throwaway prototyping was applied to this task. This is the process of rapidly developing elements for incremental inclusion into a finished system. As no commercially applicable system was developed here (instead favouring the rapid development of a prototype), the composite elements created were used to evaluate the potential for, and challenges in implementing a system using BIM for performance analysis and management, demonstrating integration of the systems necessary for BIM performance management (Korpela et al., 2015).
6.1 Extraction from the BIM environment The BIM environment to which data would be related was created in Section 5, where simplification of the as-designed BIM environment was used to generate a basic representation of the building as the BMS understands it. Extraction of static design information held in that environment into a lightweight, platform independent attribute-variable format (JSON) provided a means of accessing such information without the need for proprietary software the building users may not have. JSON was chosen due to the researcher’s familiarity with the format, its human interpretable structure and extensive support for parsing by multiple programming languages. Alternative
10
formats are available, including IFC; however, in earlier investigations it was found that the existing data attribution capabilities of IFC for extensible meta-data attribute storage was limited and could potentially result in inaccessible or poorly structured data within the building model (Gerrish et al., 2015). Storage in a related Binary JavaScript Object Notation (BSON) format was considered, utilising a MongoDB database (MongoDB, Inc., 2016) method of data storage; however, given the requirements for speed and portability in developing the throwaway prototype HDF5 was chosen as a storage format for the monitored performance data instead. This method of structuring large datasets in hierarchical data tables indexed using timestamps provided and highly responsive method of accessing and processing descriptive time-series performance data.
6.2 Making BIM data accessible Data provided upon building handover is usually held in conventional formats such as spreadsheets, documents and drawings. This secondary data, while useful for quick interpretation and extraction of meaning, does not easily support further processing due to the limits imposed upon it by the processing already undertaken. Pollock (2007) suggests the deficits to portrayal of information in this way include restrictions on access, reliance on interface-centric rather than data-centric views of information and undue effort placed on formatting of the usable data both by designers and processors, potentially limiting actions ensuring the accuracy and availability of all supporting information. Utilising design-stage building energy performance data is contingent on its availability, accuracy and usability in a form manageable by the applied tools and methods. A key factor allowing attribution of building performance information to spaces and systems are comparable objects to which that data can be linked. Attribution of data to an object representing one of these elements must utilise an identifier distinguishing that element from others, relatable between models and datasets. This was achieved here by using common space and system names between the BIM and BMS datasets, but could be replicated with adherence to naming conventions and creation of dictionaries relating disparate yet related datasets where commonality is unavailable. Script 1 shows the JSON format used as the carrier for design-based BIM data, for connection with times-series performance information from the BMS. The file this represents was created using the Dynamo script shown in Fig. 7, containing basic information, constituting an as-designed description of the Revit models spatial composition and performance characteristics. {
}
"spaces":[ { "name": "Core 1", "level": "Level 00", "area": 199.094991, "volume": 537.556476, "heating_load": 85479.512854, "cooling_load": 117369.501888, "temperature_setpoint": 24.2, "co2_set-point": 1000, "humidity_setpoint": 85, "air_supply": 28.849089, "power_load": 0.000000, "lighting_load": 0.000000, "xs": [-7.293294, -7.107399, ..., -6.995794, -7.293294], "ys": [21.9836, 22.941124, ..., 20.854315, 21.026077] }, { ... } ]
Script 1: Example JSON format space object characteristic extracted from Autodesk Revit using Dynamo
The processing required to create the datasets supporting the link between data in a BIM environment and in performance design and monitoring systems requires skills in areas which
11
designers and operators may not possess. Automation of these processes would be necessary for implementation in a wider range of projects, for which standardisation of procedures and design documentation would be required. Existing standards detailing the naming, storage and data handling methods in and around BIM environments (such as the Data Dictionary provided by BuildingSMART (2016a) and BSI (2007b) on which it is based), would provide a good starting point from which automation could be developed.
6.3 Data relation Kohlhase (2013), Thorne and Ball (2005), Chen and Chan (2000), and Hendry and Green (1994) identify the limitations of data portrayal as it implemented in a BMS currently, with visualisation of the data being collected an integral part to the tools developed here. Those limitations include speed of access, interpretation and action through ineffective information structuring, relying on user familiarity with the document rather than self-documented logical data structuring such as that shown in Script 1. Following sourcing, extraction and processing of data, a means of accessing both the BIM (as a JSON file) and BMS (as a HDF5 file) was developed. The need for efficient handling of time-series performance data collected by the BMS and sensor network throughout the case-study building was essential, given the intractability of monitored data and requirement for ease of interpretation by building operators in identifying performance trends and opportunities for improvement. The existing means of querying data from the BMS was inefficient due to the lack of indexing applied to collected data in the SQL environment (Gerrish et al., 2017b), and would be an inhibiting factor in the portrayal of performance data linked to the BIM in other buildings. This was implemented in the case-study building without accessibility to information by FM without supervision by the providers of the BMS software, significantly increasing the time taken to identify performance deficiencies and trends. The solution developed was based upon static representation of the as-designed building and its historical performance up to the point at which extraction of such data is made from the BMS; however, there is potential for a link between a live representation of the as-managed building as both a descriptive model and monitored performance, given efficient access to this data and the continuous update of a representative model. The tools used in the development of a method for linking BIM and performance monitoring are indicated in Table 2. Sources of information for this process are typical of commonly used industry standard software, supplemented by the programming language used in the case-study (Python) and supporting packages included as the means through which data interoperability and interpretation was achieved between the two environments. Table 2: Software used during development of the BIM-linked performance monitoring method Software IES-VE (Integrated Environmental Solutions, 2016) Autodesk Revit (Autodesk, 2015c) Autodesk Dynamo (Autodesk, 2015a) Andover Continuum Cyberstation SQL Server 2008 Python: Pandas (McKinney, 2010)
Matplotlib (Hunter, 2007) Ipywidgets (Pérez and Granger, 2007)
Function Modelling and simulation of building performance Modelling and attribution of descriptive performance meta-data to objects and spaces in a BIM environment Extraction of geometry and meta-data from Autodesk Revit into a lightweight data-interchange format (JSON) Front-end interface to BMS Back-end BMS storage of historic performance data Extraction of data from SQL Server, cleaning of extracted data and code to interlink JSON file with queryable HDF5 performance data store Visualisation of performance data and user interaction elements
12
Data relation process Fig. 9 illustrates the process followed in gathering and linking the data contained within the distinct datasets, associating data from the BMS to objects within the BIM without specification of distinct software. These actions represent high-level processes by which the data is generated, collected and utilised from the prediction of building energy performance to its storage in a BIM environment, and connection to monitored performance from a BMS. A prescriptive methodology is unsuitable for the wider industry given the non-homogeneity of design and operation methods, tools and processes, and the need for implementation considering the needs of each individual building project (Gerrish et al., 2017b).
Figure 9: BIM/performance data information flow and linking process
Data portrayal The purpose of linking design and operation data has been to provide a method of performance interpretation for those responsible for occupying, operating and managing the performance of that building. The following tools supported by the BIM/BMS link developed here are described, indicating the capabilities of such a system and its potential for BIM supporting performance management through basic interpretation and connection of data using an efficient, open and accessible method.
Space attributes The monitored spatial performance descriptors of CO2 levels, temperature, humidity, power and lighting energy consumption are attributed to the geometry extracted from the accessible JSON format and interpreted via Python. Quick visualisation of spatial performance in a floorplan enables the operator to identify areas of performance deficiency to focus efforts on remediation and optimisation. A snapshot in time for Level 02 is shown in Fig. 10 showing spaces and their individual monitored variables. Several spaces lighting and small power monitoring are not available, indicating potential errors in the sensors or BMS monitoring these.
13
(a) Temperature (°C)
(b) Relative humidity (%)
(a) Power (kWh)
(a) CO2 (ppm)
(a) Lighting (kWh)
Figure 10: Space attributes showing ‘snapshot’ performance characteristics
2D-histogram of historical performance Historic portrayal of performance in a 2D-histogram format has been demonstrated by Yarbrough et al. (2015) and Meyers et al. (1996) as providing a suitable means of efficiently displaying large amounts of time-series data. Application to the data collected show some significant trends and opportunities for improvement in the management of the case-study building. Spatial performance characteristics shown in Fig. 11 show how occupant behaviour can be inferred from monitored performance, where monitoring is implemented correctly. Periods where the meeting room described in Fig. 11a is occupied can be clearly seen as increases in local CO2 levels, with the space identified as unoccupied for 68% of the time during occupied hours 1. The rate of air change can also be compared against external CO2 levels; as the building is vacated at the end of the day and ventilation systems turn off, the amount of ambient CO2 in the air spikes around 20:00 and returns to external ambient conditions. 0F
A trend towards less efficient performance can be identified in Fig. 11b, with a 23% increase in energy used for lighting between the first and second halves of the year following the change in operational hours from 06:30-23:30, to 24-hour use. Lights should turn off automatically during unoccupied hours which are not happening as indicated by the 2.2kWh base load overnight following the change (a 49 % increase in unoccupied lighting loads).
1 During 2015 and between 08:00 and 18:30, 2343 out of a possible 3443 hours showed CO levels 2 within 10% of the external ambient CO2 level.
14
(a) Meeting room CO2 concentration
(b) Gym lighting power consumption
Figure 11: Time-series plot and heat-map spatial performance visualisation
Performance summary Summarising the energy consumed by distinct spaces within the building is useful to the FM and estates management team to understand where energy has been used, and how each metered space compares to identify opportunities for improvement. Following data cleansing and storage in an HDF5 file, the process used to query data and create Fig. 12 took seconds rather than the hours required for extraction from the un-optimised BMS SQL database, demonstrating the room for improvement in this process. Using Pandas (McKinney, 2010), analysis resolution can be easily adjusted to show more granular detail, showing the effects of holidays and the daylight dimming in-place across the floor analysed (Fig. 12c), with user interaction modifying summary parameters to explore all aspects of the building’s spatial performance.
(a) Level 00 summary small power consumption
15
(b) Level 00 summary lighting power consumption
(c) User interactive performance summary
Figure 12: Case-study building lighting and small power summaries
The trends expected from such data, in-line with the patterns of use and response to external and internal climate factors are classified as multiplicative, resulting from those factors generated from differential responses to white noise inputs. As such, analysis of this data requires a combination of approaches to account for the variability between predictable (timeof-day, day-of-week, season-of-year) and unpredictable (occupant behaviour, system operation issues and unexpected) influencers. Therefore, the data obtained corresponds to periodic and sinusoidal variations, oscillating according to diurnal, weekly and seasonal differences (Shumway and Stoffer, 2006).
Aggregation for diurnal trend analysis As the amount of data made available to FM increases, the opportunities for trend analysis of operational profiles increase correspondingly, with access to many data points from which to draw aggregated profiles of operation. Fig. 13 demonstrates this, showing how water use by the whole building varies per season and weekday, and signifying the average setback consumption outside occupied hours. While not strictly BIM application to performance management, the processes followed to enable access to information efficiently to support BIM integration, forces the monitored data to be efficiently structured, enabling analysis extemporaneous to conventional summation and averaging (Gerrish et al., 2016b).
16
Figure 13: Aggregated mean diurnal profiles based on day of week and time of year
Predicted performance disparity indication The primary means of distinguishing performance disparity between the predicted and monitored building using the BIM and BMS data sources is achieved via the creation of a ‘performance dashboard’ using Python. This uses the set-points defined within the JSON BIM representation, in conjunction with the data collected via the BMS to indicate levels of performance of the operational building compared with these. Fig. 14 shows a snapshot of this dashboard. Many meters are non-reporting (due to commissioning issues), indicating significant room for improvements in installation and commissioning of the sensors network and metering system. Spaces at above the specified maximal operating conditions are indicated for attention of the building operator.
Fig. 14 Snapshot of the dashboard with interactive settings to override and adjust sensitivity settings for the indicators
7 Validity and application The case-study approach and wide variability across the AEC industry means generalisation of research findings is difficult. The findings presented here are based on research methods developed with consideration of their applicability to the processes being examined, with those methods employed to generate widely applicable findings. Reliability of the data used is dependent on the systems in place recording that data describing the building being monitored; however, the processes utilising that information presented here may be applied to other nondomestic buildings and are not specific to the case-study. The following issues were noted with the data collected here: • • •
Data collected from the case-study building’s BMS was processed to remove errors, potentially reducing its accuracy; Spatial performance attributes may not be attributed to the correct spaces in the tool demonstrating a BIM and performance data link due to the BMSs lack of structure at the point of data extraction; however, this does not impact findings; and The changeable design environment in which BIM is applied means replication of the processes detailed here on other projects may be difficult. However, care was taken to avoid specification of methodologies relevant only to the case-study used, and conclusions made relevant to the wider construction industry.
8 Discussion and conclusions The move towards the use of systems to record data about the performance of building presents an opportunity to examine patterns of behaviour, which shed light on the performance peaks and troughs. Answers often lie within these peaks and troughs. Each system is designed for an expected ‘behaviour pattern’ within a ‘threshold’ boundary. This is the expected performance the system is designed for. Any deviations in the performance are indicators of a system malfunction, its overuse or underuse, and identification of these is essential for continuous optimisation of building performance and operation. Performance when bounded within the threshold limits would be considered to be ‘normal’ or ‘expected’. Thus, answers fall within four categories of performance behaviours. These
17
include system malfunction, system overuse, system underuse, and normal performance. Simple classification of these enables grouping of identified trends; however, automated identification would require more in-depth learning using larger datasets, machine-learning techniques and expertise of building operators to categorise patterns across a hugely variable data landscape. Data being collected over a period of time presents opportunities to observe system behaviour patterns and map those patterns for classification within learning clusters of ‘expected’ and ‘unexpected’ thresholds. Doing so would enable building owners to truly understand the building, so performance can be firstly quantified and then optimised. Thus, an unusual activity that is significantly beyond the expected ‘norm’ would present an opportunity to learn about the building so a healthy function can be determined and maintained. Numeric datasets of the types being generated in modern buildings present significant challenges and require application of complex algorithms to sift through data and subsequently characterise it. Generation of large datasets across multiple buildings through extensive monitoring has created the potential for application of data analytics for holistic performance assessment and pattern recognition. In order to make the most of this plentiful source of data, its management during design and operation must be considered. This paper demonstrated how large volumes of performance data could be organised visually, so performance trends are first observed, queried and classified, and then lessons learnt are fed back for further performance enhancement. This, when combined with the development of a standard information structure and a measured building performance data ontology would negate the need to manually process information prior to analysis and reduce steps necessary to interpreting patterns and identifying trends. Application of techniques used in the IT sector, and adherence to common standards could make this possible; however, the skills necessary to implement this can be a barrier to its adoption. For this gap to be met, a new breed of ‘building’ researcher and/or consultant with a complex skillset is needed. They who would be adept at not only understanding (and subsequently interpreting) the design considerations and performance requirements of clients but would also be skilled in programming and navigating multiple environments, such as those outlined in Figure 6. This would ensure that the vast volume of data extracted from complex systems is firstly organised and classified in a meaningful way, relevant queries are determined, trends are observed, and visual representation techniques used to derive new meaning and determine new classifications.
9 References Aranda-Mena, G. and Wakefield, R. (2006). “Interoperability of building information – myth or reality?” In: eWork and eBusiness in Architecture, Engineering and Construction. Proceedings of the European Conference on Product and Process Modeling (ECPPM). (Sept. 13–15, 2006). Ed. by M. Martinez and R. Scherer. Valencia, Spain: Taylor & Francis Group, pp. 127–133. Autodesk (2015a). Dynamo. Version 0.9.0. URL: http://dynamobim.org (visited on 2016-03-03). Autodesk (2015b). Revit. Version 2016. URL: http://www.autodesk.co.uk/products/revit-family/overview (visited on 2016-03-03). BSI (2007b). ISO 12006-3:2007. Building construction – Organization of information about construction works – Part 3: Framework for object-oriented information. British Standards Institution. Bazjanac, V. (2008). “IFC BIM-based Methodology for Semi-Automated Building Energy Performance Simulation”. In: Proceedings of CIB W78. (July 15–17, 2008). Santiago, Chile. Bazjanac, V. (2010). “Space Boundary Requirements for Modeling of Building Geometry for Energy and Other Performance Simulation”. In: Proceedings of CIB W78. (Nov. 16–18, 2010). Cairo, Egypt. Bowen, G. A. (2009). “Document Analysis as a Qualitative Research Method”. In: Qualitative Research Journal 9 (2), pp. 27–40. DOI: 10.3316/QRJ0902027. BuildingSMART (2016a). BuildingSMART Data Dictionary. URL: http://bsdd.buildingsmart.org (visited on 2016-0703). BuroHappold Engineering and Palin, T. (2016). One Angel Square, Manchester. Chen, Y. and Chan, H. C. (2000). “Visual Checking of Spreadsheets”. In: Proceedings of The European Spreadsheet Risks Interest Group. (July 2000). Greenwich, London: EuSpRIG.
18
Clevenger, C. M. and Haymaker, J. (2006). “The impact of the building occupant on energy modeling simulations”. In: Proceedings of the International Conference on Computing in Civil and Building Engineering (ICCCBE). (June 14–16, 2006). Montréal, Canada, pp. 1–10. Coakley, D., Raftery, P., and Keane, M. (2014). “A review of methods to match building energy simulation models to measured data”. In: Renewable and Sustainable Energy Reviews 37, pp. 123–141. DOI: 10.1016/j.rser.2014.05.007. Codinhoto, R., Kiviniemi, A., Kemmer, S., Essiet, U. M., Donato, V., and Tonso, L. G. (2013). “BIM-FM Implementation: An Exploratory Investigation”. In: International Journal of 3-D Information Modeling 2 (15), pp. 1– 15. DOI: 10.4018/ij3dim.2013040101. Dubler, C. R., Messner, J. I., and Anumba, C. J. (2010). “Using Lean Theory to Identify Waste Associated with Information Exchanges on a Building Project”. In: Proceedings of the Construction Research Congress (CRC). (May 8–10, 2010). Alberta, Canada: American Society of Civil Engineers, pp. 708–716. DOI: 10.1061/41109(373)71. European Construction Research Network (2005). E-CORE Strategy for Construction RTD. URL: http://www.ecore.org/strategy (visited on 2016-06-15). Fan, C., Xiao, F., Madsen, H., and Wang, D. (2015). “Temporal knowledge discovery in big BAS data for building energy management”. In: Energy and Buildings 109, pp. 75–89. DOI: 10.1016/j.enbuild.2015.09.060. Gallaher, M. P., O’Connor, A. C., Dettbarn, J. L., and Gilday, L. T. (2004). Cost Analysis of Inadequate Interoperability in the U.S. Capital Facilities Industry. NIST GCR 04-867. Gaithersburg, MD: National Institute of Standards and Technology. Gerrish, T., Cook, M. J., and Ruikar, K. (2016a). “BIM for the management of building services information during building design and use”. In: Science and Technology for the Built Environment 22 (3), pp. 249–251. DOI: 10.1080/23744731.2016.1156947. Gerrish, T., Ruikar, K., Cook, M. J., Johnson, M., Phillip, M., and Lowry, C. (2017b). “BIM application to building performance visualisation and management: Challenges and potential”. In: Energy and Buildings 144. DOI: 10.1016/j.enbuild.2017.03.032. Gerrish, T., Ruikar, K., Cook, M. J., Johnson, M., and Phillip, M. (2015). “Attributing in-use building performance data to an as-built building information model for life-cycle building performance management”. In: Proceedings of CIB W78. (Oct. 27–29, 2015). Eindhoven, The Netherlands: CIB. Gerrish, T., Ruikar, K., Cook, M. J., Johnson, M., and Phillip, M. (2016b). “Analysis of basic building performance data for identification of performance issues”. In: Facilities 35 (13/14). DOI: 10.1108/F-01-2016-0003. Gerrish, T., Ruikar, K., Cook, M. J., Johnson, M., and Phillip, M. (2016c). “Using BIM capabilities to improve existing building energy modelling practices”. In: Engineering, Construction and Architectural Management 24 (2). DOI: 10.1108/ECAM-11-2015-0181. Gerrish, T., Ruikar, K., and Cook, M. J. (2014). “Cross discipline knowledge transfer for concurrent BIM adoption in an engineering organisation”. In: Proceedings of the 2014 CIB W55/65/89/92/96/102/117 & TG72/81/83 International Conference on Construction in a Changing World. (May 4–7, 2014). Kandalama, Sri Lanka: CIB. Hendry, D. G. and Green, T. R. G. (1994). “Creating, comprehending and explaining spreadsheets: a cognitive interpretation of what discretionary users think of the spreadsheet model”. In: International Journal of HumanComputer Studies 40 (6), pp. 1033–1065. DOI: 10.1006/ijhc.1994.1047. Hjelt, M. and Björk, B.-C. (2006). “Experiences of EDM usage in construction projects”. In: Journal of Information Technology in Construction 11, pp. 113–125. Hunter, J. D. (2007). “Matplotlib: A 2D Graphics Environment”. In: Computing in Science & Engineering 9 (3), pp. 90–95. DOI: 10.1109/MCSE.2007.55. Integrated Environmental Solutions (2016). Virtual Environment 2015. Version 2015. URL: https://www.iesve.com/software/ve-for-engineers (visited on 2016-01-01). Khaja, M., D, S. J., and McArthur, J. J. (2016). “Optimizing BIM Metadata Manipulation Using Parametric Tools”. In: Procedia Engineering 145, pp. 259–266. DOI: 10.1016/j.proeng.2016.04.072. Kim, H., Anderson, K., Lee, S.-H., and Hildreth, J. (2013). “Generating construction schedules through automatic data extraction using open BIM (building information modeling) technology”. In: Automation in Construction 35, pp. 285–295. DOI: 10.1016/j.autcon.2013.05.020. Kohlhase, A. (2013). “Human-Spreadsheet Interaction”. In: Human-Computer Interaction – 14th INTERACT International Conference. (Sept. 2–6, 2013). Ed. by P. Kotzé, G. Marsden, G. Lindgaard, J. Wesson, and M. Winckler. Vol. 8210. Cape Town, South Africa: Springer Berlin Heidelberg, pp. 571–578. DOI: 10.1007/978-3-64240498-6_47. Korpela, J., Miettinen, R., Salmikivi, T., and Ihalainen, J. (2015). “The challenges and potentials of utilizing building information modelling in facility management: the case of the Center for Properties and Facilities of the University of Helsinki”. In: Construction Management and Economics 33 (1), pp. 3–17. DOI: 10.1080/01446193.2015.1016540. Lee, S.-K., Kim, K.-R., and Yu, J.-H. (2014). “BIM and ontology-based approach for building cost estimation”. In: Automation in Construction 41, pp. 96–105. DOI: 10.1016/j.autcon.2013.10.020.
19
Lucas, J. and Bulbul, T. (2013). “An object-oriented model to support healthcare facility information management”. In: Automation in Construction 31, pp. 281–291. DOI: 10.1016/j.autcon.2012.12.0142. MacLeamy, P. (2010). The Future of the Building Industry: The Effort Curve. HOK. URL: https ://youtu.be/9bUlBYc_Gl4 (visited on 2016-06-14). McKinney, W. (2010). “Data Structures for Statistical Computing in Python”. In: Proceedings of the 9th Python in Science Conference. (June 28–July 3, 2010), pp. 51–56. URL: http://pandas.pydata.org (visited on 2016-04-01). Meyers, S., Mills, E., Chen, A., and Demsetz, L. (1996). “Building Data Visualization for Diagnostics”. In: ASHRAE Journal, pp. 63–72. MongoDB, Inc. (2016). MongoDB 3.2. MongoDB, Inc. URL: https://docs.mongodb.com/manual (visited on 201608-26). Pérez, F. and Granger, B. E. (2007). “IPython: A System for Interactive Scientific Computing”. In: Computing in Science & Engineering 9 (3), pp. 21–29. DOI: 10.1109/MCSE.2007.53. Pollock, R. (2007). Give Us the Data Raw, and Give it to Us Now. URL: http://blog.okfn.org/2007/11/07/give-usthe-data-raw-and-give-it-to-us-now (visited on 2016-07-03). RIBA (2013). RIBA Plan of Work 2013 Overview. Report. London, UK: RIBA. Rathore, M. M., Ahmad, A., Paul, A., and Rho, S. (2016). “Urban planning and building smart cities based on the Internet of Things using Big Data analytics”. In: Computer Networks 101, pp. 63–80. DOI: 10.1016/j.comnet.2015.12.023. Shermer, M. (2014). How the survivor bias distorts reality. URL: http://www.scientificamerican.com/article/how-thesurvivor-bias-distorts-reality/ (visited on 2016-06-15). Shumway, R. H. and Stoffer, D. S. (2006). Time series analysis and its applications: with R examples. Springer texts in statistics. New York, NY: Springer. Solihin, W., Eastman, C., and Lee, Y.-C. (2015). “Toward robust and quantifiable automated IFC quality validation”. In: Advanced Engineering Informatics 29 (3), pp. 739–756. DOI: 10.1016/j.aei.2015.07.006. Thabet, W., Lucas, J., and Johnston, S. (2016). “A Case Study for Improving BIM-FM Handover for a Large Educational Institution”. In: Proceedings of the Construction Research Congress (CRC). (Sept. 26–28, 2016). San Juan, Puerto Rico: American Society of Civil Engineers, pp. 2177–2186. DOI: 10.1061/9780784479827.217. Thorne, S. and Ball, D. (2005). “Exploring Human Factors in Spreadsheet Development”. In: Proceedings of The European Spreadsheet Risks Interest Group. (July 28, 2005). Greenwich, UK: EuSpRIG. U.S. Department of Energy (2002). International Performance Measurement & Verification Protocol. Concepts and Options for Determining Energy and Water Savings. U.S. Department of Energy. Wolfe, A. K., Malone, E. L., Heerwagen, J., and Dion, J. (2014). Behavioral Change and Building Performance: Strategies for Significant, Persistent, and Measurable Institutional Change. Report. Pacific Northwest National Laboratory. Yalcinkaya, M. and Singh, V. (2015). “Patterns and trends in Building Information Modeling (BIM) research: A Latent Semantic Analysis”. In: Automation in Construction 59, pp. 68–80. DOI: 10.1016/j.autcon.2015.07.012. Yarbrough, I., Sun, Q., Reeves, D. C., Hackman, K., Bennett, R., and Henshel, D. S. (2015). “Visualizing building energy demand for building peak energy analysis”. In: Energy and Buildings 91, pp. 10–15. DOI: 10.1016/j.enbuild.2014.11.052.
20