cells that resembled the gamma-cells illustrated by Boy- cott and Wfissle 1974. ... it has to be assumed that the portion of excitable cells has been under- rather ...
Exp Brain Res (1990) 83:178-189
Experimental BrainResearch 9 Springer-Verlag 1990
Visual response properties and afferents of nucleus of the optic tract in the ferret S. Kiauer, F. Sengpiel, and K.-P. Hoffmann Ruhr-Universitfit Bochum, Fakult/it fiir Biologie, Allgemeine Zoologie und Neurobiologie, ND 7, Postfach 10 21 48, D-4630 Bochum, Federal Republic of Germany Received April 3, 1990 / Accepted August 3, 1990
Summary. Basic properties of responses to visual stimulation with large moving random dot patterns were studied in ferret nucleus of the optic tract. Retinal input to NOT was assessed by orthodromic electrical stimulation of the optic chiasm and optic nerves. Presence of an input from visual cortex was tested by orthodromic electrical stimulation of ipsilateral area 17. All 51 NOT neurons studied displayed a non-habituating, clearly directionspecific response: discharge rate strongly increased with the stimulus pattern moving horizontally in ipsiversive direction (motion directed towards the recorded hemisphere) and decreased with contraversive stimulus motion. Most latencies to visual stimulation ranged from 80 to 100 ms. Velocity tuning was studied using stimulus velocities between 4 deg/s and 100 deg/s. Discharge rates were most effectively modulated at a stimulus velocity of 20 deg/s. A large portion of the cells studied (91%) could be binocularly activated, although for almost all neurons the contralateral eye was dominant. Through stimulation of the optic chiasm 46 out of 51 NOT neurons could be electrically activated with a latency of 5.42~:0.66 ms (mean 4-SD). For 15 fibers stimulated from both optic chiasm and contralateral optic nerve, conduction velocities between 2.5 and 8.9 m/s, with a mean of 5.1 m/s, were obtained. A major direct input from the ipsilateral retina was not found. Furthermore, 65% of all neurons could be activated through electrical stimulation of visual cortex with a mean latency of 3.7:t: 1.5 ms, indicating a strong cortical projection to ferret NOT. The functional relevance of response properties of ferret NOT neurons for horizontal optokinetic nystagmus is discussed. Parameters that could be related to formation of a corticopretectal projection in mammals are considered.
Key words: Nucleus of the optic t r a c t - Visual responses - Retinal afferents - Cortical afferents - Ferret Offprint requests to: S. Klauer (address see above)
Introduction The pretectal nucleus of the optic tract (NOT) and the dorsal terminal nucleus (DTN) of the accessory optic system (AOS) play a decisive role in the generation of the slow phase of horizontal optokinetic nystagmus (hOKN). This notion is supported mainly by the following results: On the one hand, electrical stimulation of the NOT/DTN elicited conjugate OKN with the slow phase directed to the stimulated hemisphere (rabbit: Collewijn 1975a; monkey: Schiff et al. 1988). On the other hand, hOKN could no longer be induced visually at all with bilateral NOT lesions (rabbit: Collewijn 1975b; monkey: Kato et al. 1986; Schiffet al. 1990; cat: Precht and Strata 1980). The role of this nucleus seems to be identical in all mammals, as substantiated by the results from receptive field analysis in a wide range of different orders like marsupials (opossum: Volchan et al. 1989), rodents (rat: Cazin et al. 1980a, b), lagomorpha (rabbit: Collewijn 1975a, b), carnivores (cat: Hoffmann and Schoppmann 1975, 1981) and monkeys (squirrel monkey, macaque: Hoffmann and Distler 1986, 1989). In all species studied, the basic response characteristics of NOT and DTN neurons were found to be the same: non-habituating direction-specific responses to large, slowly moving stimuli. Neurons in the left NOT were activated by leftward and inhibited by rightward movements, while those in the right NOT were activated by movements to the right and inhibited by movements to the left (Hoffmann 1981, for review see Simpson et al. 1988). As a consequence, temporo-nasal slow phases of OKN should be mediated through the NOT contralateral to the stimulated eye, whereas naso-temporal slow phases should be mediated through the ipsilateral eye (Precht and Strata 1980; Hoffmann 1981). The retinal input to NOT is almost exclusively contralateral (Hoffmann and Schoppmann 1981; Ballas et al. 1981). There is some evidence for NOT, DTN and the
179 other terminal nuclei o f the AOS, that the retinal input could be p r o v i d e d by O N - c e n t e r direction selective ganglion cells (Oyster et al. 1972; H o f f m a n n a n d Stone 1985; A m t h o r et al. 1989; D a n n a n d Buhl 1987), but further direct p r o o f is needed to confirm this a s s u m p t i o n for all mammals. In addition to the retinal input, the N O T o f frontaleyed animals (cat, m o n k e y ) also receives an input f r o m the visual cortex, as has been s h o w n anatomically (Graybiel and Berson 1980; M a r c o t t e and U p d y k e 1980) and electrophysiologically ( S c h o p p m a n n 1981, 1985; Hoffm a n n et al. 1987). Animals with lateral eyes (rat, rabbit) seem to lack this connection (Giolli and Guthrie 1971; Giolli et al. 1978). A l o n g with receiving cortical input, the NOT-cells o f cat and m o n k e y can be binocularly activated (Grasse and C y n a d e r 1984; H o f f m a n n and S c h o p p m a n n 1981; H o f f m a n n and Distler 1989), while those in the N O T o f rat and rabbit can only be activated t h r o u g h the retinal input f r o m the contralateral eye (Cazin et al. 1980a and b, Collewijn 1975a and b). Binocular input to N O T and, therefore, the accessibility o f b o t h N O T ' s for either eye allows the development o f a symmetric m o n o c u l a r h O K N , i.e. stimulus m o v e m e n t in b o t h horizontal directions elicits O K N a b o u t equal in strength ( H o f f m a n n 1983). In this study, we w a n t e d to determine whether the basic response characteristics o f the N O T in m a m m a l s can be confirmed in the ferret. W i t h the ferret, we have chosen as experimental animal a n o t h e r carnivore, but one with a less well developed area centralis and the eyes positioned m o r e laterally t h a n in the cat. O u r question was whether, as in the cat, i n f o r m a t i o n f r o m the ipsilateral eye nevertheless reaches the N O T / D T N and whether a cortical projection to the N O T / D T N as possible substrate for the source o f this i n f o r m a t i o n is present. To assess the electrophysiological features o f the retinal input to the ferret's N O T we applied electrical stimulation to the contralateral and ipsilateral optic nerves. To assess the latter question, we applied electrical stimulation to p r i m a r y visual cortex. O u r results show that the p r o p o r t i o n o f binocular cells and the p r o p o r t i o n o f cells receiving cortical input in the N O T o f the ferret are c o m p a r a b l e to these p r o p o r tions in the cat. I n c o m p a r i n g cat and ferret it appears that the degrees o f laterality o f the eyes a n d development o f an area centralis do n o t seem to be numerically related to the degrees o f binocularity a n d strength o f cortical input in the N O T .
Material and methods
Animals" Seven normal adult pigmented ferrets (Mustela putorius furo) of a weight between 450 and 1300 g were studied. All animals were bred at the Institut ffir Allgemeine Zoologie und Neurobiologie, Bochum.
Preparation For initial anaesthesia, a mixture of 40 mg/kg ketamine (Ketanest) and 0.6 mg/kg thiaminhydrochlorid (Rompun) were injected i.m. ;
tracheotomy was performed for intubation. During the whole experiment, animals were artificially ventilated with a 2:1 mixture of N20 and 02 maintaining anaesthesia. Paralysis was initiated by 0.5 mg alcuroniumchlorid (Alloferin) and maintained by subcutaneous infusion of 0.07 mg alcuroniumchlorid per h in Macrodex/saline solution. End tidal CO 2 value (3.2-4.2%) and peak respiratory pressure (< 20 hPas) were constantly controlled. Animals were placed in a stereotaxic apparatus on a feedback-controlled heating-pad that maintained body temperature at 38 ~ C. The corneae were kept in good optical condition by periodical cleansing with 2% NaCl-solution. For local anaesthesia during preparation, 5 mg bupivacainhydrochlorid were injected onto the fifth nerve and into the neck muscles. For each of the optic chiasm and optic nerve stimulating electrodes, the skull was trepanned at the respective positions: OX: 7-8 mm ant., ON: 14-15 mm ant., 1.5 mm lat. (Horseley-Clarke coordinates). The skull overlying visual cortex, superior colliculus and pretectum was removed by a large craniotomy extending from the interaural line to the occipital pole of the skull. To protect the brain surface and to prevent it from pulsation, it was covered by 3 % agar solution. After preparation had been finished a metal pin was cemented onto the forehead. The animal's head was rigidly fixed by the metal pin onto a head holder preserving the stereotaxic position, leaving the animal without any obstruction of its view and without painful pressure points. Eye and ear bars used for stereotaxic adjustment were then removed.
Recordin9 and electrical stimulation We used glass insulated tungsten microelectrodes (1.5-4 MR at 1 kHz) for extracellular recording and concentric steel electrodes for electrical stimulation. The optic nerves (ON) run about 7 mm inside the skull, which makes it easy to stimulate them intracranially. This enabled us to separate the ipsilateral and contralateral retinal input to NOT. Stimulation electrodes were aimed stereotaxically to the nerves. Only if clear responses to visual stimulation could be recorded from the electrode tips (to stimulation of the ipsilateral eyes for the ON electrodes and of both eyes for the OX electrode), were their positions accepted. The stimulating electrode in the visual cortex (VC) ipsilateral to the recorded NOT was placed inside the representation of the central visual field. To do so visual receptive fields of multiunit activity were mapped. At the correct location the tip of the stimulation electrode was advanced to a depth of about 1 mm beneath the cortical surface. Before recording, the dura was removed partially. The recording electrode was advanced vertically by means of a remote controlled manipulator. In order to localize the NOT, the most successful strategy was first to find the anterior portion of the superior colliculus (SC), where the receptive fields of the recorded units lie in the ipsilateral visual hemifield. Then electrode position was moved in steps of about 0.2 mm rostrally and laterally until the strong fiber activity of the brachium of the SC could be recorded. In successful penetrations, among the activity of the visual input fibers, the direction-specific response of NOT-cells could be clearly identified immediately after passing the surface of the midbrain. When a single, direction-specific NOT-cell was isolated, single pulses of up to 0.5 mA and a duration of 0.1 ms were administered through the stimulating electrodes. Responses were monitored on a digital storage oscilloscope screen. A neuron was considered as being responsive, if at least 3 of every 4 electrical shocks evoked an action potential. For stimulation of the retinofugal pathway, standard deviation of the latencies of the first response had to remain below 0.75 ms. As the successful stimulation from visual cortex strongly depends on an exactly correct stimulation position (Schoppmann 1981), a higher latency jitter ( < 1.0 ms) was allowed. Latencies were measured either directly from the oscilloscope screen or after the responses had been recorded on magnetic tape and plotted on an X-Y-plotter.
180
Visual stimulation As visual stimulus, a random dot pattern with dots varying in size between 1 and 3 deg visual angle was used covering 30 deg of the ipsilateral and 60 deg of the contralateral visual field. In two experiments gratings of different spatial frequencies (0.06-0.25 cycles/deg) were also tested. The luminance of the black dots and stripes, respectively, was 0.1 ed/m 2, while that of the white background was 0.3 cd/m 2 (contrast 0.5). All stimuli were projected onto a tangent screen in front of the animal (distance 57 cm and 114 cm, resp.). During the whole experiment, contrast and luminance of the visual stimulus was kept constant. The slide could be moved by two tow-lines working in perpendicular directions. Movement was produced by two galvanometers which were controlled by a variable phase function generator. To produce stimulus movements along a circular path, two sine wave signals of equal frequency and amplitude but 90 deg phase shift were used. Horizontal movements of different velocities were generated by a triangular signal of variable amplitude and frequency. Either eye could be occluded by a blackened half of a ping-pong ball, so that monocularly evoked responses could be analysed.
1. Classification of calculated OD values in ocular dominance (OD) classes. 1 : cells only activated by the contralateral eye, 2: cells strongly dominated by the contralateral eye but with a clear input from the ipsilateral eye, 3: cells with still stronger input from the contralateral eye, 4: cells with almost equal input from the two eyes, 5-7: like 3-1 but with the ipsilateral eye being dominant. OD-values were obtained by deviding the non-dominant eye's response by the dominant eye's. As response strength the difference between activity in preferred direction and null-direction is considered Table
OD class
0D v a l u e
dominant eye
0,0
contralat.
-
0,1
0,11-
0,33
0,34-
0,66
0,67-
1,0
0,67 - 1.0 0,34-
0,66
0,11 - 0,33 0,0
Data analys& Responses were conventionally amplified and passed through a window discriminator, standard pulses being fed through an interface into a compaq 286 computer for on-line peri-stimulus-timehistogram (psth) display and data storage. Data from stimulation by circularly moving patterns were Fourier-analysed to determine the preferred direction vectors (cf. W6rg6tter and Eysel 1987) and displayed in polar coordinates by a data analysis-program. Latency was taken into consideration to eliminate phase shift of the response. To compare direction-selectivity of different neurons, a direction selectivity index DS was calculated by normalizing the activity difference between preferred and null direction with respect to the activity in preferred direction (DS = (response in preferred direction - response in nulldirection)/response in preferred direction). The half maximum bandwidth for the modulated portion of the response (i.e., response strength minus spontaneous activity) was determined from polar diagrams and considered as the directional tuning width. An ocular dominance index OD was expressed as the ratio between the non-dominant eye's response strength and the dominant eye's response strength. As response strengths, the differences between firing rates during movements in preferred and null-direction were considered. Seven OD-classes were formed according to these OD values (see Table 1). Cells in class 1 (7) are only (or> 10 times more strongly) activated by the contralateral (ipsilateral) eye. Cells in class 2 (6) are strongly dominated (by a factor of 10 to 3) by the contralateral (ipsilateral) eye. Cells in class 3 (5) still have a clearly stronger input (factor 3 to 1.5) from the contralateral (ipsilateral) eye. Cells in class 4 show a balanced input with one eye being less than 1.5 times stronger than the other. To assess the question in which way the inputs from the two eyes are integrated in NOT cells we computed an index I = ~bin/ 5dom (Sbin and Morn being response strengths for stimulation of both eyes together or the dominant eye alone, respectively). An I value below 1 is interpreted as an inhibitory influence of the nondominant eye. If 1 < I < 1 + OD, the inputs are more or less summed up, while if I > 1 + OD, binocular stimulation leads to a stronger response than expected from the sum of the monocular responses, i.e. the influence of the non-dominant eye is facilitatory.
-
ipsilat. ,,
0,1
through the microelectrode. Animals were killed by an overdose of Nembutal and perfused intracardially with 4% Formalin. The mesodiencephalon was cut into 50 gm frontal sections and KliiverBarrera-stained for confirmation of recording sites.
Results
F o r this s t u d y 51 N O T - n e u r o n s were r e c o r d e d in 7 animals. T h e y were r e a d i l y identified b y their d i r e c t i o n specific r e s p o n s e to a m o v i n g r a n d o m d o t p a t t e r n . I n each p e n e t r a t i o n r e a c h i n g the a r e a o f the N O T (which c o u l d be c o n f i r m e d b y s t r o n g d i r e c t i o n selective b a c k g r o u n d activity) o n l y u p to five o r six cells c o u l d be isolated, p r o b a b l y due to the s p a r s e d e n s i t y o f cell b o d i e s in this nucleus (this is also c o n f i r m e d b y the h i s t o l o g i c a l a p p e a r a n c e o f the N O T - n e u r o n s r e t r o g r a d e l y labelled f r o m the i n f e r i o r olive, o w n u n p u b l i s h e d results).
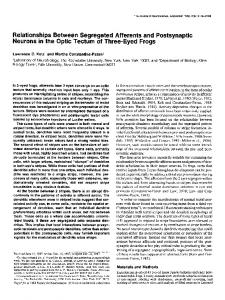
Localization of the NOT I n 5 o f the a n i m a l s , the last N O T - r e c o r d i n g site was m a r k e d b y electrolytic lesions. I n all cases, lesions were f o u n d to lie in o r b e n e a t h the b r a c h i u m o f the SC (see Fig. 1). A s in o t h e r m a m m a l s , the N O T o f the ferret seems to be a b a n d o f cells s t r e t c h i n g a l o n g the r o s t r o l a t e r a l b o r d e r o f the SC. D e s p i t e c o n s i d e r a b l e differences b e t w e e n the a n i m a l s e x a m i n e d , m o s t o f the N O T - u n i t s were f o u n d b e t w e e n 1.5 m m a n d 2.5 m m post. to the i n t e r a u r a l line a n d 2.5 to 3.0 m m lat. to the midline.
Responses to visual stimulation Histology At the end of each experiment, a microlesion was placed at the last NOT recording site by passing an anodic current of 2 gA for 5 min
T h e s p o n t a n e o u s firing rate w i t h the p a t t e r n s t a n d i n g still was m e a s u r e d for 32 cells. M e a n s p o n t a n e o u s activity was f o u n d to be 10.3 • 8.7 spikes/s.
181
SC
lo-
DTN 0
5-
Z
I
0
20
40
60
80
100 120 140 160 180 > 180
Latency (ms) Fig. 3. Distribution of latencies to visual stimulation (in ms) obtained from 30 neurons in the ferret NOT (ordinate: number of cells) Fig. 1. Drawings of frontal sections through the pretectal region of the ferret brain. The recording sites of direction specific cells within the NOT marked by microlesions are shown by black dots. Sections A to E were taken from five different animals. A q = aquaeduct, SC = colliculus superior, d L G N = dorsal lateral geniculate nucleus, D T N = dorsal terminal nucleus
NOT cells were characterized by displaying a nonhabituating, clearly direction-specific increase in discharge rate for ipsiversive motion of the random dot pattern (the pattern had to move towards the recorded hemisphere) and a more or less pronounced decrease in the opposite, contraversive direction. Many cells showed a transient component in their response pattern: the firing rate was strongly increased after changing pattern motion from null- to preferred direction and afterwards soon decreased to a plateau-level. Sometimes, a transient component could also be seen in the inhibitory response at the onset of too;cement in nulldirection (Fig. 2). In all cases, maximal activation was achieved when the stimulated area included the central visual field.
Latencies of the excitatory visual responses in 30 cells (determined as time until firing rate reaches 50% of the steady state firing rate in the preferred direction) ranged between 51 and 221 ms, with a median of 96 ms, and a mean latency of 115 :k 48 ms. The latency distribution is displayed in Fig. 3.
Direction selectivity Of 29 cells, the response to the random dot pattern moving along a circular path was recorded and analysed by the Fourier-analysis programme. Lower than optimal stimulus speeds allowing long bin widths in the psths were used to minimise response shifts due to latency. The resulting vectors for preferred directions are plotted in Fig. 4. Figure 5A and B each show three representative examples of responses of individual neurons from the left (A) and right (B) NOT. To get an impression of the direction-specific response of the whole NOT-population
4O
30
Fig. 2. Peri-stimulus time histogram of the response of an NOT unit to a horizontally moving random dot pattern. Stimulus velocity was 20 deg/s. In each sweep the pattern was first moved ipsiversively (duration marked by the black bar), then contraversively. Both the response to ipsiversive and to contraversive motion show a transient component. Abscissa: time in s; ordinate: discharge rate (imp/s)
20
10
lOs
182 A
9O
g
9o
I !
. . . . . . . . . . . .
. . . . . . . . . .
0
I
Fig. 4A, B. Vectors of preferred directions of NOT neurons recorded in the left (A) and right (B) hemisphere, respectively. The preferred directions were calculated by means of Fourier analysis (see Methods). The vectors are shown equal in length, irrespective of differences in firing rates between the examined cells
on either side, the relative response strengths (normalized to each cell's maximal activity) were averaged and plotted in polar diagrams (Fig. 5C and D). The resulting vectors for preferred directions indicate that in both NOTs nearly horizontal movements directed to the recorded hemisphere are preferred. The difference between the two vectors is 178 deg, thus, preferred directions seem to be exactly opposite to each other. The direction specificity of the cells was assessed by the direction-selectivity index DS (see Methods). DSvalues ranged from 0.29 to 1.57 with a mean of 0.75 + 0.33. Thus, on average the response in the preferred direction was four times as high as in the null direction. We only determined the bandwidth of the directional tuning for the population response. It was determined as the range of directions for which response amplitude exceeded half of the difference between spontaneous and maximal activity. This tuning widths of the cumulated population responses shown in Fig. 5C and D were 150 deg.
90
0
1 0 0 I/s
0
!
~
43 I/s
1
0
0
Velocity tuning In 31 cells quantitative measurements could be completed for the full range of stimulus velocities (4, 10, 20, 40, 100 deg/s). Fig. 6 shows the frequency distribution of the preferred velocities. Clearly, most of the cells (17) preferred stimulus velocities of 20 deg/s. In Fig. 7, the averaged velocity-tuning of 31 cells is displayed for the response in preferred direction, nulldirection and the difference between the two. All three curves show a clear maximum or minimum at a velocity of 20 deg/s. To answer the question, whether NOT neurons respond to the temporal frequency of changing contrast (contrast frequency) rather than to angular velocity of a
72 I/s
~
!
9 6 I/s
1
Fig. 5. A, B Three representative examples of responses of individual neurons from the left NOT (A) and the right NOT (B) are shown in polar coordinates. In order to easily discriminate the three individual curves, we chose examples of neurons with different firing rates which were scaled to the maximum of the neuron with the highest firing rate. C, D display averaged directional tuning curves of 14 neurons in the left NOT (C) and 15 neurons in the right NOT (D); 0 deg = motion to the right, 90 deg = upward motion. Before averaging, individual tuning curves had been normalized with respect to the neuron's maximal response. Thick bars indicate mean preferred directions, the outer circles mean maximal response. Standard deviations are indicated by the outer, thin bars
183
20-
o
10-
,D
z
4 10 20 40 100 P r e f e r r e d velocity (deg/s) Fig. 6. Distribution of preferred velocities of 31 NOT cells; abscissa: stimulus velocities tested (in deg/s), ordinate: number of cells showing their maximal activity in preferred direction at the given stimulus velocity
given moving pattern, in two experiments visual stimulation was performed using gratings of different spatial frequencies (0106, 0.13 and 0.25 cycles/deg). By moving the patterns at different speeds (2, 4, 8, 16, 32 deg/s) contrast frequencies of 0.25, 0.5, 1, 2 and 4 cycles/s were produced. The results obtained by these measurements are summarized in Table 2. Figure 8A shows the mean velocity tuning of 18 cells measured with the three different gratings. The cells preferred speeds of 8 deg/s irrespective of the grating used. This seems at first in contrast to the preferred velocity of 20 deg/s using the random dot pattern. However, this shift could well be caused by the difference in stimulus efficacy. In Fig. 8B, the dependency of response strength on contrast frequency is displayed for the three gratings. No common preference for one contrast frequency could be observed, suggesting that velocity preference does not critically depend on temporal frequency of the stimulus. In a Chi2-test we compared the similarity of the 3 response
10(9-
9
50-
+
PD
z~
PD-ND
o
ND
spontaneous 0a
4' 10 ' Stimulus velocity (deg/s)
A
40 '
160
Fig. 7. Averaged velocity tuning curves obtained from normalized data of 31 NOT cells. Abscissa: stimulus velocity (deg/s); ordinate: mean response strength (% of maximal response)9 The curves marked by + and o represent the population's response with stimuli moving in preferred (PD) and null-direction (ND), respectively; vertical bars indicate standard deviation. The curve marked by triangles shows the differences between activities for preferred and null-direction (PD-ND). The dashed line shows mean spontaneous activity
B
A
A 0.06 c y c / d e g
O
O 0.13 c y c / d e g
~9
o
80
80-
9
N
7O
70-
60
60-
50-
50-
deg
E o
40
,
40
,
0.125
Stimulus
velocity
(deg/s)
Fig. 8. A Relation between stimulus velocity (abscissa) and normalized response strength (ordinate). B Relation between contrast frequency (abscissa) and normalized response strength (ordinate). All data in A, B were obtained from the same 18 NOT cells. Stimuli
Contrast
0 j.5
1
frequency
2
4
(cyc/s)
were gratings of different spatial frequencies moved at different velocities. The tuning curves represent activity differences between stimulus motion in preferred and null-direction
184
Table 2. Mean relative response strengths (in % of the maximal firing rate) and their standard deviations obtained from 18 NOT neurons for different stimulus velocities and different spatial frequencies of the stimulus pattern
~ v e l ulus I oe.
2
spatial~
] deg/s frequency "NI 0.25 cyc/deg
4
8
16
deg/s
deg/s
deg/s
44 +-
58
26
\\
+-
0.13 eyc/deg
62 27
\\
66
0.06
+-
contrast frequency (cyc/s) :
47 24
\\
68
65
eye/deg
+-
\
+-
\ 0.25
18
+-
\
\
63
66
78
25
32 deg/s
22
\
+-
\ 0.5
43
21
\
+-
\
18
\ 2
1
curves for each neuron when plotted either against stimulus velocity or contrast frequency. In 14 out of the 18 neurons the response curves plotted against stimulus velocity formed a more homogeneous population than when plotted against contrast frequency. In fact the 3 mean velocity tuning curves plotted in Fig. 8A are identical to each other with a probability higher than 80% whereas the 3 mean contrast frequency tuning curves in Fig. 8B are different from each other with a probability greater than 98%. Therefore, it can be stated that the activity of NOT cells is significantly more related to actual stimulus velocity than to temporal frequency of contrast irrespective of the spatial frequency of the stimulus.
4
through the contralateral as well as through the ipsilateral eye. However, in all but 3 cells the contralateral eye was the dominant one.
Binocular interaction
To assess the question, in which way the inputs from the two eyes are integrated by NOT cells, we computed the indices OD and I, as described in methods. For 12 out of 46 cells, I was smaller than 1, suggesting an inhibitory interaction, for 20 cells I was above 1 but remained below 1 + OD, indicating summation of the excitation from the two eyes, and for 16 cells I exceeded 1 + OD, indicating a facilitatory interaction (see Fig. 10). Mean I of
Ocular dominance
The contribution of either eye to the direction-specific response of 46 NOT-neurons was tested for movements of 10 deg/s. This velocity (and not the preferred velocity of 20 deg/s ) was chosen in order to allow measurements of binocular summation before the response of a given neuron saturates, which was especially important for those cells that showed good responses when stimulated through either eye alone. Mostly the ocular dominance found for individual cells was independent from stimulus velocity. By aid of the computed ocular dominance value (OD) neurons were classified into seven ocular dominance groups, cells being activated only through the contralateral eye in class 1, cells activated only through the ipsilateral eye in class 7, and cells with almost equal inputs from the two eyes in class 4 (see Table 1). The frequencies of cells belonging to these OD-classes are shown in Fig. 9. The great majority of all cells (91%) belonged to OD-classes 2-4, i.e. could be activated
20 o o
10 z
1
2
3 OD
4
5
6
7
classes
Fig. 9. Distribution of ocular dominance (OD) types of ferret NOT cells; abscissa: OD classes (as characterized in Methods and Table I), ordinate: number of cells assigned to OD-groups 1 to 7
185
20 0
,.Q
10
Z
Inh.
Sum.
Fac.
Fig. 10. Binocular interactions in activation of ferret NOT neurons. According to their I and OD values cells were assigned to three groups (Inh. = inhibitory interaction; Sum. = summation of the two eyes' inputs; Fac. = facilitatory influence between the two eyes; for further details see Methods)
A (;i i'
0
10 ID
5
Z I
I
I
I
1
I
I
I
I
I
1
2
3
4
5
6
7
8
9
10
Latency a f t e r OX-stimulation (ms)
13
O
15
o 10
i2 m s
Fig. 12. Representative example of the response of a direction selective cell in the ferret's NOT to electrical stimulation of the visual
cortex (VC), Abscissa: time in ms; ordinate: extracellularly recorded potential
5-
Z I
I
l
I
I
I
i
t
I
I
1
2
3
4
5
6
7
8
9
10
Latency a f t e r O N - s t i m u l a t i o n (ms) Fig. 11A, B. Distribution of latencies after stimulation of the optic chiasma (A) and the optic nerves (B), respectively. Hatching indicates cells which could be activated by stimulation of the contralateral optic nerve; black box shows the one neuron being activated by stimulation of either nerve
1.32:5 0.46 and mean OD of 0.38 i 0.21 were obtained. As I does not differ significantly from 1 + OD, the NOT cell population as a whole seems to simply add the inputs from both retinae. No systematic relationship between binocular interaction and any other parameter determined, such as ocular dominance, directional or velocity tuning or cortical excitability, could be found.
Responses to electrical stimulation Optic chiasm / Optic nerves. Nearly all neurons tested could be driven by orthodromic stimulation of the retinal ganglion cell fibers in the optic chiasm, indicating a direct retinal input. For 45 NOT-cells the OX-latencies measured fell within the range of 4.3-7.0 ms, the mean being 5.42 ms+0.66 ms s.d. (see Fig. 11). For 6 neurons the response did not meet the criteria given in Methods. The conduction velocity (calculated from the latency difference and conduction distance between OX- and ONstimulation sites) of 15 fibers that could be stimulated at OX and ON was 2.5-8.9 m/s, with a mean of 5.1 m/s. All neurons were activated through contralateral optic nerve stimulation. Only one neuron could be electrically activated by stimulation of the ipsilateral ON, proving that
186
the surroundings' motion and in mediating the optokinetic reflex. However, we are aware of the fact that our experimental approach has a clear bias for typically responding cells and that no assertions can be made about cells that are not direction-selective, but are located in the area of NOT/DTN.
~8 0
~6 4
Z
2
1
2
B
4
5
6
i
I
7
8
9
10
Responses to visual stimulation and their role for optokinetic nystagmus
Latency after VC- stimulation (ms)
Fig. 13. Distribution of latencies after stimulation of the visual cortex obtained from 33 NOT cells
the direct retinal input to the NOT of the ferret is almost exclusively of contralateral retinal origin. From the conduction velocities and the distance between OX and NOT we calculated the time that should be necessary for conduction of action potentials from the chiasm to NOT. Comparing these values to the OXlatencies actually measured, a hypothetical synaptic delay in NOT could be obtained. If the delay is less than 1 ms, monosynaptic activation can be assumed, otherwise polysynaptic transmission cannot be excluded although slowing down of the fibers along the path between OX and NOT is another likely possibility. The distance between OX and NOT was measured in the perfused brain and was found to be at least 15 mm. A range of synaptic delays between 6.3 and - 0.4 ms was calculated, with a mean of 2.3 4- 1.7 ms and a median of 2.0 ms. Only three out of the 15 cells taken into account had delays less than 1 ms and thus seem to be monosynaptically activated.
Visual cortex. Through cortical stimulation, in 33 of the 51 cells analysed (= 65 %) multiple spike discharges could be elicited. Whether a cell could be activated by this stimulation depended strongly on the position of the stimulating electrode, so in fact the proportion of cortexdriven cells might have been even higher. In many cases, the response pattern of cortical-driven NOT-cells consisted of more than one action potential (Fig. 12). The latency distribution after cortical stimulation given in Fig. 13 (mean latency 3.7 4- 1.5 ms) has a slightly bimodal appearance. In a Chi 2 test, however, it does not differ significantly from a uniform distribution. Furthermore, we did not find any significant difference between short latency cells compared to long latency cells with respect to their direction-selectivity, ocular dominance, or preferred velocity. Discussion
Selection of analysed cells We identified NOT/DTN-neurons not only by their anatomical position, but mainly by their direction-specific response. This strategy was motivated by our interest in the functional role of NOT/DTN in the detection of
Many of the cells showed a pronounced transient response component at the onset of stimulus motion in the preferred direction. Neither for anaesthetized cat (Hoffmann and Schoppmann 1981) nor monkey (Hoffmann and Distler 1989) has such a response pattern been reported, although Maekawa et al. (1984) found in the rabbit, that 20% of the cells had a phasic characteristic. The direction-specificity of NOT-neurons known from other mammals, could be confirmed in the ferret, suggesting that also in this animal the basic prerequisites for gaze stabilization are present in the NOT. Horizontal movements cause decrease of activity in one and increase in the other NOT, the activity difference between the two NOTs producing a signal for the control of slow phase eye velocity. Direction specificity of the ferret's NOT was weaker than that found in the cat (DS index for the ferret being 0.75 and 0.85 for the cat (Hoffmann and Schoppmann 1981), respectively). Also, the tuning width of direction selectivity was much broader than that of the cat (150 deg in the ferret and 104 deg in the cat, Hoffmann and Schoppmann 1981). Whether this is a general characteristic of the ferret NOT or whether these parameters depend on stimulus conditions remains to be shown. Most of the latencies after the onset of pattern motion (in preferred direction) were between 80 and 100 ms (latency was defined as the time after which impulse rate had risen to half of the steady state activity). For both rabbit (60-80 ms, Maekawa et al. 1984) and monkey (50-80 ms, Hoffmann and Distler 1989) smaller values were obtained. Maioli and Precht (1984) reported that in cat the latency between visual stimulus onset and begin of OKN is 100 ms, so that the latency of the response onset in NOT/DTN must be even shorter. Thus the ferret seems to show the longest latency among the above mentioned animals. In comparison to the cat, an outstanding feature of the ferrets NOT is the tuning to higher stimulus velocities. Ferret NOT neurons are most strongly activated by movements of 20 deg/s, while those in the cat prefer velocities of 5 to 10 deg/s (Hoffmann and Schoppmann 1981). Similar differences in velocity preference have been observed with respect to performance of hOKN: Highest gains in closed-loop situation were reached at 40 deg/s for the ferret (Hein et al. 1990) and at 5 deg/s for the cat (Markner and Hoffmann 1985). As already suggested by Hein et al. (1990), the tuning to higher velocities could meet special reqirements of the visual and oculomotor system in the ferret. Namely, in exploratory and hunting behavior, the ferret displays many small,
187 rapid head movements in different directions. In contrast, the head position of a cat approaching a prey or exploring an unknown environment is held very much constant. The proportion of binocularly excitable cells in the ferret is very high (91%), probably equal to that in the cat (figures about the binocular portion of cat's NOT/ DTN range from 80% for the NOT, according to Hoffmann and Distler 1989, to 93% for the DTN, according to Grasse and Cynadcr 1986). As in the cat, the influence of the contralateral eye is dominant in most binocular cells. This is in contrast to the monkey, where both eyes seem to have an equally strong influence on each NOT (Hoffmann and Distler 1989). Assuming that with monocular stimulation, activation of the contralateral NOT mediates nasally directed OKN and that of the ipsilateral NOT temporal OKN, this difference in ocular dominance is probably the structural substrate explaining symmetrical monocular O K N in monkey (K6rner and Schiller 1972; Pasik and Pasik 1964) and slightly asymmetrical nystagmus in cat and ferret (Markner and Hoffmann 1985; Hein et al. 1990).
Results of electrical stimulation Retinal afferents. The orthodromic stimulation of the retinofugal pathway revealed the existence of a direct retinal input to ferret NOT, originating in the contralateral eye. A major excitatory input from the ipsilateral eye could not be found which is in accordance to results out of the cat, where a ratio of 10:1 between contralateral and ipsilateral retinofugal axons to NOT had been found (Ballas et al. 1981). From the mean conduction velocity of 5.1 m/s for the ferret we concluded that the retino-pretectal fibers are of the same type as the W-cells in cats, according to the classification by Stone and Hoffmann 1972. The retinal input to cat NOT has been shown to be of this cell-type (Hoffmann and Schoppmann 1981 ; Hoffmann and Stone 1985). The existence of a W-like ganglion cell type also in the ferret is substantiated by the following results: 1. Vitek et al. 1985 demonstrated the existence of different morphological classes, including "unclassified" cells that resembled the gamma-cells illustrated by Boycott and Wfissle 1974. The latter have been identified with W-cells in physiological terms. 2. Analysing receptive field properties and OX-latencies Sur et al. (1988) proved the existence not only of Xand Y-cells, but also of W-cells in the ferret dLGN. According to Vitek et al. (1985), the axons of the ganglion cells in the ferret are finer than those of the corresponding cells in the cat. The conduction velocities in the ferret's optic nerve should therefore remain below those in the cat. This assumption has been proved for Xand Y-cells by Baker and Stryker (1990). They found axonal conduction velocities of 13-16 m/s for X-cells (in contrast to 20-30 m/s in the cat) and of 20M0 m/s for Y-cells (in the cat: 35-50 m/s). In this study, we found that conduction velocity in the retino-pretectal pathway,
consisting presumably of W-cells, is also lower than in the cat (5.1 m/s in the ferret vs. 6.7 m/s in the cat). By extrapolating the conduction times into the NOT we wanted to assess the question wether by OX-stimulation a mono- or a polysynaptic pathway was stimulated. Only three of the 15 cells tested had synaptic delays of less than 1 ms and thus could be considered as being monosynaptically activated. It has to be born in mind, however, that for our calculation we had to assume that conduction velocities remain constant between the optic nerve and NOT. Baker and Stryker (1990) have shown that this is not the case in ferret: conduction velocities are higher in the optic tract as compared to those in the optic nerve. By this the negative synaptic delays we obtained can be explained. Another example of variable conduction velocities along a neuronal pathway, this time showing a slowing down of conduction velocity of retinofugal X-fibers between thalamus and midbrain, has been reported by Hoffmann and Stone (1985) for the cat. Thus, synaptic delays extrapolated from conduction velocities measured for only part of the axonal path cannot be taken as a conclusive parameter proving mono- or polysynaptic transmission.
Cortical afferents. Our results suggest a strong projection from visual cortex to the NOT/DTN of the ferret (61% of all cells could be orthodromically activated from VC). The success of the electrical stimulation depended crucially on the correct position of the stimulating electrode: only if the receptive fields in the stimulated cortex area overlapped with those of the NOT-cells a response could be elicited (the same phenomenon had already been observed by Schoppmann 1981 in a comparable study in the cat). Because the receptive fields of presumably most of the NOT cells include the central part of the visual field, the optimal stimulation site was in the representation of the fixation point. The anatomical location of this point in area 17 has recently been described by Law et al. 1988. Because (as in cat) the fixation point in area 17 is closely neighboured by that in area 18, it cannot be excluded that stimulation current spread into area 18 as well. Therefore, one cannot stipulate that the projection from VC to NOT originates only from area 17 and not also from area 18. For the cat, Schoppmann (1981) has shown an equally strong projection from area 17 as from area 18 to the NOT. It is probable that the same holds also for the ferret, although up to now no anatomical or physiological data exist about visual cortical inputs to ferret NOT. Given the strong dependence of orthodromic activation of NOT-cells on the correct position of the stimulating electrodes in cortex and the fact that in some of our cases the stimulation point might not have been optimal, it has to be assumed that the portion of excitable cells has been under- rather than overestimated. Whether all NOT-cells of the ferret actually receive an input of primary visual cortex, as seems to be the case for the cat and monkey (Hoffmann 1983; Hoffmann et al. 1987), remains to be shown. Besides a monosynaptic connection between VC and pretectum also polysynaptic pathways from primary vi-
188 sual cortex via secondary or tertiary cortical areas to N O T could have been activated under our stimulating conditions. That such connections (from area 21a and b, PLLS, PMLS, AMLS) exist with the N O T and D T N of the cat has been shown anatomically by Marcotte and Updyke (1982) and Berson and Graybiel (1980). The recent finding that most of these areas increase their metabolic activity during O K N (revealed by the 2 - D G technique, Herdman et al. 1989) suggest a functional connection between these areas and the optokinetic neural reflex arc. If in the ferret as in the cat areas such as PLLS, PMLS, etc. project to N O T , then it is even less surprising that a single stimulating electrode in ferret primary visual cortex was unable to activate all N O T neurons. Previous results indicate that in all mammals studied so far, a cortical input to N O T coincides with binocularity of N O T neurons on the one hand and presence of temporal h O K N on the other hand. Why do some animals (such as cat, monkey, and as shown by this study, also the ferret) have developed a cortico-pretectal projection, while others (such as rat and rabbit) have not? Several factors have been regarded to favour the development of this projection, as there are the presence of a fovea or area centralis, a small divergence angle of the eyes (frontal eyes) and, closely connected with this, size of the monocular and binocular visual fields, respectively. The ferret neither has a fovea nor an area centralis comparable to monkey or cat, so this factor seems not to be a necessary condition for the cortical projection. Hein et al. (1990) proposed that in animals with a monocular visual field size below a threshold value lying between 120 deg (rat) and 44 deg (cat) a cortical projection should be present. Taking our results into account, this range can now been narrowed to the interval between 120 deg (rat) and 90 deg (ferret). However, the explanatory value of a rather descriptive parameter like monocular visual field size seems not to be too satisfactory. The following considerations try to explore another hypothesis, based on a somewhat more functional explanation for the development of a binocular cortical projection to NOT. If one assumes that only the binocular part of the visual cortex projects to N O T and consolidation of terminals of binocular cortical cells depends on receptive field overlap with NOT-cells, the formation of this projection is only possible if the majority of N O T cell receptive fields are located in the binocular portion of the visual field. This has been shown to be the case both for cat and monkey (Hoffmann and Distler 1989; Hoffmann and Schoppmann 1981), where in the N O T the frontal portion of the visual field is heavily represented. Most receptive fields include the area centralis or fovea. Although no quantitative measurements of receptive field size and position have been accomplished for the ferret, clearly the best responses were found with stimulation of the central portion of the visual field in front of the animal. The binocular visual field of the ferret is considerably large (subtending roughly 30 deg into each hemifield) and seems in any case to make up a large part of the visual field represented in NOT.
In contrast, the receptive fields of rabbit N O T cells are located in a horizontal band corresponding to the visual streak of the retina (Collewijn 1975b). Most if not all of this area falls into the monocular visual field. Regrettably, no data about receptive field locations of rat N O T units have been published yet. If the above mentioned hypothesis is correct, they should be located mainly outside of the binocular visual field, too. We would therefore expect a cortical input to N O T only where binocular information from the visual field relevant for eliciting O K N is available. The binocular information can then be used by the N O T to confirm whether image motion on both retinae is the same, indicating consistent rotation during selfmotion of the animal. Only under this circumstance can and should the retinal image slip on both retinae be compensated by the optokinetic reflex with appropriate conjugate eye movements.
Acknowledgements. The software for evaluation of directional selectivity of the recorded units was kindly provided by I. Bettges. This study was partly supported by grants DFG Ho 450 and MUCOM to K.-P. Hoffmann. During this work S. Klauer was supported by the Studienstiftung des deutschen Volkes.
References Amthor FR, Takahashi ES, Oyster CW (1989) Morphologies of rabbit retinal ganglion cells with complex receptive fields. J Comp Neurol 280:97-121 Baker GE, Stryker MP (1990) Retinofugal fibres change conduction velocity and diameter between the optic nerve and tract in ferret. Nature 344:342-345 Ballas I, Hoffmann K-P, Wagner HJ (1981) Retinal projection to the nucleus of the optic tract in the cat as revealed by anterograde transport of horseradish peroxidase. Neurosci Lett 26 : 197-202 Berson DM, Graybiel AM (1980) Some cortical and subcortical fiber projections to the accessory optic nuclei in the cat. Neuroscience 5:2203-2217 Boycott BB, WfissleH (1974) The morphological types of ganglion cells of the domestic cat's retina. J Physiol (Lond) 240:3974 19 Cazin L, Precht W, Lannou J (1980a) Pathways mediating optokinetic responses of vestibular neurons in the rat. Pflfigers Arch 384:19-29 Cazin L, Precht W, Lannou J (1980b) Firing characteristics of neurons mediating optokinetic responses to rat's vestibular nucleus. Pfliigers Arch 384:221-230 Collewijn H (1975a) Oculomotor areas in the rabbit's midbrain and pretectum. J Neurobiol 6:3-22 Cotlewijn H (1975b) Direction-selective units in the rabbit's nucleus of the optic tract. Brain Res 100:489-508 Dann JF, Buhl EH (1987) Retinal ganglion cells projecting to the accessory optic system in the rat. J Comp Neurol 262:141-158 Giolli RA, Guthrie MD (1971) Organization of subcortical projections of visual areas I and I[ in the rabbit: an experimental degeneration study. J Comp Neurol 142:351-376 Giolli RA, Towns LC, Takahashi TT, Karamanlidis AN, Williams DD (1978) An autoradiographic study of the projections of the visual cortical area I to the thalamus, pretectum and superior colliculus of the rabbit. J Comp Neurol 180:743-752 Grasse KL, Cynader MS (1984) Electrophysiology of lateral and dorsal terminal nuclei of the cat accessory optic system in the cat. J Neurophysiol 51:276-293 Grasse KL, Cynader MS (1986) Response properties of single units in the accessory optic system of the dark-reared cat. Dev Brain Res 27:199-210
189 Graybiel AM, Berson D (1980) Autoradiographic evidence for a projection from the pretectal nucleus of the optic tract to the dorsal lateral geniculate complex in the cat. Brain Res 195:1-12 Hein A, Courjon JH, Flandrin JM, Arzi M (1990) Optokinetic nystagmus in the ferret: including selected comparisons with the cat. Exp Brain Res 79:623-632 Herdman SJ, Tusa RJ, Smith CB (1989) Cortical areas involved in horizontal optokinetic nystagmus in cats: metabolic activity. J Neurosci 9:1150-1162 Hoffmann K-P, Schoppmann A (1975) Retinal input to direction selective cells in the nucleus tractus opticus of the eat. Brain Res 99 : 359-366 Hoffmann K-P (1981) Neuronal responses related to optokinetic nystagmus in the cat's nucleus of the optic tract. In: Fuchs A, Becker W (eds) Progress in oculomotor research. Elsevier, Amsterdam, pp 443-454 Hoffmann K-P, Schoppmann A (1981) A quantitative analysis of the direction-specific response of neurons in the cat's nucleus of the optic tract. Exp Brain Res 42:146-157 Hoffmann K-P (1983) Control of the optokinetic reflex by the nucleus of the optic tract in the cat. In: Hein A, Jeannerod M (eds) Spatially oriented behaviour. Springer, Berlin Heidelberg New York, pp 135-153 Hoffmann K-P, Stone J (1985) Retinal input to the nucleus of the optic tract of the cat assessed by antidromic activation of ganglion cells. Exp Brain Res 59:395-403 Hoffmann K-P, Distler C (1986) The role of direction selective cells in the nucleus of the optic tract of cat and monkey during optokinetic nystagmus. Biosci 57:261-266 Hoffmann K-P, Erickson R, Distler C (1987) Retinal and cortical projections to the nucleus of the optic tract and dorsal terminal nucleus in macaque monkeys. Soc Neurosci Abstr 13:1436 Hoffmann K-P, Distler C (1989) Development of receptive field properties in the nucleus of the optic tract of the cat. Soc Neurosci Abstr 477.9 Hoffmann K-P, Distler C (1989) Quantitative analysis of visual receptive fields of neurons in the nucleus of the optic tract and the dorsal terminal nucleus of the accessory optic tract in macaque monkeys. J Neurophysiol 62 : 416-428 Kato I, Harada K, Hasegawa T, Ikarashi T (1986) Role of the nucleus of the optic tract in monkey in relation to optokinetic nystagmus. Brain Res 364:12-22 K6rner E, Schiller P (1972) The optokinetic response under open and closed loop conditions in the monkey. Exp Brain Res 14:318-330 Law MI, Zahs K, Stryker MP (1988) Organization of primary visual cortex (area 17) in the ferret. J Comp Neuro1278 : 157-180 Maekawa K, Takeda T, Kimura M (1984) Responses of the nucleus of the optic tract neurons projecting to the nucleus reticularis
tegmenti pontis upon optokinetic stimulation in the rabbit. Neurosci Res 2:1-25 Maioli C, Preeht W (1984) The horizontal optokinetic nystagmus in the cat. Exp Brain Res 55:494-506 Marcotte RR, Updyke BV (1982) Cortical visual areas of the cat project differentially onto the nuclei of the accessory optic system. Brain Res 242: 205-217 Markner C, Hoffmann K-P (1985) Variability in the effects of monocular deprivation on the optokinetic reflex of the nondeprived eye in the cat. Exp Brain Res 61:117-127 Oyster CW, Takahashi E, Collewijn H (1972) Direction selective retinal ganglion cells and optokinetic nystagmus in the rabbit. Vision Res 12:183-193 Pasik T, Pasik P (1964) Optokinetic nystagmus: an unlearned response altered by section of chiasma and corpus catlosum in monkey. Nature (Lond) 103:609-611 Precht W, Strata P (1980) On the pathway mediating optokinetic responses in vestibular nuclear neurons. Neuroscience 5: 777-787 Schiff D, Cohen B, Raphan T (1988) Nystagmus induced by stimulation of the nucleus of the optic tract in the monkey. Exp Brain Res 70:1-14 Schiff D, Cohen B, Biittner-Ennever J, Matsuo V (1990) Effects of lesions of the nucleus of the optic tract on optokinetic nystagmus and afternystagmus in the monkey. Exp Brain Res 79: 225-239 Schoppmann A (1981) Projections from area 17 and 18 of the visual cortex to the nucleus of the optic tract. Brain Res 223 : 1-17 Simpson JI, Giolli RA, Blanks RHI (1988) The pretectal nuclear complex and the accessory optic system. In: Bfittner-Ennever (ed) Neuroanatomy of the oculomotor system. Elsevier, Amsterdam, pp 335-364 Stone J, Hoffmann K-P (1972) Very slow-conducting ganglion cells in the cat's retina: a major new functional type? Brain Res 43:610-616 Sur M, Garraghty PE, Roe AW (1988) Experimentally induced visual projections into auditory thalamus and cortex. Science 242:143%1441 Volchan E, Rocha-Miranda CE, Pianco-Diniz CW, Zinsmeisser B, Bernardes RF, Franca JG (1989) Visual response properties of pretectal units in the nucleus of the optic tract of the opossum. Exp Brain Res 78:380-386 Vitek D J, Schall JD, Leventhal AG (1985) Morphology, central projections and dendritic field orientation of retinal ganglion cells in the ferret. J Comp Neurol 241 : 1-11 W6rg6tter F, Eysel UT (1987) Quantitative determination of orientational and directional components in the response of visual cortical cells to moving stimuli. Biol Cybern 57: 349355