system that warns on an impending lead-vehicle conflict. Results: The findings show that automation does affect visual behavior. In general, compared to ...
THESIS FOR THE DEGREE OF LICENTIATE OF ENGINEERING in MACHINE AND VEHICLE SYSTEMS
Visual response to attentional demand in increasing levels of automation: A situated approach ALBERTO MORANDO
Department of Mechanics and Maritime Sciences CHALMERS UNIVERSITY OF TECHNOLOGY Gothenburg, Sweden 2017
Visual response to attentional demand in increasing levels of automation: A situated approach ALBERTO MORANDO
© ALBERTO MORANDO, 2017 THESIS FOR LICENTIATE OF ENGINEERING no 2017:03
Department of Mechanics and Maritime Sciences Chalmers University of Technology SE-412 96 Gothenburg, Sweden Telephone + 46 (0)31-772 1000
Chalmers Reproservice Gothenburg, Sweden 2017
Abstract Introduction: Adaptive cruise control (ACC) is a system that automates the longitudinal control of the vehicle, and maintains safety margins to a lead vehicle. ACC has been shown to have positive safety effects in reducing the exposure to critical situations. However, ACC in normal driving has also been shown to generally decrease the drivers’ attention devoted to monitor the road ahead. A number of studies claim that automated systems, such as ACC, may have detrimental effects, e.g., due to lack of supervisory control. In fact, ACC requires the drivers’ constant supervision to regain control if needed, otherwise drivers may fail to cope with situations beyond the system’s capabilities. ACC is a low level of automation; as these systems evolve unintended effects on drivers’ behavior may accentuate. Objectives: Automation is an increasingly important area of research in transportation. There is a need to understand the effects of automation on drivers’ behavior, and to assess the safety implications thereof. Most research is limited to simulator experiments; the effects in real-world driving remain unclear. Methods: Visual behavior was investigated when driving with ACC and a critical situation was encountered in real-world driving. Critical situations were identified as the onset of the frontal collision warning (FCW), a system that warns on an impending lead-vehicle conflict. Results: The findings show that automation does affect visual behavior. In general, compared to manual driving, drivers devoted less attention at the forward road when using ACC. However, the results show that visual behavior is tightly coupled to driving situation characteristics, and drivers are responsive to perceptual cues that alert of an impending threat. Conclusion: The results provide knowledge essential for safety assessment of automated systems. These results have implications for development of safe automated systems, to promote and support an appropriate driver response in critical situations. Keywords: Attention, visual behavior, driving demand, automation, real-world driving, naturalistic data, human factors.
I
This research was financially supported by the European Marie Curie ITN project HFAuto (Human Factors of Automated driving, PITN– GA–2013–605817). I am grateful to all members and fellow PhD students.
III
To my supervisors, Marco and Trent, for raising the bar and teaching me how to do good science. To my friends and colleagues, you have been part of this trip in so many ways. To my family, for your love, support, and constant encouragement. To Emma, my love. To my mom, you will be always in my heart. To myself, for not giving up.
V
Table of contents Abstract ........................................................................................................ I Visual attention ........................................................................................ 1 Visual attention in driving ......................................................................... 5 Visual attention and driving task demand ................................................. 7 3.1. Driver features.......................................................................................... 7 3.2. Vehicle features........................................................................................ 8 3.3. Environment features ............................................................................... 9 Visual attention in car‐following ............................................................. 11 4.1. Car following in manual driving ............................................................ 11 4.2. Car following with adaptive cruise control (ACC) ................................ 12 Objectives .............................................................................................. 15 Summary of papers ................................................................................. 17 The time-course of driver visual attention in naturalistic driving with adaptive cruise control and forward collision warning ................................. 19 Drivers anticipate lead-vehicle conflicts during automated longitudinal control: Sensory cues capture driver attention and promote appropriate and timely responses .................................................................. 21 Discussion .............................................................................................. 25 7.1. Why visual behavior?............................................................................. 25 7.2. Why naturalistic data? ............................................................................ 25 7.3. Why adaptive cruise control (ACC)? ..................................................... 26 7.4. Reflections on the human factor challenges in automated driving......... 27 Conclusion .............................................................................................. 31 Future work ............................................................................................ 33 On modelling the drivers’ response process to lead-vehicle conflicts when driving with adaptive cruise control ..................................... 34 On describing and modelling visual behavior in manual driving and driving with adaptive cruise control and lane keeping aid ..................... 34
VII
On describing and modelling visual behavior and response process to lateral and lead vehicle conflicts in highly-automated driving ................. 35 Bibliography ............................................................................................... 37
VIII
Visual attention A large and growing body of literature has studied visual attention. The purpose of this chapter is to provide a short summary on the topic. The concepts presented here will be used throughout the thesis. Attention is the mechanism to select and prioritize aspects important for carrying out an activity, among a range of information in the environment coming from sensory inputs (Carrasco, 2011; Findlay & Gilchrist, 2003; Smith & Kosslyn, 2014a). Vision dominates our experience. It has a crucial role for planning and executing a variety of daily tasks, for example driving (Land, 2006). Vision enables us to perceive the environment and guide motor actions to interact with it (see vision for perception and action in Carrasco, 2011; Land, 2006; Smith & Kosslyn, 2014b). Visual attention is the process of allocating visual system’s resources (the eye and the cortex) to a location informative for interacting with the environment. Visual attention can be allocated by moving the eyes to an area of interest (overt attention), or by attending to an area in the visual periphery without moving the eyes (covert attention) (Carrasco, 2011). Overt and covert attention are integral part of the visual attention process. The covert attention allows for monitoring the visual field, and it usually precedes the shift of overt attention towards a new location of interest (Carrasco, 2011). The resolution of the visual field, in fact, is not uniform. Only the central part of the visual field (fovea) is capable of high resolution (Carrasco, 2011; Smith & Kosslyn, 2014a, 2014b). The fovea is a small area of the retina (Land, 2006). The visual resolution rapidly decreases with eccentricity from the fovea toward the periphery (Carrasco, 2011; Land, 2006; Smith & Kosslyn, 2014b). Some information can be extracted only with the peripheral vision (e.g., color, luminance, movement), but it is necessary to move the eyes to shift the foveal vision and enhance the perception on a precise spot (Land, 2006). Thus, eye movements are a strong indicator of where the visual attention is directed to (Carrasco, 2011; Corbetta et al., 1998).
1
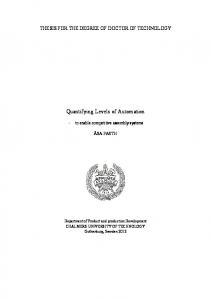
Figure 1. Eccentricity between the area of interest (AOI) the eyes are directed to (i.e., glance location) and a reference AOI (AOI').
The movement of the eyes is a combination of saccades, fixations, and smooth pursuit. Saccades are quick ballistic movements to move the eyes to a new location. Fixations are periods between saccades in which the eyes are held stationary to enable perception. Smooth pursuit movements allow to track moving targets (Land, 2006). Eye movements and visual behavior can be described by several metrics at different levels of details (Victor et al., 2008). For the purpose of this thesis visual behavior is described by glance-based metrics, which embed fixational, saccadic, and smooth pursuit eye movements. A glance is defined as the transition of the eyes to an area of interest followed by one or more contiguous fixations within that area (standard ISO 15007-1). The glance construct is motivated by limitations in eye-tracking technology, which do not have enough temporal and spatial resolution to identify individual saccades and fixations, and by the fact that we are usually interested on where the attention is devoted with respect to an area larger than the foveal region (standard ISO 15007-1). Several glance-based metrics can be derived. For example, the metrics used in this thesis are glance location and glance eccentricity. Glance location is the area of interest the eyes are directed to. Glance eccentricity is defined as the radial angle between the current location of the glance and a reference direction (Figure 1). Further information on key terms, parameters, and measurement of visual behavior in the context of road vehicles can be found in the standard ISO 15007-1 and 15007-2. Visual attention is a combination of bottom-up and top-down processes (Carrasco, 2011; Smith & Kosslyn, 2014a, 2014b). Bottom-up processes are involuntary and driven by sensory inputs. For example, they allow for detecting basic features of the visual scene (e.g., color, edges). Top-down processes, instead, are voluntary and driven by task goals. They allow for seeking,
2
extracting, and interpreting relevant information for the current activity (Smith & Kosslyn, 2014b). Context, prior knowledge, and expectation guide top-down processes. They facilitate the attentional process, make it more efficient and accurate to the current situation (Smith & Kosslyn, 2014b). Bottom-up and topdown process continuously interact and compete. For example, a salient stimuli in the periphery may elicit a bottom-up process and interrupt an on-going topdown process, causing an automatic shift of attention from the current focus towards the stimuli. It is hypothesized that such salient stimuli, which can quickly capture attention, may be associated with behavioral urgency (Franconeri & Simons, 2003; Lin et al., 2008). For example, given stimuli of the same magnitude, looming objects indicate an impending collision and would trigger a reflexive response, whereas receding objects should not elicit the same response, being neither potentially urgent nor threatening.
3
Visual attention in driving The previous chapter gave an overview of attention, focusing on the underlying mechanism of visual attention. The current chapter explains why visual behavior and attention are important for safe driving. Driving is an example of visually-guided action that requires efficient visual attention allocation for safely operate the vehicle: scan the environment to detect obstacles and events (vision for perception), and support the longitudinal and lateral control of the vehicle based on this information (vision for action). Drivers, in general, direct their visual attention at the forward roadway, because that is the most relevant location for safe driving. Because of the limited field of view in the eyes, however, driving entails short glances directed away from the forward roadway to attend to other sources of information—to be aware of the surroundings of the vehicle, look at road signs, and check the instrument cluster. These off-road glances are part of scanning activities that are driven by expectation and becomes more efficient with experience (top-down process) (Engström, Victor, et al., 2013). Such scanning activities are related to the driving task; they serve an important role in perceiving the driving environment and maintaining safety. Some aspects of driving rely on covert attention. Peripheral view alone has been shown to be sufficient to maintain the lane position of the vehicle (Summala et al., 1996). Moreover, unexpected visual stimuli in the peripheral view—a pedestrian suddenly stepping on the road—can trigger bottom-up processes and capture the driver’s attention. Visual scanning activities require efficient and timely attention allocation— looking at the right place at the right time—otherwise the driver may fail to notice objects and events, and to successfully respond to hazards (Hancock et al., 2008). Hazards are objects, conditions, or situations that tend to produce an accident if not handled correctly (Olson & Dewar, 2002). The “mismatch between the current allocation of resources and that demanded by activities critical for safe driving” is defined as inattention in driving (Engström, Monk, et al., 2013, p. 17).
5
The allocation of visual attention can be impaired by competing distracting activities. Distracting activities are those not required for safe driving, thus secondary to the driving task (e.g., interacting with a mobile phone) (Lee, J. D. et al., 2008). Improper allocation of visual attention—especially because of inattention and distraction—is a longstanding issue in traffic safety. Visual inattention and distraction have been identified as the most common crash contributing factor by large scale naturalistic studies (Dingus et al., 2006; Klauer et al., 2006; Victor et al., 2015) and in-depth crash investigations (Singh, 2015). It is clear that there is a relationship between visual behavior and crash risk; long glances away from the road and the consequent deficit of attention allocation on road, have been a main concern. However, as argued by Victor et al. (2015), even short lapses of attention from the forward road can lead to crashes—timing and driving context matter more than glance duration per se.
6
Visual attention and driving task demand The previous chapter introduced why visual behavior is important for driving, and it emphasized that driving safely requires appropriate allocation of attention. The current chapter argues that the appropriate level of attention depends on the driving context. The visual attention one should devote to driving depends on the task demand. Task demand can be understood as the amount of resources (e.g., visual, motor, cognitive) required to perform an activity (Engström, Monk, et al., 2013). Safe driving requires an attentional state that keeps matching that which is required by the driving task (Engström, Monk, et al., 2013). Therefore, to study visual behavior and attention in driving, a situated approach should be taken: the driver, the vehicle driven, and the driving environment form a joint system (DVE system; see Engström & Aust, 2011). The components of the DVE system influence and interact with each other. Each component can be represented as a set of features with different temporal dimensions. Some features may vary slowly during a trip, whereas others may change rapidly. In general, the driving task demand evolves gradually, but sometimes changes occur abruptly. The traffic environment can become highly complex, and critical situation may appear unexpectedly, so it crucial to continuously detect, identify, and assess the many dynamics and changing elements on road (Wickens & Horrey, 2008).
3.1. Driver features Driving is to large extent a self-paced task (Summala, 2007). It means that the drivers themselves, being the operators of the vehicle, can actively control the evolution of the task demand and adapt to it (adaptive driver behavior in Engström & Aust, 2011). For example they can choose a different road, reduce the speed, or increase the headway to the surrounding traffic in case of complex and less predictable scenarios to compensate for an increased demand. Summala (2007) proposed that, in general, drivers aim to keep themselves inside their subjective comfort zone, whose boundary is primarily determined by safety
7
margins to obstacles in the environment. Thus, normal (or routine, non-critical) driving may be conceptualized as acting to maintain a comfortable level of task demand (Summala, 2007). The comfort zone’s boundary, however, may be stretched by extra motives when the driver could gain a benefit that justifies the cost of getting closer to the discomfort zone, and in turn increases the amount of demanded attentional resources (Summala, 2007). For example, drivers may adopt shorter headway when in a hurry, but doing so they are more vulnerable to crash. Hence, to prevent a collision increase attentional effort is deployed to compensate to intentionally reduced safety margins (Engström, Monk, et al., 2013) to timely respond to sudden changes of other road users’ behavior. To avoid a critical situation and reduce the feeling of discomfort, drivers adopt safety margins to obstacle on the road. Safety margin can be defined as the spatial and temporal distance between the boundary of the comfort zone and safety zone (Engström & Aust, 2011). The safety zone represents the set of DVE parameters in which a collision can still be avoided (Engström & Aust, 2011). The safety zone is objectively determined (Engström & Aust, 2011): it depends on the properties of the vehicle (e.g., brake capacity), the environment (e.g., surface condition), and the drivers themselves (e.g., brake reaction time). The safety margins, however, are subjective, and they may be inadequate for the current driving context. The choice of safety margin affects the required allocation of visual attention. Even short off-road glances can be dangerous and create a mismatch if the safety margin adopted is not sufficient to cope with sudden changes in the traffic environment (proactive barrier, see Engström, Victor, et al., 2013). The drivers’ abilities to preserve comfort zone depends also on expectancy (Engström & Aust, 2011). Expectancy is the proactive (top-down) allocation of attentional resources based on the prediction on how the current driving situation will evolve, from previous experience and other contextual information (Engström et al., 2017; Engström, Monk, et al., 2013; Senders et al., 1967; Victor et al., 2008).
3.2. Vehicle features The properties of the vehicle influence the attention required for the driving task too. For example, Senders et al. (1967) showed an increase of attentional
8
demand—an increase of discomfort—at higher speed, and when the handling of the vehicle is poor, making lane keeping more difficult. In recent years, there has been an increasing interest in how advanced driver assistance systems (ADASs) may influence the attentional demand of driving. On one hand, for example, electronic stability control (ESC) and anti-lock braking system (ABS) have shown to help the drivers adapting properly to changes of the DVE system and reduce control loss (Markkula, 2015). A reduced attentional effort to control task is then expected. On the other hand, such systems have also shown to cause unintended effects (negative behavioral adaptation, see OECD, 1990; Rudin-Brown, 2010). For example, studies showed a reduction of safety margins when using ABS and ESC, e.g., increase of speed and shorter following headway, claiming detrimental effects on safety (Rudin-Brown, 2010). Behavioral adaptation could be understood as the tendency to maintain a chosen level of task difficulty (task difficulty homeostasis) (Fuller, 1984; Rudin-Brown, 2010). As ADASs become more reliable and new and improved features are implemented—for example to support automated driving—unintended effects may become more accentuated. This matter will be further discussed in Chapter 4 and 7.
3.3. Environment features The features related to the driving environment that affect driving demand can be related to the infrastructure (e.g., road type, road geometry), traffic (e.g., traffic flow, and behavior of other road users), and other variables such as illumination and weather. For example, on-road studies showed an increase of attention devoted to the forward road on curvy roads (Olson et al., 1989; Senders et al., 1967; Tivesten & Dozza, 2014), on trafficked roads (Senders et al., 1967; Tivesten & Dozza, 2014), in car-following (Olson et al., 1989; Tivesten & Dozza, 2014) especially when approaching the lead vehicle (Tijerina et al., 2004), and in night driving (Olson et al., 1989). As introduced in the previous paragraph, these environmental features in turn influence the safety zone (e.g., the road grip affects the braking capabilities of the vehicle), and the driver’s perception capabilities (e.g., ability to see in low light conditions), and driver’s expectancy (e.g., in busy traffic the driver needs to predict how the road users will behave). Some of the features of the DVE system can be directly measured from signals in controller area network (CAN) bus (e.g., day/night and presence of other vehicles). Others driving demand variables can be inferred by the pedal and steering activities (see for example Harry et al., 2008).
9
Visual attention in car‐following The previous chapter explained that the required level of attention is embodied in the driving context, which depends on a range of intertwined features of the driver-vehicle-environment system. This chapter applies the concepts previously described to the car-following scenario. In so doing it establishes the context for Paper I and II.
4.1. Car following in manual driving Car following is one of the most common driving situations, and rear-end collisions are the most frequently occurring type of accident. According to (UMTRI) in 2015 rear-end crashes accounted for approximately 26% of all crashes. Safely following a lead vehicle requires continuous adjustment of kinematic parameters to maintain the safety margin to the lead vehicle, in order to reduce the crash risk and the feeling of discomfort, as outlined in Chapter 3 (Figure 2). In order to do so, drivers need to estimate the time and space distance to the lead vehicle, while taking into account the current state of the driver-vehicleenvironment (DVE) system. Drivers need to evaluate the characteristics of driving environment and of the vehicle (e.g., the stopping distance depends on the brake capacity and the road grip). Furthermore, drivers need to estimate their performance, for example their brake reaction time. These adjustments can be proactive, when based on the expected evolution of the DVE system, or reactive, when the response is to a change of the DVE system. The most common metric used for quantifying the safety margin in a carfollowing situations is time to collision (TTC). TTC is the ratio of the distance between the vehicles and their relative speed, and it expresses how long it will take to a collision if no action is taken. (According to this definition, if the cars are travelling at the same speed, TTC tends to infinite; if the lead vehicle is faster than the following one, TTC is undefined.)
11
Figure 2. Visualization of safety zone, comfort zone, and safety margin applied to the car‐following scenario. Headway is an example of feature of the driver‐vehicle‐environment (DVE) system relevant in car‐following driving situation.
In order to estimate the physical quantity TTC, drivers may predominantly use visual cues, such as looming (Hoffmann; Hoffmann & Mortimer, 1994; Lee, D. N., 1976; Mortimer). Looming is the optical expansion of the lead vehicle at the eyes of the driver. The perception threshold of looming increases with retinal eccentricity, hence the further away the glances are from the forward path, the longer the time will be before the driver may realize that a collision is impending (Lamble et al., 1999; Summala et al., 1998). There are, however, a range of other contextual cues that may support the driver to control the distance to a lead car, which are discussed in Paper II. For example, another visual cue is the brake light onset, which signals that the lead vehicle started braking. However, brake light onset alone may not be the cue that elicit a brake reaction, since it does not consistently signal a critical situation (Markkula et al., 2016; Victor et al., 2015).
4.2. Car following with adaptive cruise control (ACC) Adaptive cruise control (ACC) is an advanced driver assistance system (ADAS). ADASs are active safety systems, in the sense that they aim to reduce the exposure to critical situations and prevent accident to happen by providing information, warning, and interventions. Doing so, they compensate and countermeasure drivers’ attentional limits (Lee, J. D., 2008). ACC automates the longitudinal control and allows following a lead vehicle by maintaining the headway according to chosen settings. ACC uses a combination of sensors, e.g. front facing radar and camera, to detect the vehicle in front. Because it provides sustained automation, it is classified as Level 1 of automation (SAE, 2016). ACC is intended as a comfort system, to release the driver from some of the control task in normal driving situations, especially on highways.
12
ACC has shown to reduce the exposure to critical situations due to an increase of safety margins with respect to manual driving (Malta et al., 2011). The ACC braking capacity is limited to a level sufficient for normal carfollowing situations, not extreme braking (the braking authority varies among implementation, but it is usually about 0.3g as suggested in the standards ISO 15622:2010 and ISO 22179:2009). When the braking capacity is exceeded—for example because of a highly decelerating lead vehicle—a frontal collision warning (FCW) is issued. A FCW is usually a visual and auditory warning that redirects the driver’s visual attention to the forward road and elicit an evasive maneuver to an impending collision. The FCW exploits bottom-up processes to capture one’s attention via salient stimuli. The driver is required to constantly supervise the system and be ready to regain control when necessary, without solely relying on the warning. In fact, the driver should be also receptive to silent failures (i.e., without notification), for example due to sensor limitation. Because of vehicle-allocation of some of the control tasks (i.e., accelerating and braking to maintain a safe headway to the vehicle in front) the driving task demand is reduced when driving with ACC. As a consequence, the use of ACC in normal driving has been shown to generally decrease the attention allocated for monitoring the road, which is considered potentially unsafe (Malta et al., 2011; Rudin-Brown, 2010; Rudin-Brown & Parker, 2004). Several experimental studies have raised concern that drivers would not respond appropriately in critical situations (de Winter et al., 2014). However, it is not clear how this issue would transfer to real world driving. Hence, there is a need to address the safety consequences of ACC. This thesis aims to investigate drivers’ visual behavior when driving with ACC in real-world driving—especially when critical situations are encountered—and to assess whether safety would be compromised.
13
Objectives The present thesis was developed within the European Marie Curie ITN project HFAuto (Human Factors of Automated driving). The goal of HFAuto was to generate knowledge on the effects of automation on driver behavior and promote safer road transportation. The general objective of the PhD project is to understand what safety related driver behavior is required at different levels of vehicle automation. The aim is to inform the design of advanced driver assistance systems that promote and support appropriate driver response when driving automated vehicles, especially in critical situations. The approach taken in this PhD work is to model the drivers’ attention and response process, by investigating their visual and response behavior in critical situations. The present Licentiate thesis is the first step towards this objective. The research focused on the analysis of driver’s visual behavior when driving with automated longitudinal control (Level 1 of automation according to SAE, 2016). The safety implication of this behavior in critical situations is assessed using real-world driving data. The research questions that motivated the work in this Licentiate thesis are:
How does driver visual behavior change from manual driving to driving with automated longitudinal control in real-world driving? How may this behavioral change affect safety in critical situations?
15
Summary of papers This chapter summarizes the empirical studies included in this thesis. Two published papers are appended. The papers present an effort to examine visual behavior in the context of automation in real-world car-following driving, especially in potential critical situations. The papers included in this thesis are: I.
II.
Tivesten, E., Morando, A., & Victor, T. (2015). The timecourse of driver visual attention in naturalistic driving with adaptive cruise control and forward collision warning. Paper presented at the Driver distraction and inattention, Sydney, New South Wales. Morando, A., Victor, T., & Dozza, M. (2016). Drivers anticipate leadvehicle conflicts during automated longitudinal control: Sensory cues capture driver attention and promote appropriate and timely responses. Accident Analysis & Prevention, 97, 206-219. doi:10.1016/j.aap.2016.08.025.
17
The time‐course of driver visual attention in naturalistic driving with adaptive cruise control and forward collision warning Introduction Adaptive cruise control (ACC) automates the longitudinal control of the vehicle. It is a comfort system that have been shown to have a positive effect on safetyrelated measures despite a general decrease of attention devoted to monitor the road ahead. Concerns have been raised regarding lack of supervisory control by the driver and the inability to cope with critical situations. Aim To evaluate if automation may have harmful effects, the drivers’ visual behavior was examined in critical lead vehicle situations while driving with ACC. The main research question was whether the drivers were ready to appropriately respond in such critical situations. Method The analysis was based on the naturalistic dataset EuroFOT. Visual behavior was manually coded based on videos of the driver’s face. Several signals recorded from the controller area network (CAN) bus were used for events selection: critical events were defined as hard deceleration by the ACC or the trigger of the frontal collision warning (FCW). The main glance metric used thorough the paper was the proportion of on-path glances at aggregate level. Results The key finding was that drivers were already looking on path at the onset of the critical situation—they anticipated the lead-vehicle conflict. Instead, in noncritical situations they were more willing to take their eyes off-path when using ACC than in manual driving. Discussion This study shows that there is evidence of visual response to attentional demand in automated driving. The findings suggest that drivers adapts their visual behavior in response to the context. Drivers reoriented their visual attention to the forward path and anticipated an impending lead vehicle conflict before the situation became critical. However, the reason behind such threat-anticipation mechanism was not clearly identified. This anticipation mechanism was further investigated, and the results were published in Paper II.
19
Drivers anticipate lead‐vehicle conflicts during automated longitudinal control: Sensory cues capture driver attention and promote appropriate and timely responses Introduction This paper extends the results from Paper I and focused on the threat-anticipation mechanism. Similarly to Paper I, the analysis of visual behavior was done in the context of critical lead-vehicle scenarios when driving with ACC. Aim The purpose of this paper was to identify the causes related to the anticipatory mechanism of lead vehicle conflicts when driving with ACC. The main hypotheses were that visual and deceleration cues could alert the drivers of an impending conflict. Method The analysis used the naturalistic database EuroFOT to examine visual behavior with respect to two manually-coded metrics (glance location and glance eccentricity), and then it related the findings to vehicle data (e.g., speed, acceleration, and radar information). As in Paper I, critical situations were identified as a FCW onset. Results Visual and deceleration cues were found to be relevant for capturing driver attention to the forward path in anticipation of the threat. The results also show that the FCW acted as an effective attention-orienting cue when no threat anticipation was present (false positive warnings). Discussion These findings provide information about drivers’ response to conflicts when longitudinal control is automated. The results suggest that sensory cues are important for alerting drivers of an impending critical situation, allowing for a prompt reaction. Thus, automated systems design would benefit from exploiting such cues to support driver’s response (actuated attention). The paper also discusses how glances off-road have different safety implications than glances off-threat. Visual behavior is to be interpreted in context and with respect to critical events.
21
In summary, the results of Paper I and II showed that the time-course of visual attention is dynamic and the characteristics of visual behavior change according to the real-time evolution of the driver-vehicle-environment (DVE) system. The response of visual attention was described by a range of contextually defined intervals, which are essential for understanding the attentional response process. Paper I unveiled an anticipatory mechanism: drivers anticipated an impending lead-vehicle conflict by increasing the visual attention to the forward road. Paper II argues that, although vision is the dominant source of information in driving, vestibular-somatosensory cues also play a role in alerting the drivers of an impending conflict. These findings have some practical implications for the design of automated systems: they suggest that vehicle actuation (e.g., braking) may be a trigger, or cue, that reorients driver attention towards the road.
23
Discussion The main aim of this thesis was to study and assess the effects of automated systems on drivers’ visual attention. The approach taken in this thesis was to investigate visual behavior in real-world driving when using adaptive cruise control (ACC). This chapter discusses the results from this research.
7.1. Why visual behavior? This thesis focused on visual behavior because eye movements are the proxy for determining what the drivers attend to. From Chapter 2, it emerges that driving safely relies on proper allocation of visual attention. Poorly allocated visual attention (i.e., inattention) impairs object and event detection, and increases the crash risk. Chapter 1 indicates that visual attention is not a passive information processing mechanism. The driver is actively engaged in the perception-action cycle, which is driven by bottom-up stimuli and top-down goals. These processes interplay in detecting relevant changes in the driving context, as commented in Paper I and II. For assessing whether the visual attention the drivers are devoting is appropriate for the driving situation at hand, a situated ecological stance was taken. The required visual attention, in fact, depends the driving task demand, which can be conceptualized as a joint driver-vehicle-environment (DVE) system (Chapter 3). This impacts the way we should be looking at solving problems related to inattention. To assess the safety consequences, drivers’ visual behavior is to be interpreted in context and with respect to critical events, as shown in Paper I and II.
7.2. Why naturalistic data? This thesis analyzed real-world (naturalistic) driving data because they allows to study driving behavior at high ecological validity, as compared to studying it with simulator experiments. Chapter 3 emphasized how important the ecological driving context is for interpreting driver behavior.
25
Paper I and II used data from the EuroFOT project. EuroFOT (Kessler et al., 2012) was a naturalistic field operational test (FOT) sponsored by the European community to evaluate the impact of advanced driver assistance systems (ADASs), such as ACC, on routine driving in real traffic. Data were continuously collected from a fleet of instrumented vehicles over an extended period of time. The data were logged, in unobtrusive way, from the controller area network (CAN) bus, and additional cameras to record the surrounding of the vehicle and the driver face. Naturalistic studies have, however, some limitations intrinsic to their design, e.g., lack of experimental control. Paper I and II constrained the analysis of naturalistic data to straight roads and the analysis was done aggregating the data from all the participants.
7.3. Why adaptive cruise control (ACC)? Vehicle automation is not all-or-none. According to the taxonomy proposed in (SAE, 2016), the level of driving support increases from manual (Level 0) to fully autonomous driving (Level 5). Paper I and II investigated driver behavior when using adaptive cruise control (ACC). ACC can be classified as Level 1 of automation, because it provides sustained assistance of the longitudinal vehicle control. Hence, ACC can give an insight on how automation, albeit at a low level, influences driver behavior. Several experimental studies raised concerns about the safety implications of automated systems, such as ACC (for a review see de Winter et al., 2014). Lack of supervisory control and the inability to cope with critical situations were a central issue. As these systems evolve, unintended effects may become more accentuated and new human factors issues may be uncovered (Rudin-Brown, 2010; Seppelt & Victor, 2016). The main challenge faced by many experiments, however, is the ecological validity of the simulator results, and how these results transfer to real world driving (Engström & Aust, 2011). If adaptation and response to the DVE context is more influential than previously thought, then the differences between test venues (simulator or on-road) may also largely impact results. For example, Paper I and II showed that in normal (steady state) driving, drivers did pay less attention to the forward roadway when using ACC compared to manual driving. However, drivers redirected their attention in anticipation of
26
potential critical situations. Paper II argues that deceleration cues from system actuation—often discounted in simulator studies—may provide attentional cuing toward the forward road and elicit the driver’s response. Real-world data collected with vehicles capable of higher level of automation are yet to be available, but there are some planned on-road naturalistic studies, e.g., by MIT (2017) and the Drive Me project by Volvo car (Victor et al., 2017). Therefore, simulator studies are the best tool available to investigate how higher automation might shape driver behavior.
7.4. Reflections on the human factor challenges in automated driving Vehicle automation technology is advancing rapidly. Levels 12 of automation are already available in the market—as a combination of ACC and lane centering system (LC)—and higher levels of automation are being tested on public roads (California Department of Motor Vehicles (DMV), 2017). Along with increasing interest in developing automated systems, there has been an increasing interest in capturing how new technology influences driver behavior (Lee, J. D., 2008); this thesis in an example thereof. Advanced automation may drastically change the nature of driving; automation may reduce the driving demand, increasing comfort and safety, but it may as well deteriorate humans’ performance and compromise safety (ironies of automation, see Bainbridge, 1983). As argued by Seppelt and Victor (2016), automation should be used when there is a positive net-benefit compared to manual driving, including the cost of a reduction in human performance. In-depth crash investigation attributed the critical reasons for crash events at 94% to the driver (Singh, 2015). Among the critical reasons, recognition errors—for example due to inattention and distractions—accounted for 41%. Thus, automation has enormous potential to make driving safer. Automated driving has renewed human factors challenges which were already faced in the aviation and process control (Endsley & Jones, 2011). Similarly to these other fields where automation has been introduced, how automation influence the role of the driver has become a central topic.
27
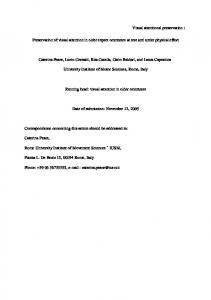
Figure 3. Driver's role at increasing level of automation. The action‐ perception process can be conceptualized as the attentional loop. At left most side the driver is driving manually and the system is not engaged (Level 0 of automation according to SAE, 2016). At the right most side the system has full control on the driving task and the human is not engaged (Level 5 of automation according to SAE, 2016). In the middle, human and automated system have a complementary role in the driving task. Based on (Flemisch et al., 2011).
7.4.1. Automation changes the driver’s role As the level of automation increases, the role of the driver changes accordingly: from operator, to supervisor, to passenger (Figure 3). The human factor community is particularly dedicated on studying the mid-levels of automation, i.e., Levels 23. At Level 2, the driver is largely released from the longitudinal and lateral control of the vehicle, but is required to supervise the system and the driving environment. When drivers assume monitoring roles, it means that they should be receptive to changes in the environment that are not properly handled by the system and regain control if needed (e.g., brake or steer for a hazard). The central problem is that several studies have argued that humans are not good at monitoring tasks, suggesting that vision for objects and events detection alone— that is without the component of action—is suboptimal (Seppelt & Victor, 2016). The main human factor issue here is the humans’ tendency to slip out the perception (monitoring) loop, failing to perform the role specified for them. At Level 3, the system may occasionally require human intervention. The driver would need to timely and appropriately regain control without the need of constantly monitoring the system (fallback ready, see SAE, 2016). The main human factor issue here is how to plan graceful transition of control (e.g., via
28
human machine interfaces design), and ensure that the drivers are ready to intervene.
7.4.2. Potential solutions within the context of this thesis The previous section pinpointed two main human factor challenges in automated driving: 1. How do we maintain an appropriate level of monitoring by the driver when supervision of automation is required? 2. How do we elicit an appropriate and timely driver’s response when required by limitations in automation? Both questions can be addressed though monitoring of the driver’s visual attention and response process. This thesis is the first step towards this solution. This thesis set out to investigate driver visual behavior during low level of automation. Further research is needed, to integrate the visual behavior component into the overall response process and to extend the results to higher levels of automation. To address question (1) a driver monitoring system (based on eye-tracking) could assess whether the driver’s attention is appropriate for the driving context at hand. When the level of attention exhibited is below threshold for a specific driving situation, alerts may be delivered to reorient driver’s attention back to the driving task, or the automation may compensate for the deteriorated performance. A prerequisite for developing a monitoring system is a reference model of visual attention, to assess whether the current perception cycle is compromised. To address question (2) the assessment of visual attention and the modelling of the response process could inform the design of human machine interfaces (HMIs), in order to make control transitions and interventions suitable for the current attentional state and response capabilities. There is the need to develop a reference model of the response process when driving a highly-automated vehicle, which should incorporate both visual and motor behavior of drivers.
29
Conclusion The two research questions that motivated the work in this Licentiate thesis are addressed here.
How does drivers’ visual behavior change from manual driving to driving with automated longitudinal control in real‐world driving? Paper I and II prove that automation affects driver visual behavior. In normal, routine driving with adaptive cruise control (ACC)—an advanced driver assistance system that automates the vehicle’s longitudinal control—drivers devoted less attention to the forward road than in manual driving. This effect was found in steady-state car-following situation and considered potentially unsafe. How may this behavioral change affect safety in critical situations? Despite there being a general decrease of visual attention in normal driving when using ACC, however, drivers were responsive to perceptual cues from the driving context that signaled a threat (e.g., visual looming and deceleration cues), and timely responded by increasing attention to the forward path. By the onset of the potential critical situation—identified as the onset of the frontal collision warning (FCW)—drivers were already looking on path. Paper I and II reported this new finding and explained it as a threat-anticipation mechanism. Importantly, this finding can help explain the results in (Malta et al., 2011) that show an improved performance in safety despite a decrease in attention to the road during normal driving. Implications of the work The studies included in this thesis (Paper I and II) impact how drivers’ behavior should be interpreted in automated driving: context and timing matter. That is, to understand the relationship between automation, visual behavior, and safety, it is crucial to study responses to critical situations. The design of advanced driver assistance systems should then allow visual attention to vary during the development of the driving context, and ensure that drivers are receptive in anticipation to critical situations. Furthermore, the
31
findings suggest that automation can be designed to exploit attentional cues (e.g. from deceleration) to elicit appropriate driver’s attention and response (actuated attention).
32
Future work This chapter introduces three papers in preparation that were not included in this Licentiate thesis. The papers in preparation aim to model driver visual behavior and response process, focusing on automated driving. The purpose of the model is to develop a monitoring system able to assess if the driver behavior is appropriate for the current driving context, provide feedback, and sustain behavioral changes. These studies build upon the findings and methods from Paper I and II and extend them. These papers are intended to be included in the PhD thesis. The papers included in the Licentiate thesis and the papers in preparation are put in context in Figure 4.
Figure 4. Contextualization of the papers included in this Licentiate thesis (filled circle) and the papers in preparation which will be included in the Ph.D. thesis (empty circle). Three levels of increasing automation are considered: adaptive cruise control (ACC), adaptive cruise control with lane keeping assist (ACC+LKA), and adaptive cruise control with lane centering (ACC+LC).
33
On modelling the drivers’ response process to lead‐ vehicle conflicts when driving with adaptive cruise control Tentative title: Morando, A., Victor, T., & Dozza, M. (In preparation). Driver response process in critical situations with automated longitudinal control.
This study aims at modelling drivers’ response processes to lead-vehicle conflicts when using ACC. This study is based on the same dataset of Paper II. Paper II investigated visual behavior, which is the perception component of the attention process. Paper III focuses on the action component, by breaking down the drivers’ evasive maneuver. Paper II and III together will support the design of an algorithm that can monitor the drivers’ response process in critical situations. The drivers’ response process is modelled as a sequence of states, which range from the detection of the threat to the execution of avoidance maneuver. The duration of the states and the transition between them is dynamic and it depends on features of the driver-vehicle-environment (DVE) joint system. The study attempts to mathematically model (e.g., using a hidden Markov model; HMM) the drivers’ behavioral response, incorporating visual and motor response, and features from the driving context.
On describing and modelling visual behavior in manual driving and driving with adaptive cruise control and lane keeping aid Tentative title: Morando, A., Victor, T., & Dozza, M. (In preparation). Driver attention in automation: Does driver glance behavior change in response to longitudinal and lateral assistance in real world data?
This study aims at assessing how the use of ACC in combination to LKA affects driver visual attention in comparison with manual driving. The study quantifies and models visual behavior. It identifies representative features of glance behavior, and it provides a reference analytical model of driver visual behavior in normal driving, with and without automation. The data analyzed in this study were from the EyesOnRoad database. EyesOnRoad was a naturalistic Field Operational Test (FOT) to evaluate a prototype system for real-time measurement of driver’s visual attention during routine driving (Karlsson et al., 2016). Ten cars were equipped with ACC and LKA and a range of other ADAS functionalities. The eye-tracker installed in the car automatically classified glance location on road and off road.
34
On describing and modelling visual behavior and response process to lateral and lead vehicle conflicts in highly‐ automated driving Tentative title: Morando, A., Gonçalves, J., Victor, T., Bengler, K., & Dozza, M. (In preparation). Visual behavior and response process during highly automated driving: A simulator study.
This simulator study was done in collaboration with the Technical University of Munich (TUM), within the HFAuto project. The experiment used the TUM highfidelity fixed base simulator. A total of 45 subjects took part in the experiment. The aim of the simulator study was to investigate and model the attentional response (visual and action process) in highly automated driving in critical lead and lateral vehicle conflicts. The automation was a combination of ACC and lane centering (LC) that allowed the drivers to keep hands off steering wheel and feet of pedals. The subjects performed a distracting secondary task, which made them disengage from the primary driving task and looking away from the forward path (therefore reducing predictive visual cues of an imminent threat). Vehicle data were logged from the simulator software. Additional cameras were installed to record the body of the driver and their glance behavior. The study builds upon the methods developed in Paper II, III, and IV, for analyzing and modelling visual behavior and response process.
35
Bibliography Bainbridge, L. (1983). Ironies of Automation. Automatica, 19(6), 775-779. doi:10.1016/0005-1098(83)90046-8 California Department of Motor Vehicles (DMV). (2017). Testing of Autonomous Vehicles. Retrieved from https://www.dmv.ca.gov/portal/dmv/detail/vr/autonomous/testing Carrasco, M. (2011). Visual attention: The past 25 years. Vision Research, 51(13), 1484-1525. doi:http://dx.doi.org/10.1016/j.visres.2011.04.012 Corbetta, M., Akbudak, E., Conturo, T. E., Snyder, A. Z., Ollinger, J. M., Drury, H. A., . . . Shulman, G. L. (1998). A Common Network of Functional Areas for Attention and Eye Movements. Neuron, 21(4), 761-773. doi:https://doi.org/10.1016/S0896-6273(00)80593-0 de Winter, J. C. F., Happee, R., Martens, M. H., & Stanton, N. A. (2014). Effects of adaptive cruise control and highly automated driving on workload and situation awareness: A review of the empirical evidence. Transportation Research Part F: Traffic Psychology and Behaviour, 27, 196-217. doi:10.1016/j.trf.2014.06.016 Dingus, T. A., Klauer, S. G., Neale, V. L., Petersen, A., Lee, S. E., Sudweeks, J. D., . . . Gupta, S. (2006). The 100-car naturalistic driving study, Phase II-results of the 100-car field experiment. Retrieved from Endsley, M. R., & Jones, D. G. (2011). Automation and Situation Awareness (pp. 169-192): CRC Press. Engström, J., & Aust, M. L. (2011). Adaptive Behavior in the Simulator. In Fisher, D. L., Rizzo, M., Caird, J. K., & Lee, J. D. (Eds.), Handbook of driving simulation for engineering, medicine, and psychology CRC Press. Engström, J., Bärgman, J., Nilsson, D., Seppelt, B., Markkula, G., Bianchi Piccinini, G., & Victor, T. (2017). Great expectations: A predictive processing account of automobile driving. Theoretical Issues in Ergonomics Science. Engström, J., Monk, C. A., Hanowski, R. J., Horrey, W. J., Lee, J. D., McGehee, D. V., . . . Yang, C. Y. D. (2013). A conceptual framework and taxonomy for understanding and categorizing driver inattention. Retrieved from Engström, J., Victor, T., & Markkula, G. (2013). Attention selection and multitasking in everyday driving: A conceptual model. In Victor, M. T. W., Lee, J. D., & Regan, M. A. (Eds.): Ashgate Publishing, Ltd. Findlay, J. M., & Gilchrist, I. D. (2003). Active vision the psychology of looking and seeing. Flemisch, F., Heesen, M., Hesse, T., Kelsch, J., Schieben, A., & Beller, J. (2011). Towards a dynamic balance between humans and automation: authority, ability,
37
responsibility and control in shared and cooperative control situations. Cognition, Technology & Work, 14(1), 3-18. doi:10.1007/s10111-011-0191-6 Franconeri, S., & Simons, D. (2003). Moving and looming stimuli capture attention. Perception & Psychophysics, 65(7), 999-1010. doi:10.3758/BF03194829 Fuller, R. A. Y. (1984). A conceptualization of driving behaviour as threat avoidance. Ergonomics, 27(11), 1139-1155. doi:10.1080/00140138408963596 Hancock, P. A., Mouloua, M., & Senders, J. (2008). On the Philosophical Foundations of the Distracted Driver and Driving Distraction Driver Distraction: Theory, Effects, and Mitigation (pp. 11-30): CRC Press. Harry, Z., Matthew, R. H. S., & Gerald, J. W. (2008). Driving Task Demand-Based Distraction Mitigation Driver Distraction: Theory, Effects, and Mitigation (pp. 485-500): CRC Press. Hoffmann, E. R. (1968). Detection of vehicle velocity changes in car following. Hoffmann, E. R., & Mortimer, R. G. (1994). Drivers' estimates of time to collision. Accident Analysis & Prevention, 26(4), 511-520. Karlsson, J., Apoy, C., Lind, H., Dombrovskis, S., Axestål, M., & Johansson, M. (2016). EyesOnRoad - An anti-distraction Field Operational Test. Retrieved from http://www.vinnova.se/PageFiles/751290059/2013-01303_EN.pdf Kessler, C., Etemad, A., Alessandretti, G., Heinig, K., Brouwer, R., Cserpinszky, A., . . . Benmimoun, M. (2012). EuroFOT Deliverable D11. 3 - Final Report. Retrieved from http://www.eurofot-ip.eu/ Klauer, S. G., Dingus, T. A., Neale, V. L., Sudweeks, J. D., & Ramsey, D. J. (2006). The impact of driver inattention on near-crash/crash risk: An analysis using the 100-car naturalistic driving study data. Retrieved from https://vtechworks.lib.vt.edu/bitstream/handle/10919/55090/DriverInattention.p df?sequence=1 Lamble, D., Laakso, M., & Summala, H. (1999). Detection thresholds in car following situations and peripheral vision: Implications for positioning of visually demanding in-car displays. Ergonomics, 42(6), 807-815. Land, M. F. (2006). Eye movements and the control of actions in everyday life. Progress in Retinal and Eye Research, 25(3), 296-324. doi:10.1016/j.preteyeres.2006.01.002 Lee, D. N. (1976). A theory of visual control of braking based on information about time-to-collision. Perception, 5(4), 437-459. doi:10.1068/p050437 Lee, J. D. (2008). Fifty years of driving safety research. Human Factors: The Journal of the Human Factors and Ergonomics Society, 50(3), 521-528. Lee, J. D., Young, K. L., & Regan, M. A. (2008). Defining Driver Distraction Driver Distraction: Theory, Effects, and Mitigation (pp. 31-40): CRC Press. Lin, J. Y., Franconeri, S., & Enns, J. T. (2008). Objects on a Collision Path With the Observer Demand Attention. Psychological science, 19(7), 686-692. doi:10.1111/j.1467-9280.2008.02143.x Malta, L., Aust, M. L., Faber, F., Metz, B., Pierre, G. S., Benmimoun, M., & Schäfer, R. (2011). EuroFOT Deliverable 6.4 - Final results: Impacts on traffic safety. Retrieved from http://www.eurofot-ip.eu/
38
Markkula, G. (2015). Driver behavior models for evaluating automotive active safety: From neural dynamics to vehicle dynamics. (Ph.D. thesis), Chalmers University of Technology. Markkula, G., Engström, J., Lodin, J., Bärgman, J., & Victor, T. (2016). A farewell to brake reaction times? Kinematics-dependent brake response in naturalistic rear-end emergencies. Accident Analysis & Prevention, 95, Part A, 209-226. doi:http://dx.doi.org/10.1016/j.aap.2016.07.007 MIT. (2017). MIT AgeLab Tesla Study. Retrieved from http://lexfridman.com/teslastudy/ Mortimer, R. G. (1990). Perceptual factors in rear-end crashes. OECD. (1990). Behavioural adaptations to changes in the road transport system (9264133895). Retrieved from Olson, P. L., Battle, D. S., & Aoki, T. (1989). Driver eye fixations under different operating conditions. Olson, P. L., & Dewar, R. E. (2002). Perception and information processing Human factors in traffic safety (Vol. 2, pp. 13-42). Tucson: Lawyers & Judges. Rudin-Brown, C. M. (2010). 'Intelligent'in-vehicle intelligent transport systems: Limiting behavioural adaptation through adaptive design. Intelligent Transport Systems, IET, 4(4), 252-261. Rudin-Brown, C. M., & Parker, H. A. (2004). Behavioural adaptation to adaptive cruise control (ACC): implications for preventive strategies. Transportation Research Part F: Traffic Psychology and Behaviour, 7(2), 59-76. doi:10.1016/j.trf.2004.02.001 SAE. (2016). j3016 - Taxonomy and definitions for terms related to on-road motor vehicle automated driving systems: SAE International. Senders, J. W., Kristofferson, A. B., Levison, W. H., Dietrich, C. W., & Ward, J. L. (1967). The attentional demand of automobile driving. Highway Research Record(195). Seppelt, B. D., & Victor, T. W. (2016). Potential Solutions to Human Factors Challenges in Road Vehicle Automation. In Meyer, G. & Beiker, S. (Eds.), Road Vehicle Automation 3 (pp. 131-148). Cham: Springer International Publishing. Singh, S. (2015). Critical reasons for crashes investigated in the National Motor Vehicle Crash Causation Survey. Retrieved from Washington, DC: https://crashstats.nhtsa.dot.gov/Api/Public/ViewPublication/812115 Smith, E. E., & Kosslyn, S. M. (2014a). Attention Cognitive Psychology: Mind and Brain (pp. 103-146): Pearson. Smith, E. E., & Kosslyn, S. M. (2014b). Perception Cognitive Psychology: Mind and Brain (pp. 49-102): Pearson. Summala, H. (2007). Towards Understanding Motivational and Emotional Factors in Driver Behaviour: Comfort Through Satisficing. In Cacciabue, P. C. (Ed.), Modelling Driver Behaviour in Automotive Environments: Critical Issues in Driver Interactions with Intelligent Transport Systems (pp. 189-207). London: Springer London.
39
Summala, H., Lamble, D., & Laakso, M. (1998). Driving experience and perception of the lead car's braking when looking at in-car targets. Accident Analysis & Prevention, 30(4), 401-407. doi:10.1016/s0001-4575(98)00005-0 Summala, H., Nieminen, T., & Punto, M. (1996). Maintaining lane position with peripheral vision during in-vehicle tasks. Human Factors: The Journal of the Human Factors and Ergonomics Society, 38(3), 442-451. Tijerina, L., Barickman, F. S., & Mazzae, E. N. (2004). Driver eye glance behavior during car following. US DOT and NTSHA, Report Number: DOT HS, 809, 723723. Tivesten, E., & Dozza, M. (2014). Driving context and visual-manual phone tasks influence glance behavior in naturalistic driving. Transportation Research Part F: Traffic Psychology and Behaviour, 26(PA), 258-272. doi:10.1016/j.trf.2014.08.004 UMTRI. (2017). Michigan traffic crash facts – Data query tool. Retrieved from https://www.michigantrafficcrashfacts.org/querytool Victor, T., Dozza, M., Bärgman, J., Boda, C.-N., Engström, J., Flannagan, C., . . . Markkula, G. (2015). SHRP2 - Analysis of naturalistic driving study data: Safer glances, driver inattention and crash risk. Retrieved from http://www.trb.org/Publications/PubsSHRP2ResearchReportsSafety.aspx Victor, T., Engström, J., & Harbluk, J. L. (2008). Distraction Assessment Methods Based on Visual Behavior and Event Detection (pp. 135-165): CRC Press. Victor, T., Rothoff, M., Coelingh, E., Ödblom, A., & Burgdorf, K. (2017). When Autonomous Vehicles Are Introduced on a Larger Scale in the Road Transport System: The Drive Me Project. In Watzenig, D. & Horn, M. (Eds.), Automated Driving: Safer and More Efficient Future Driving (pp. 541-546). Cham: Springer International Publishing. Wickens, C. D., & Horrey, W. J. (2008). Models of Attention, Distraction, and Highway Hazard Avoidance Driver Distraction: Theory, Effects, and Mitigation (pp. 57-69): CRC Press.
40