50. 10. 60. 0-+---. Successive. Simultaneous target presentations. Figure 2. Error rates from ..... mask was drawn in black, white, and two shades of gray and was.
Perception & Psychophysics 1999,61 (3), 403-423
Visual selection mediated by location: Feature-based selection
of noncontiguous locations NARCISSE P. BICHOT and KYLE R. CAVE Vanderbilt University, NashviUe, Tennessee and HAROLDPASHLER University of California, San Diego, California Experiments using two different methods and three types of stimuli tested whether stimuli at nonadjacent locations could be selected simultaneously. In one set of experiments, subjects attended to red digits presented in multiple frames with green digits. Accuracy was no better when red digits appeared successively than when pairs of red digits occurred simultaneously, implying allocation of attention to the two locations simultaneously. Different tasks involving oriented grating stimuli produced the same result. The final experiment demonstrated split attention with an array of spatial probes. When the probe at one of two target locations was correctly reported, the probe at the other target location was more often reported correctly than were any of the probes at distractor locations, including those between the targets. Together, these experiments provide strong converging evidence that when two targets are easily discriminated from distractors by a basic property, spatial attention can be split across both locations. Visual processing generally requires that important parts of the visual input be selected and processed more thoroughly than the rest. In many circumstances, the most important visual stimulus for a particular task will occupy a single undivided region of the visual field. In these circumstances, selection can be accomplished effectively on the basis of location. In other words, all the information from one location is selected, and information from all other locations is excluded. Often, though, the important stimuli will occupy noncontiguous regions. For instance, an object may be partially occluded, or the stimulus may be made up of a configuration of objects at different locations. In these cases, selection on the basis of some other property, such as color, might be more effective. However,
This work was supported by National Institute of Mental Health Training Grant MH-14268, awarded to the Center for Human Information Processing, University of California, San Diego; by Grants NCA2225 and NCA2-414 from NASA, NOOOI4-91-J-1735 from ONR, and l-R29-MH45584-01 from NIMH, awarded to H.P.; by Grant P30EY08126 from NEl, awarded to the Vanderbilt Vision Research Center; and by Grant ROI-EY08890 from NEI awarded to Jeffrey Schall. Experiments 1-5 were performed while the second author was a fellow at the Center for Human Information Processing, University of California, San Diego. Thanks to Alann Lopes for programming and maintaining the computers used in these experiments, to Marlisa Anderson, Angelique Bruny, Christina Contino, Kristina Dowling, Nathan Long, and Vincent Wong for conducting the experiments, and to Claus Bundesen, Jeff Miller, Steve Luck, and Jeffrey Schall for very helpful comments. Correspondence concerning this article should be addressed to K. R. Cave, Department of Psychology, University of Southampton, Highfield, Southampton SOI7 IBJ, England (e-mail: kyle.r.cave@ vanderbilt.edu) .
performance with multiple frames of colored targets and distractors indicates that subjects rely on selection by location even in a task that explicitly demands selection by color (Cave & Pashler, 1995; see also Shih & Sperling, 1996). Other experiments using spatial probes (Cave & Zimmerman, 1997; Hoffman & Nelson, 1981; Hoffman, Nelson, & Houck, 1983; Kim & Cave, 1995; Tsal& Lavie, 1993; for a review, see Cave & Bichot, in press) also support the view that selection is mediated by location, even when the target is defined by a stimulus property other than location (e.g., color). If a location-based selection mechanism is to capture visual targets in complex stimuli, it must be able to select noncontiguous locations. When Posner, Snyder, and Davidson (1980) argued for a "spotlight of attention," they presented evidence that the spotlight could not be split across noncontiguous locations. In their experiment, two cues indicated locations at which a stimulus was likely to appear. The primary cue indicated the correct stimulus position for 65% of the trials, and the secondary cue was correct for 25%. They found that the secondary position showed benefit from cuing only when it was adjacent to the primary position and concluded that attention could not be allocated to two noncontiguous locations simultaneously. Posner et al.s (1980) results contrasted with those ofM. L. Shaw and P. Shaw (1977) and M. L. Shaw (1978), who presented evidence in support of the simultaneous allocation of different amounts of attention to different locations in the visual field. M. L. Shaw and P. Shaw required their subjects to discriminate a letter presented in an otherwise blank field. They found that the subjects' discrimi-
403
Copyright 1999 Psychonomic Society, Inc.
404
BICHOT, CAVE, AND PASHLER
nation accuracy at different locations was well predicted by the probability distribution of target occurrence at those locations. M. L. Shaw, using a similar experimental paradigm, extended these results to reaction time data. However, as was discussed by Posner et al., these data could also be produced by subjects' selecting only one location on each trial, with the probability of a location being selected on a given trial matching the probability of target occurrence at that location. The results of Posner et al., described above, as well as those of Jonides (1983) and Eriksen and Yeh (1985), support this alternative explanation. More recently, Castiello and Umilta (1992) used an innovative approach to demonstrate attention to noncontiguous locations in a cuing paradigm, based on the assumption that the benefits of attention will be diminished when spread over a larger area (Castiello & Umilta, 1990). They presented subjects with two box cues of different size, one on each side of fixation, marking the two potentiallocations of an upcoming stimulus. Reaction time at detecting the stimulus increased with increasing box size, which was interpreted as being evidence that subjects could simultaneously deploy two independent attentional foci in opposite visual hemifields. However, their experiments, like other cuing studies exploring this issue, leave open the possibility that subjects may attend to one location on some trials and to another location on other trials, producing mean response times that resemble a split ofattention. Castiello and Umilta argued against this strategy by presenting the response time distributions and comparing variances between different conditions. Their evidence, however, does not completely exclude the possibility ofattention to different locations on different trials, and the uncertainty that remains underscores the need for some way of demonstrating a split of spatial attention that does not rely on the cuing paradigm. A different approach comes from Heinze et al. (1994). Their subjects compared two shapes that were either at two contiguous locations or separated by another shape. Spatial attention was measured, using the PI component of event-related brain potentials to probe stimuli that appeared after the stimuli that were to be compared. They found attentional enhancement of the PI component for probes appearing at locations occupied by either of the targets to be compared and also for probes at the location in between the two targets. They concluded that the intervening region was selected along with the two targets. However, as they point out, the PI component is an indirect measure and may not reflect all aspects of spatial attention. Furthermore, their subjects may have performed the comparison task by treating both shapes as a single configuration and searching for symmetries. In considering the two targets and whatever lay between to be a single shape, they may have chosen to select the whole configuration as a single unit. Kramer and Hahn (1995) proposed another explanation for the discrepancy between the studies indicating a single attentional spotlight and those supporting split attention. They suggested that some studies may have failed
to find evidence for split attention because the stimuli in these studies were presented as sudden onsets. Under many circumstances, sudden onsets will automatically capture attention (Theeuwes, 1995; for a review, see Yantis, 1995). The attentional capture of sudden-onset distractor stimuli may make it difficult or impossible for subjects to maintain their attentional focus on previously cued locations. This interpretation is also supported by the results of single-neuron recordings in the posterior parietal cortex, which has long been associated with mechanisms of spatial attention (for a review, see Colby, 1991). During spatial cuing or spatial match-to-sample tasks, parietal neurons are more active when stimuli appear at unattended locations (Robinson, Bowman, & Kertzman, 1995; Steinmetz, Connor, Constantinidis, & McLaughlin, 1994), possibly reflecting the redirection of attention to an unattended location at which a distractor stimulus is presented as a sudden onset. To test their hypothesis, Kramer and Hahn (1995) used an experimental paradigm modeled after that of Pan and Eriksen (1993), who used response competition to show that subjects were unable to selectively ignore stimuli that were located between two cued locations. Kramer and Hahn cued (with boxes) two target locations separated by two distractor locations. The subjects determined whether the letters presented inside the two cue boxes were the same, while ignoring intervening distractor letters. In one condition, the letters were presented as sudden onsets, and in the other, they were revealed by the removal of segments of a figure-eight premask (i.e., nononset condition). As was predicted, distractor letters interfered with performance in the sudden-onset condition (as in Pan and Eriksen, 1993) but not in the nononset condition. In the present study, two different and novel approaches are used to demonstrate that attention can be split among noncontiguous regions ofvisual space. The present study differs from previous ones in several important aspects. First, previous experiments have addressed the issue of split attention by using tasks that, implicitly or explicitly, emphasize selection by location (i.e., spatial cuing paradigms), but in the present experiments, the selection of noncontiguous locations on the basis of static stimulus attributes other than location (color, orientation, and spatial frequency) is investigated. Second, the experimental paradigms and the associated measures used to assess divided attention avoid potential confounds arising from measures that are compiled across trials (as in Castiello & UmiIta, 1992; M. L. Shaw, 1978; M. L. Shaw & P. Shaw, 1977). Third, in contrast with Kramer and Hahn (1995), we find that, under some circumstances, subjects can split their attention among noncontiguous locations, even when stimuli are presented as sudden onsets. The first three experiments presented here addressed the issue by using multiple-frame presentations ofcolored target and distractor digits, similar to those used in Cave and Pashler (1995). In addition to the successive condition used in the previous experiments, in which only a single target digit appears at anyone time, the present experiments included a simultaneous condition, with two tar-
SELECTING NONCONTIGUOUS LOCATIONS
gets appearing simultaneously at different locations. These experiments are based on the logic introduced by Shiffrin and Gardner (1972): If subjects cannot select two noncontiguous locations simultaneously, then the simultaneous condition should be more difficult than the successive location. These experiments, unlike Shiffrin and Gardner's, required subjects to filter out distractors while identifying the targets. The next two experiments tested for the same type of selection, using very different stimuli and a task that did not include character identification. The sixth and last experiment readdressed the question of divided attention, using a spatial probe technique (see Kim & Cave, 1995). This method requires the combination of two tasks: (1) a primary task in which target selection occurs with associated allocation of spatial attention and (2) a secondary task in which measures ofresponses to the probes indicate how attention is allocated spatially. In one variant of this method, a single probe (e.g., a small black square) is presented at a given location, and response time to the appearance of the probe is used to assess the amount of attention allocated to the location of the probe (Cave & Zimmerman, 1997; Cepeda, Cave, Bichot, & Kim, 1998). In the other variant, different shapes (e.g., letters) are presented at multiple locations, and accuracy of discrimination ofthe shapes is used as an attentional measure (Tsal & Lavie, 1993). Kim and Cave (1995) found that these two variants lead to similar results. Both variants rely on the assumptions that the primary visual task results in a particular layout of attention across visual space and that reaction time or accuracy to probes is affected by the amount of attention at the locations at which those probes are presented. This logic is similar to that behind spatial cuing experiments (e.g., Posner et al., 1980). The spatial probe method has played an important role in demonstrating that attention is allocated to spatial 10cations even when selection is based on object properties other than location (Cave & Zimmerman, 1997; Hoffman & Nelson, 1981; Hoffman, Nelson, & Houck, 1983; Kim & Cave, 1995; Tsal & Lavie, 1993). In fact, several key experiments that have been used to demonstrate objectbased selection (Duncan, 1984; Harms & Bundesen, 1983; Vecera & Farah, 1994) have been shown, using the probe method, to have strong spatial components (Kim & Cave, 1998; Kramer, Weber, & Watson, 1997). However, one can argue that the probe technique does not really measure spatial attention but, rather, measures effects related to proximity-based object grouping (see Duncan, 1984). Some probe experiment results may be consistent with this view, but others are difficult to reconcile with a purely object-based account ofvisual selection. One particular example comes from Cave and Zimmerman's (1997) study, in which they measured the strength of the effect of spatial attention on visual processing during a letter search by calculating the difference between response times to probes presented at positions previously occupied by the target letter and those presented at a distractor letter position. They found that spatial atten-
405
tion is stronger in blocks oftrials in which the distractors are more confusable with the target, suggesting that attention is working to control featural interference between targets and distractors. More important, after extended practice, subjects were slower at responding to probes at distractor locations adjacent to the target than they were at responding to probes at other distractor locations. This observation, reminiscent of the flanking inhibition seen in the responses ofvisual neurons, is consistent with the finding that attention in visual search primarily operates by inhibiting information from distractor locations (Cepeda, Cave, Bichot, & Kim, 1998). Similar flanking inhibition has also been observed in the activity of neurons in the frontal eye field of macaques performing a visual search task (Schall, Hanes, Thompson, & King, 1995). Clearly, this pattern of attentional allocation is highly spatial in nature (i.e., nearby distractors interfere more with target detection and are, thus, more inhibited) and presents strong evidence for an important role oflocation in visual selection. The view that attention is spatial, regardless ofthe initial attributes on which selection was based, is also consistent with our current understanding ofthe neural mechanisms of visual selection. For example, recordings in both area 7a (Constantinidis & Steinmetz, 1996) and the frontal eye field (Schall, Hanes, et al., 1995) show that the activity of neurons with an oddball stimulus (e.g., a red square among green squares) in their receptive field remains elevated, whereas the activity of those neurons with a distractor in their receptive field is suppressed. Recent studies ofthe frontal eye field indicate that this area represents a spatial map of relevant objects for saccadic responses (Schall, Morel, King, & Bullier, 1995; Thompson, Hanes, Bichot, & Schall, 1996) and perhaps for covert visual selection (Thompson, Bichot, & Schall, 1997). In fact, current debates in visual neurophysiology focus more on the role of spatial selection in different areas of the ventral and dorsal visual pathways and less on whether selection is spatial (for a review, see Goodale & Milner, 1992). Taken together, all of these results provide strong evidence that the multiple-frame methods in Cave and Pashler (1995) and Kim and Cave (1995) measure changes in attention allocated to particular locations in the visual field. These methods can be particularly useful in testing whether this spatial attention can be split across multiple regions simultaneously, because they can measure attentional allocation in the course of visual searches driven by color and other simple features. The experiments presented below used both methods, coupled with search tasks designed to maximize the likelihood that subjects would process two targets simultaneously.
EXPERIMENT 1 Simultaneous Versus Successive Digits If only one location in the visual field can be selected at anyone time, two simultaneous targets appearing at
406
BICHOT, CAVE, AND PASHLER
two different locations will require that the two locations be selected serially. If the two targets are presented for only a short time interval, part ofthe interval must be devoted to identifying one target, and part will be devoted to the other. If, in a different trial, the same subject views a single target for the same time interval and then views a second target over a similar time interval, he or she will be able to identify the two targets more accurately than in the first trial, because about twice as much time will be devoted to each target. Thus, selection that is limited to one location predicts that performance should be better with two successive targets than with two simultaneous targets. In this experiment, the subjects viewed a series of eight frames, each containing two digits, one on the left and one on the right of fixation. Each frame was visible for approximately 140 msec. Halfthe subjects attended to digits that were red and ignored those that were green. At the end of the trial, they reported the highest digit among the red digits. The other half reported the highest green digit and ignored the red digits. There were two different types oftrials. In the successive trials, each frame contained one red digit and one green digit, requiring each subject to identify only one digit in each frame. In the simultaneous trials, the frames alternated between frames containing two red digits and those containing two green digits. Each subject had to identify two targets in one frame and none in the next. The two conditions were equivalent in the total number oftarget digits presented, the number of distractor digits presented, and the time available to identify each digit. Even if attention is limited to a single location at any one time, there will be no difference between successive and simultaneous performance if the digits change so quickly that the subjects are completely unable to shift attention to the targets. The similarity between this experiment and those in Cave and Pashler (1995) should have ensured that the subjects could effectively select by location under these conditions. The tasks in the two experiments were essentially identical, and the stimuli were very similar as well. The masks used between digit presentations in the earlier experiments were not necessary in the current experiment, leaving even more time to select and identify each target digit. Because the results from the earlier experiments had indicated that subjects selected target digits by location, they strongly suggested that the subjects in this experiment would also select by location. Ifthey did, then in the successive condition, they would have approximately 140 msec to select and identify each target digit. In the simultaneous condition, they would have 140 msec to select and identify two target digits. If the two target locations must be selected individually and serially, the subjects would only be able to devote half as much time to each digit in the simultaneous condition, and performance should be substantially lower than that in the successive condition. The performance difference between the two conditions was measured by
comparing the number oferrors the subjects made in identifying the highest target digit.
Method Subjects. Five students at the University of California, San Diego, participated in the green-target version of this experiment, and 5 participated in the red-target version. Of these 10,6 were fulfilling a course requirement, and 4 were paid. None knew the purpose of the experiment or the expected results beforehand. Most subjects finished in less than an hour. One ofthe red-target subjects reported afterward that she relied on a strategy of looking at one side of the display, and her data were dropped. Apparatus. The experiment was conducted using IBM PC and compatible microcomputers equipped with Paradise VGA+ graphics cards and NEC Multisync or Multisync 2a monitors. The subjects' responses were entered on the standard keyboard. Stimuli. Each trial included a series of eight frames presented successively, followed by a mask. Each frame consisted of a fixation cross at the center of the screen and two digits, one on each side of the cross. The distance from the edge ofone character to the edge of the other was 1.9 em, and each digit was 0.5 cm high and 0.5 em wide. The fixation cross was 0.5 em high and 0.3 em wide. The subject was approximately 60 em from the screen. The background was black, and the fixation cross was white. The mask at the end of each trial consisted of two "#" characters, about the same size as the digits and positioned at the same locations as those occupied by the digits in the previous frames. For the subjects attending to red, the mask characters were green, and for those attending to green, they were red. For each subject, half the trials were successive trials, with one target digit and one distractor digit in each frame. The target was always on the right side in the first frame, and the target location alternated from frame to frame. This condition was equivalent to the alternating condition from Cave and Pashler (1995). The remaining half of the trials were simultaneous trials, in which two distractors appeared in the first frame (either both red or both green, depending on the subject group), two targets appeared in the following frame, and the remaining frames alternated between distractors and targets. The sequence of displays for a single trial is illustrated in Figure 1. The distractor digits were chosen randomly from the digits 1 through 9. The highest target digit was equally likely to be 6, 7, 8, or 9. It never appeared in the first two frames but was equally likely to appear in any of the appropriate slots in the remaining six frames. The other target digits were chosen randomly with replacement from those digits that were less than the chosen highest digit for that trial. Procedure. Each trial began with the presentation of the fixation cross. This was the subject's cue to fixate on the cross and prepare for the trial. After approximately 1,000 msec, the series of eight stimulus frames appeared, each for 140 msec. In this experiment and in all that follow it, the presentation ofthe first frame was synchronized with the video refresh. The final frame was followed by the mask, which remained visible until the subject responded. At the end of the trial, the subjects reported the highest ofthe eight target digits by typing the appropriate key on the keyboard. The subjects were encouraged to take as long as they needed to respond. If the response was incorrect, a tone sounded immediately. A timed delay was added before each trial, to ensure a constant 450-msec intertrial interval. Each subject received 672 trials, presented in 14 blocks of48 trials each. Each subject began with a single block of 48 practice trials. More practice was provided if the subject requested it or if the the experimenter thought it was necessary. The subjects were encouraged to rest between blocks. Each subject alternated between
SELECTING NONCONTIGUOUS LOCATIONS
407
Task: What is the highest red digit? successive
~
+ 5
6 +
simultaneous
T
140 msec
~
~
~
+
6
+ 5
® + 7
® +
3 +
3
@
•• •
~
@
+ 7
•• •
total of 8 frames in each trial
Figure 1. The sequence of displays in a single trial from Experiment 1. Light digits represent the distractor color, and dark digits represent the target color.
blocks of successive and simultaneous trials. Approximately half of the subjects in each group (red target and green target) began with a successive block, and half began with a simultaneous block.
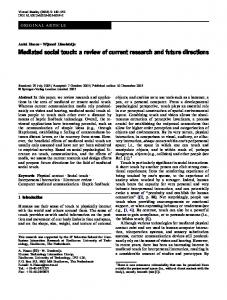
Results The error rates from the highest-digit task were generally high, ranging from 19% to 67%. They were submitted to a repeated measures analysis of variance (ANOVA), with target color (red or green) and display condition (simultaneous or successive) as factors. There was no significant difference between the error rates in the simultaneous and successive conditions (F < 1.0; see Figure 2). The subjects searching for red targets made more errors than those searching for green [F(1,7) = 8.1, P < .05], and there was no interaction between target color and display condition (F < 1.0). Discussion If subjects were only able to select one location at a time, the simultaneous condition should have been much
more difficult. Instead, subjects do just as well with simultaneous targets as they do with successive targets, suggesting that they can select two target locations at once. Subjects might be able to do this task by selecting only a single contiguous region, if they are able to select a region large enough to include both targets. They would select both locations during frames with two targets and select nothing during frames with two distractors. Experiment 2 tests whether the subjects were using such a technique.
EXPERIMENT 2 Intervening Distractors This experiment was like Experiment 1 in most respects. In Experiment 2, however, each frame included three extra distractor digits in a vertical column positioned at the center of the display. These extra distractors should have made it impossible to select the two target locations without selecting a region occupied by a dis-
408
BICHOT, CAVE, AND PASHLER
Successive VS. Simultaneous Targets with no Center Distractors 60
9 subjects
50
10
0-+--Successive Simultaneous target presentations Figure 2. Error rates from Experiment 1. Searches for red and green targets are combined. Error bars are calculated by using the procedure described in Cave and Pashler (1995).
tractor. The extra distractors also made the task generally more difficult, making longer exposure times necessary.
Method Subjects. Seven subjects participated in the green-target version of this experiment, and 6 participated in the red-target version. Three were fulfilling a course requirement, 9 were paid, and I was a volunteer. None knew the purpose of the experiment or the expected results beforehand, and none had participated in Experiment 1. Most subjects finished in less than an hour. One of the green-target subjects misunderstood the instructions, and her data were dropped from the analysis. Apparatus. This experiment was conducted with the same equipment as that used in Experiment I. Stimuli. Each trial included a series of eight frames, just as in Experiment I (see Figure 3). In each frame, the fixation cross was replaced with a vertical column ofthree distractor digits. For subjects attending to red, these digits were green, and for subjects attending to green, they were red. The digits in this column were approximately 0.2 ern apart, edge to edge. These three digits changed with each new frame, as did the other two digits in the display. The mask at the end of each sequence included five "#" characters, one at each location that had been occupied by digits. Procedure. The procedure was also similar to that of Experiment I, with one difference. Because the extra distractors made the task more difficult, a longer exposure time was required. In order to ensure that the task was challenging for all the subjects without being too challenging for any subject, the exposure time was adjusted according to each subject's performance. Each subject began with 4 blocks of24 practice trials each. After every other block, the exposure time was adjusted according to the error rate for that block. If the error rate was greater than 35%, the exposure time increased by 15 msec. If the error rate was below 25%, the exposure dropped by 15 msec. At the end of the practice blocks, most subjects had an exposure time of 180 msec. The adjustment procedure con-
tinued through the 14 blocks of regular trials, each with 48 trials. The average exposure time for the regular trials across all 12 subjects was 191 msec.
Results The error rates from the highest-digit task were submitted to the same type of ANOVA as that used in Experiment 1. As before, there was no significant difference between the error rates in the simultaneous and successive conditions (F < 1.0; see Figure 4). In this case, there was no significant difference between the subjects searching for red and those searching for green (F < 1.0), and there was no interaction between target color and display condition (F < 1.0). Discussion The number of distractors and their placement in this experiment made it virtually impossible to select a single contiguous region that included both target positions and none of the distractor positions. Nevertheless, the subjects identified the targets just as accurately when they appeared simultaneously as when they appeared successively. If subjects are selecting the target locations in this task, as the results from Cave and Pashler (1995) suggest, they appear to be selecting two noncontiguous regions of the visual field. The attentional blink described by Broadbent and Broadbent (1987) and by Raymond, Shapiro, and Arnell (1992) could exert an important effect in these experiments by making it more difficult to detect a target that appears within a certain interval after another target. If
SELECTING NONCONTIGUOUS LOCATIONS
409
Task: What is the highest red digit? successive
~
6
® 71 5
simultaneous
~
® 71
~
~
~ ~
~ ~
~
6
®
®
•• •
•• •
~
5
total of 8 frames in each trial Figure 3. The sequence of displays in a single trial from Experiment 2.
the inhibition in the attentional blink is specific to the location ofthe first target, its effect will be the same in the simultaneous and successive conditions, because the time interval between targets at anyone location is the same in both conditions. If the inhibition applies to all stimuli, regardless oflocation, the effects ofthe attentional blink depend on its time course. Depending on the timing of the display sequence and ofthe inhibition, one condition or the other may have more targets appearing during the time that the inhibition is strong. Although Experiment 3 was designed to address other questions, it will make it easier to assess the effect of an attentional blink.
EXPERIMENT 3 Ruling Out Alternatives We performed one additional test comparing simultaneous and successive presentations with the highestdigit task. In this test, the conditions were more similar to those used in the experiments described in Cave and Pashler (1995), so we can be more certain that the selection by location demonstrated in that study occurred in this test as well. Only two frames ofdigits were presented, and each frame was preceded and followed by a mask.
Method Subjects. Ten students at the University of California, San Diego, participated in the green-target version of this experiment,
and 10 participated in the red-target version. All were fulfilling a course requirement. None knew the purpose of the experiment or the expected results beforehand. Most subjects finished in less than an hour. Apparatus. The experiment was conducted using IBM PC and compatible microcomputers equipped with NEC Multisync or Multisync 2a monitors. Stimuli. In each trial, two frames of digits were presented. Each frame was organized similarly to those in the previous experiment, with one digit on either side of the display and a column of three distractor digits in the center. Half the trials were successive, and half were simultaneous, as before. In the successive trials, the first target was on the left side in half the trials, and on the right in half. In the simultaneous trials, the two targets appeared in the first frame on half the trials, and in the second frame on half. All the different trial types were randomly intermixed. This experiment used a different method of selecting the digits for each trial, so that the distribution of distractors would not provide clues to the identity of the highest target digit. All the digits, targets and distractors, were chosen randomly from the digits 1 through 9. The only constraint was that the digit 9 could not appear as a target in the first frame, because if it did, the subject would not need to examine the second frame. The digits were 2.3 em high and I em wide, the same size as those in Cave and Pashler (1995) and larger than those in the experiments described above. The distance from the edge ofone character to the edge ofanother was 2.1 em, slightly longer than that in Cave and Pashler. The background was white, and the fixation cross was black. Each digit frame was displayed for 100 msec. A mask frame appeared before the first digit frame, between the two digit frames, and after the second digit frame. Each mask frame was displayed for 50 msec. The mask consisted of five black "#" charac-
410
BICHOT, CAVE, AND PASHLER
Successive vs. Simultaneous Targets with Center Distractors 12 subjects
60
50
10
0+--Successive Simultaneous target presentations Figure 4. Error rates from Experiment 2. Searches for red and green targets are combined. ters, about the same size as the digits and positioned at the same locations as those occupied by the digits. Procedure. Each subject began with I block of 48 practice trials, and then continued through 14 blocks of regular trials, each with 48 trials. Each trial began with a fixation cross for 1,000 rnsec, followed by a blank screen for 500 msec. After synchronizing with the video refresh, the sequence of three mask frames and two digit frames began. After the final mask disappeared, the subject responded as in the earlier experiments. Erroneous responses were indicated by a tone, as before.
Results The error rates from the highest-digit task were submitted to an ANOVA similar to those used in Experiments 1 and 2. Errors were actually slightly lower in the simultaneous condition than in the successive condition, although the difference was not significant [F( 1,18) = 1.95,p> .17; see Figure 5]. There was no difference between the red-target and the green-target subjects (F < 1.0) and no interaction (F < 1.0).
Discussion The results from this experiment mirror those from Experiments 1 and 2. If only a single contiguous region were selected at anyone time, we would expect more errors when targets appear simultaneously. Instead, subjects make no more errors in the simultaneous condition than in the successive condition. If anything, they make slightly fewer. They are apparently able to select two noncontiguous regions in this task very effectively. This experiment makes it easier to rule out any effects from attentional blinking, because there were only two frames with digits, and they were relatively fast. Ifthe in-
hibition from attentional blinking is location specific, its effect should be the same in simultaneous and successive conditions. If it is not location specific, the timing of the attentional blink has to be delayed enough that it does not affect a simultaneous target, but not delayed so much that it misses the successive target. Even if the timing is just right, it should only interfere with the second target in the successive condition, because it is the only target that appears after another target. Thus, there is some possibility that an attentional blink could raise the error rate in the successive condition and thereby obscure what would otherwise be a successive advantage. If the effect occurs at all, however, it should be relatively small, because it would occur in only about half of the successive trials. Experiment 3 also prevented an alternative strategy that may have been open to subjects in the previous experiments. Subjects could attend to just the targets on one side of a display and, with perfect performance, report the correct target on 50% of the trials.' They could improve that performance by using the distribution of distractors to predict the target. In Experiment 3, the distribution of distractors gave no clues to the target. Furthermore, subjects attending to only one side could not have achieved error rates as low as those in this experiment. If only a single location could be selected, we would still expect no advantage for successive over simultaneous presentation if each frame were visible for such a long time that two targets could easily be selected and identified serially. If subjects had been able to select so effectively in these three experiments, however, their error rates should have been much lower. In Experiments I and 2, the high error rates might be explained by assuming that
SELECTING NONCONTIGUOUS LOCATIONS
411
Successive vs. Simultaneous Targets Two Frames 20 subjects
60 50
10
0+--...........- Successive Simultaneous target locations Figure 5. Error rates from Experiment 3.
the subjects did not compare digits as they were presented but, rather, saved as many as possible in short-term memory and compared them after the presentation was finished. In this case, the high error rates would have been due to digits having been lost from short-term memory. In Experiment 3, however, there were so few digits in each display that they could all easily have been maintained in short-term memory, yet the subjects still made a number of errors. Instead, the errors indicate that selection of digits in this task is not easy. The experiments described above and all those in Cave and Pashler (1995) used a task that required the identification of characters. If the selection mechanism measured in these tasks is general in nature, it should produce similar results with other tasks that require visual selection. The next two experiments tested for selection by location, using a very different task involving abstract shapes and orientation detection.
Each grating appeared at one of four orientations. Before the experiment, we presented examples of the four gratings, each labeled with a number between 1 and 4, as is shown in Figure 6. In each trial, we asked the subjects to report the target grating associated with the highest number. We pointed out that they could think ofthe task as looking for the patch that required the least amount of clockwise rotation to be vertical. With some practice, the subjects performed well at this task. This experiment included three different conditions, which allowed a comparison between same and alternating conditions, as in Cave and Pashler (1995), and also a comparison between successive and simultaneous, as in Experiments 1-3 above. Because ofthe difficulty in viewing the gratings peripherally, a column of center distractors was not used. In most other respects, this experiment was similar to the earlier experiments.
Method EXPERIMENT 4 Selection With Color and Orientation In this task, subjects once again used color to distinguish targets from distractors. However, the shapes they identified were not characters, but circular patches of square wave gratings. In the previous experiments, the highest-digit task required subjects to identify every shape in the series without having to remember everyone. This experiment required an analogous task that could be performed with these square wave gratings. We chose a task that required subjects to identify the orientation of every target grating and to compare it with the others.
Subjects. Twelve subjects participated in the green-target version of this experiment, and 12 participated in the red-target version. Most were fulfilling a course requirement. None knew the purpose ofthe experiment or the expected results beforehand. Most subjects finished in less than an hour. Apparatus. This experiment was conducted with the same equipment as that used in the previous experiments. Stimuli. In each trial, the subject viewed two frames, each with two gratings, one on each side ofa fixation cross. The gratings were circular patches 4 em in diameter, and they were 1.5 em apart, edge to edge. They were either green and black or red and black and appeared on a black background. The fixation cross between them was white. Half the subjects attended to red gratings and ignored green gratings, whereas half attended to green and ignored red. There were three conditions, as is shown in Figure 7. In the same
412
BICHOT, CAVE, AND PASHLER
Figure 6. Examples of the gratings used in Experiment 4.
condition, each frame had one grating of the target color and one of the distractor color, and both target color gratings appeared at the same location. In the alternating successive condition, each frame had one target and one distractor, and the two targets appeared in different positions. In both of these conditions, the first target appeared on the left side in halfthe trials, and on the right in the other half. In the simultaneous condition, the two targets appeared together in one frame, and two distractors appeared in the other. The targets were in the first frame in half the trials, and in the second frame in the other half. In this experiment a different method was used to choose the stimuli for each trial. The method used in Experiment 3 made it impossible to infer the highest digit from the distribution of the other
digits, but the correct response was a high digit, such as 8 or 9, much more often than it was a low digit, such as 1 or 2. In Experiment 4, each ofthe target stimuli was still chosen independently, as in Experiment 3, but the probabilities that each orientation would appear in anyone slot in the sequence were adjusted so that each of the four orientations was equally likely to be the "highest" orientation. Orientation I appeared in each target color slot with a probability of .5. Thus, the probability that both targets would be Orientation I was .25. Orientation 2 appeared with a probability of.2071, Orientation 3 with a probability of .1589, and Orientation 4 with a probability of.1340. With these values, the probability for each of the four orientations being the highest orientation in a single sequence was .25, making each of the four correct responses equally likely.
Same location
Frame 1
Frame 2
Alternating location simultaneous
Alternating location successive
Frame 1
+
Frame 2
Figure 7. Examples of the stimulus patterns for the three conditions of Experiment 4. Black gratings indicate green, and gray gratings indicate red.
SELECTING NONCONTIGUOUS LOCATIONS
413
Comparison of Grating Orientations Selection by Color 60
20 subjects
50
10
o same
alternating successive target locations
alternating simultaneous
Figure 8. Error rates for aU three conditions in Experiment 4.
If the vertical orientation (the highest) would have appeared in the first frame, it was moved to the second. For consistency, the vertical orientation was also moved if it appeared in the left position of a simultaneous trial, so that the three conditions would not vary in the number of trials in which the random sequence was altered. For the nontarget-color stimuli, each orientation occurred at each slot in the sequence with a probability of .25. As in Experiment 3, a mask frame appeared before the first stimulus frame, between the two stimulus frames, and after the second stimulus frame. Each mask frame consisted of two circular display elements positioned as were those in the stimulus frames. Each mask was drawn in black, white, and two shades of gray and was constructed by superimposing a vertical grating and two diagonal gratings, each with the same size and spatial frequency as the stimulus gratings. Procedure. As in the previous experiment, the exposure time for the stimulus frames was adjusted according to each subject's error rate. The adjustment occurred after each block of 36 trials. If the subject's error rate for that block was greater than 35%, the exposure time increased by 15 msec for each stimulus frame. If the error rate was less than 25%, the exposure time decreased by 15 msec. The adjustment procedure began during the practice trials. Each subject first viewed a small number of trials (usually 10 or 20) in which each stimulus frame was visible for 500 msec, so that they understood the nature of the stimuli. They were then given three blocks of36 practice trials each, usually starting with an exposure time of 150 msec, and the exposure was adjusted after each block. Most subjects began the regular trials with exposure times of between 150 and 180 msec for each stimulus frame, and all began the regular trials with exposures of between 120 and 195 msec. The average exposure time across all trials was 152 msec, and the maximum exposure time was 255 msec. The mask frames were visible for a constant 50 msec in all the trials. The trials were separated by an interval of at least 1,800 msec. Generally, the exposure time for each frame was too fast to allow a saccade. Also, the instructions stressed the importance of maintaining fixation on the cross, as in the previous experiments. After this experiment, the subjects were asked if they moved their eyes
during trials. Four subjects (two red, two green) reported that they did move their eyes or suspected that they might have. Their data were removed from the analysis. With those subjects excluded, the mean exposure time was 155 msec, and the maximum exposure time was still 255 msec. When the subject responded incorrectly, a tone sounded, and the grating associated with the correct response for that trial was displayed in the upper part of the display for 500 msec. A timed delay was added before each trial to ensure a constant 1,800-msec intertrial interval. Each subject received 3 blocks of 36 practice trials, followed by 12 blocks of36 trials.
Results The error rates were subjected to a repeated measures ANOVA, with target color and display condition (same, alternating successive, or simultaneous) as factors. The means for the three conditions are shown in Figure 8. These three conditions allow two different comparisons, addressing two different questions about visual selection. First, a comparison between same and alternating successive conditions tested whether selection of the target gratings was mediated by location. This test is the same as that used in Cave and Pashler (1995). A planned contrast showed that fewer errors occurred in the same condition, in which both targets appeared at the same location [F(l,36) = 64.7,p < .001]. The subjects apparently relied on selection by location in this task, just as they did when selecting digits. The second comparison, between alternating successive and simultaneous conditions, tests whether subjects can select both locations simultaneously. Clearly, the subjects had no more trouble with simultaneous targets than with successive targets. In fact, they actually made almost 7%fewer errors in the simultaneous condition, and a con-
414
BICHOT, CAVE, AND PASHLER
trast showed this difference to be significant [F(1,36) = 9.5,p < .01]. There was no difference between the error rates for the subjects attending to green and those attending to red (F < 1) and no interaction between attended color and display condition (F < 1). . The analysis was repeated, including the subjects who reported saccades. The results were essentially the same. There were fewer errors in the same condition than in the alternating successive condition [F(1,44) = 64.8, p < .001), and there were more errors in the alternating successive condition than in the simultaneous condition [F(I ,44) = 6.4, P < .05]. Neither the attended colornor its interaction with display condition was significant (F < 1, in both cases). Discussion This experiment showed that selection by location is not limited to symbols, confusing characters, or complex shapes. In this case, subjects had to identify one simple feature, orientation, after first identifying targets by another simple feature, color. In order to select by color, the subjects apparently first determined the location and then selected that location, just as they did in Cave and Pashler (1995). The fact that accuracy was higher in the same condition in this experiment and in Cave and Pashler (1995) also helps to rule out an alternative explanation for Experiments 1-3 above. As discussed above, the data from those experiments could be explained by a single unitary spotlight if the simultaneous display times had allowed subjects enough time to select both targets fully and to identify them at their peak level of accuracy. Under this explanation, the errors in these experiments were due to nonattentional factors. Experiment 4, however, showed that subjects are not at their peak performance in identifying targets in the simultaneous condition. When both targets are at the same location, they can be selected more effectively and identified more accurately. Thus, we can safely assume that the experiments were attentionally demanding and that any attentional advantage for the successive condition would have appeared in the data. The second test in this experiment produced an unexpected result. A lower error rate in the alternating successive condition than in the simultaneous condition would have indicated that subjects could not select two locations simultaneously, and equal error rates in both conditions would have indicated that simultaneous selection was possible. Instead, the error rate was higher in the alternating successive condition. A similar trend appeared in Experiment 3, although the difference in that case was not significant. The simultaneous condition differs from the other two in that the first frame provides enough information to determine just what to expect in the second frame. Subjects do not know at the beginning ofeach trial which type it will be or where the targets will be located. If the first frame contains one target and one distractor, they can deduce that
the second frame will also have one target and one distractor, but they cannot know where the target will appear. If the first frame contains two targets or two distractors, they can deduce that the trial is from the simultaneous condition. Ifthe first frame has targets, they will know that the second frame has only distractors, but this information is probably of little help. If the first frame contains distractors, they can expect two targets in the second frame. Perhaps subjects can use this information to prepare in a way that makes it easier to identify the two target orientations. The data from the simultaneous condition support this interpretation. If the two simultaneous targets appeared in the first frame, the error rate was 32.6%. With no chance to prepare for the targets, performance was similar to the successive condition rate of 34.7%. If the two simultaneous targets appeared in the second frame, the error rate dropped to 23.6%. With relatively short notice, subjects were able to prepare for the two targets and to identify their orientations more accurately. Similar preparation may have occurred in Experiment 3, although the effect there was not as strong. With two simultaneous targets in the second frame, the error rate was 15.2%, and with two targets in the first frame, it was 11.6%. Perhaps the absence of a same condition made it possible to prepare for a second target in the successive condition as well. The effect did not appear in the simultaneous/successive comparisons in Experiments 1 and 2 because target positions were equally predictable in most frames for both conditions. In those experiments, each trial included eight stimulus frames. The first frame indicated when and where all the targets in the remaining seven frames would appear. The simultaneous advantage might also be attributed to attentional blinking, as was described earlier. However, an attentional blink would predict that simultaneous error rates would be lower than successive, regardless of whether the targets appeared in the first or the second frame. Because the simultaneous advantage is almost entirely in the trials with second-frame targets, the preparation explanation seems much more plausible than an attentional blink. The advantage from preparation in the simultaneous condition might mask what would otherwise be a simultaneous disadvantage, indicating selection of one location at a time. That possibility can be ruled out by comparing simultaneous error rates with targets in the first frame, when preparation was not possible, with successive error rates. As was described above, the subjects still did just as well with these simultaneous targets as with the successive trials, suggesting once again that two locations could be selected simultaneously. There could have been an attentional blink that masked a successive advantage, but the effect of the blink would have had to precisely cancel out the successive advantage in both Experiment 3 and Experiment 4. Given the large differences between these experiments, such a coincidence seems unlikely.
SELECTING NONCONTIGUOUS LOCATIONS
415
Same location
Frame 1
Frame 2
Alternating location successive
Alternating location simultaneous
.•
Frame 1
8·®
Frame 2
~
8·. ~.~
Figure 9. Examples ofthe stimulus patterns for the three conditions of Experiment 5.
EXPERIMENT 5 Selection With Spatial Frequency and Orientation All the experiments presented so far used color as the cue for selection. Experiment 5 tested whether selection operates in the same fashion when it is directed by another visual property. In this experiment, the stimuli were composed of gratings similar to those in Experiment 4, and targets were indicated by the spatial frequency ofthe gratings.
Method Subjects. Ten subjects participated in the low spatial frequency version of this experiment, and II participated in the high spatial frequency version. An were fulfilling a course requirement. None knew the purpose of the experiment or the expected results beforehand. Most subjects finished in less than an hour. Apparatus. This experiment was conducted with the same equipment as that used in the previous experiments. Stimuli. The stimuli were black and white square-wave gratings on a black background, positioned as were the gratings in Experi-
ment 4. Each grating had one of two spatial frequencies, as is shown in Figure 9. One group of subjects attended to gratings with the low spatial frequency (approximately 1 cycle/deg), and another group attended to those with the high (approximately 2 cycles/deg). This experiment had the same three stimulus conditions (same, alternating successive, or simultaneous) as those in Experiment 4. The mask and an other aspects of these stimuli were also the same as those in Experiment 4. Procedure. The procedure in this experiment, including the adjustment of exposure times, was identical to that in Experiment 4. One subject reported making saccades, when questioned after the experiment. Another subject made a large number of errors in the first two blocks and reported having difficulty seeing the targets, and a 3rd subject began the experiment with the wrong exposure time. An 3 were dropped from this analysis. Two of the excluded subjects attended to the high spatial frequency, and I attended to the low. For the remaining subjects, the mean exposure time across an the trials (excluding practice) was 171 msec/frame, and the maximum exposure time was 255 msec/frame.
Results The error rates were subjected to a repeated measures ANOVA, with target spatial frequency and display con-
416
BICHOT, CAVE, AND PASHLER
Comparison of Grating Orientations Selection by Spatial Frequency 60
18 subjects
50
10
o same
alternating successive
alternating simultaneous
target locations Figure 10. Error rates for aUthree conditions in Experiment 5.
dition (same, alternating successive, or simultaneous) as factors. The means for the three conditions are shown in Figure 10. A planned contrast showed that fewer errors occurred in the same condition than in the alternating successive condition [F(I,32) = 25.0,p < .001]. As before, the subjects used selection by location in this task. The second comparison, between alternating successive and simultaneous conditions, did not approach significance in this experiment (F < 1). Unlike Experiment 4, performance appeared to be equal for the successive and simultaneous conditions. There was no difference between the subjects attending to high or low spatial frequencies (F < 1) and no significant interaction between spatial frequency and display condition [F(I,32) = 2.0, p> .1]. In Experiment 4, there were fewer errors in the simultaneous condition if the targets appeared in the second frame, presumably because of the predictability of target locations. If that predictability led to fewer errors in Experiment 5, it might have masked a difference between the simultaneous and successive conditions that would indicate serial selection ofthe targets. Therefore, we examined the simultaneous error rates separately for trials with targets in the first frame or the second frame and found that there were fewer errors when the targets were in the second frame (27.4% vs. 35.8%). However, the error rate for the simultaneous trials with first frame targets was not significantly higher than that for the successive condition [32.0%; F(l,I6) = 2.I,p > .1]. Although this analysis does not completely rule out the possibility that there is a slight advantage for the successive over the si-
multaneous condition when selecting by spatial frequency, it does make it seem unlikely. The basic analysis was repeated, including the 3 subjects who were excluded. The results were the same. There were fewer errors in the same condition than in the alternating successive condition [F(I,38) = 34.3, p < .001], and there was no hint of a difference between alternating successive and simultaneous conditions (F < 1). The attended spatial frequency had no effect (F < 1), and there was no interaction between spatial frequency and display condition [F(I,38) = 2.3,p > .1].
Discussion When targets are indicated by spatial frequency, the results are similar to those found when the targets are indicated by color. Selection by spatial frequency is apparently mediated by location in this task. Because performance is just as good with simultaneous or successive targets, we conclude that subjects can select two locations simultaneously, as they did in the earlier tasks with color targets. There is some hint of a slight advantage for successive targets that could be coincidentally balanced by an advantage that is due to target predictability, but there is really no evidence that the two target locations are selected serially, one after the other. EXPERIMENT 6 Spatial Probes The final experiment used a very different paradigm, similar to that used in previous spatial selection studies,
SELECTING NONCONTIGUOUS LOCATIONS
I
• DO
o • D
OD
o
mm
ml •
~m
0 0
(® G)
Fixation 1250 ms
SOA 105 ms
Probe Duration 60ms
, ,
, , , • , , ,
Mask 250ms
Figure 11. The sequence of displays in a single trial from Experiment 6. Light shapes represent the distractor color, and dark shapes represent the target color.
in which attentional allocation was measured with a combination of two tasks (Cave & Zimmerman, 1997; Hoffman & Nelson, 1981; Hoffman et al., 1983; Kim & Cave, 1995; Tsal & Lavie, 1993). In Experiment6, the primary task was to compare two shapes with a target color while ignoring shapes with a distractor color. This task was designed to encourage the subjects to attend to the two targets simultaneously without attending to other display locations. A short time after the primary stimulus appeared, probe letters were presented at all stimulus locations, and accuracy at detecting these probes was used to indicate the amount of attention allocated at each location. This technique has an important advantage over previous techniques that relied on measures compiled over trials to demonstrate split attention (e.g.,
417
M. L. Shaw, 1978; M. L. Shaw & P. Shaw, 1977). As was discussed by Posner et al. (1980), among others, the interpretability of such results is undermined by the possibility that subjects may be attending to one location on some trials and to another location on other trials, producing mean response times or accuracy measures that resemble a split of attention. With the probe technique used in this experiment, attentional allocation at all stimulus locations was measured on individual trials.
Method Subjects. Fifty-six students at Vanderbilt University participated in this experiment. All were fulfilling psychology course requirements. None knew the purpose of the experiment beforehand. All the subjects reported normal or corrected-to-normal vision, including normal color perception. All the subjects finished in less than an hour. Twenty-nine searched for green targets among red distractors, and 27 searched for red among green. Apparatus. The experiment was conducted on three Macintosh IIsi computers with 13-in. AppleColor (Trinitron) monitors. The subjects responded via the Macintosh mouse. Stimuli. The sequence of displays in this experiment is shown in Figure II. Distance from the subject to the screen was approximately 58 cm. The background was white. Each trial began with the presentation of a central fixation cross that the subjects were instructed to fixate during the entire duration of the trial. The instructions explicitly warned against eye movements. After a delay of 1,250 msec, the primary stimulus display was presented. Each primary stimulus contained a circular array of eight shapes, two of which were of the target color and the remaining six ofthe distractor color. The stimuli were equally spaced on an imaginary circle with a radius of 6.10 visual angle around the fixation cross. To avoid potential confounds associated with having stimuli on horizontal or vertical midlines, all the stimuli were placed so that each stimulus was 22.5 0 off a horizontal or vertical midline. The primary stimulus shapes were either unfilled circles (2.1 0 visual angle diameter) or unfilled squares (2.1 0 visual angle across). In half the trials, the two target shapes were the same (and of these trials, half had two circles and half had two squares); in the other half of the trials, the two target shapes were different (one was a square and the other a circle). Each distractor shape was chosen randomly. In each trial, the two targets could be either adjacent to one another or separated by one, two, or three distractors. All four target separations were equally likely to occur, and across trials the two targets were presented at all possible locations on the imaginary circle. The target separations, as well as the target positions, were selected randomly across trials so that the subjects could not anticipate a particular display configuration. The primary task was to determine whether the two target shapes were the same or not. After a fixed stimulus onset asynchrony (SOA) of 105 msec, eight black letters were presented, each centered within one of the primary stimuli. We used only one SOA, because a previous experiment by Kim and Cave (1995), using a task similar to the one in this experiment, showed no significant differences in attentional allocation across SOAs of 75, 105, and 135 msec. The letters were chosen randomly from all possible consonants, and no two letters were the same. Each letter subtended a visual angle of 0.6 0 vertically and OAo horizontally. The secondary (probe) task was to report as many of the letters as possible. On the basis of previous research (Kim & Cave, 1995; Tsal & Lavie, 1993), we expected allocation of attention at a specific location to facilitate the detection of a letter appearing at that location, relative to other locations. Both primary stimuli and letters were removed after 60 msec, simultaneous with the presentation of masking stimuli consisting of a pound (#) sign (same size as the letters) at each of the locations previously occu-
418
BICHOT, CAVE, AND PASHLER
90
u ~
-e o(,)
85
C
II)
8?
80
75
o
1
2
3
Number of intervening distractors Figure 12. Percentages of correct responses in the primary task for different configurations of target positions.
pied by the letters. Masking stimuli were used to prevent further processing of the letters from iconic memory after their removal. Furthermore, on the basis of research with humans (see Carpenter, 1988, for a review) as well as nonhuman primates (Bichot, Schall, & Thompson, 1996; Thompson et aI., 1996), a total duration of 165 msec for the presentation oftask-relevant stimuli rules out potential confounds from saccadic eye movements. After a 250-msec delay, a display containing all possible letters appeared and, using a mouse, the subjects selected the letters they had seen. They were encouraged to report letters even if they were not certain of their presence and were told that the speed of responses did not matter. After this response, a question display appeared, asking whether the two target shapes were the same. Again, the importance of accuracy over speed was emphasized. Furthermore, the subjects were instructed at the beginning of the experiment that their most important task was to accurately determine the match (or the lack of it) between the two target shapes.
Results The subjects responded correctly to the primary (i.e., shape match) task in 80% of the trials. On the average, they reported 3.04 letters per trial in the secondary task, and, of those, 1.65 per trial were correct. Trials in which the subjects made an error on the primary task were not included in the probe accuracy analyses. Two subjects who searched for green targets did not contribute enough data to all of the analysis conditions and were removed from all subsequent analyses. In all ANOVAs, for both primary and probe tasks, the color of the targets and whether the target shapes were the same were included as factors. No effects involving the color of the targets were significant in any of these analyses. Effects involving the match of the target shapes were rarely significant, and, in those few cases in which they were, they indicated that there were more correct reports when target shapes matched. Primary task. The data on accuracy in the primary task were submitted to a repeated measures ANOVA, with number ofdistractors intervening between targets as a factor (see Figure 12). A planned contrast showed that the subjects were more accurate at determining whether the
two target shapes were the same when the two targets were adjacent than they were when distractors intervened between them [F(I,156) = 6.49,p = .012]. A planned linear trend analysis revealed no effect ofthe number of intervening distractors (I, 2, or 3) on accuracy [F(I,156) < 1.0]. These results show that there is a cost in accuracy associated with the presence of distractors between the targets but that this cost does not increase with the number of intervening distractors. Furthermore, the lack of an effect on accuracy of increasing separation between nonadjacent target locations is not, at first glance, consistent with potential effects related to target positions crossing midlines (Downing & Pinker, 1985; Hughes & Zimba, 1985, 1987; Rizzolatti, Riggio, Dascola, & Umilta, 1987). However, it is possible that part or all of the benefit on accuracy observed when targets were adjacent may be accounted for by the fact that this in the only display configuration in which the two targets could both appear in the same quadrant (on half of the trials in this condition). To address this possibility, we compared accuracy in the primary task in trials in which adjacent target locations were in the same quadrant and in trials in which they were in different quadrants. A repeated measures ANOVA revealed no significant differences [F(I ,52) < 1.0]. Similarly, in trials with two distractors between targets, accuracy did not vary between trials in which target locations crossed one midline and those in which it crossed two [F(I,52) < 1.0]. The lack of midline effects in this experiment is consistent with the results of a recent study that used a similar spatial probe technique and a similar search for color targets (Cepeda et aI., 1998). Secondary (probe) task. To determine whether attention was allocated spatially, probe detection accuracy was submitted to a repeated measures ANOVA, with probe position and number of intervening distractors as factors (see Figure 13). The three possible probe positions were a target location, a distractor location adjacent to a target location, and a distractor location that was not adjacent to a target location. The analysis revealed a significant main effect of probe position [F(2,104) = 190.18, p < .001], and a planned contrast showed that probes at target locations were more likely to be reported than probes at any distractorlocations [F(I,104) = 379.61,p < .001]. The probes at distractor locations adjacent to the targets were reported somewhat more often than those at the other distractor locations, but a planned contrast was not significant [F(1, 104) < 1.0]. These results indicate that attention was preferentially allocated to target locations over distractor locations, without much spread to nearby distractor locations. There was also a significant interaction between probe position and number ofintervening distractors [F( 6,312) = 9.56,p < .001]. A planned contrast compared the difference in probe accuracy at target and distractor locations when the two targets were adjacent and when they were separated by distractors. This contrast was significant
SELECTING NONCONTIGUOUS LOCATIONS
•
50
ts
.!
-e 0
Co)
419
Target Adjacent
II Distractor II Other
40
Distractor
30
C
CD
20
CD
a..
10 0
o
123
Number of Intervening dlstractors Figure 13. OveraU percentages of correct responses in the probe task, reflecting differences in the selection of each location depending on the typaof stimulus present there.
[F(l,312) = 1443.98,p < .001], showing that the spatial attention effect (the difference between target and distractor accuracy) was smaller when the two targets were adjacent. Furthermore, a linear trend analysis revealed an increasing spatial attention effect with increasing number of distractors intervening between the two targets [F(1,312) = 12.80,p < .001]. The most important part of the probe accuracy analysis was aimed at determining whether subjects could attend to both target locations simultaneously. We examined the data separately for each of the four target separations. Whenever a probe at a target location was reported correctly, we calculated the probability, in the same trial, of reporting the probes at the other seven locations with respect to that target location.? These data are shown in Figure 14. For each target separation, we submitted this conditional probability measure to a repeated measures ANOVA with probe distance from the reported target probe as a factor. This main factor was significant in all four of the target separations [adjacent targets, F(6,312) = 36.45,p < .001; one intervening distractor, F( 6,312) = 26.56, p < .001; two intervening distractors, F(6,312) = 54.66,p < .001; targets diametrically opposite,F(6,312) = 41.l8,p < .001]. Planned contrasts for each target separation showed that the probability of reporting the probe at the other target location was greater than the probability of reporting probes at the distractor locations [adjacent targets, F(l,312) = 215.49,p < .001; one intervening distractor, F(l ,312) = 152.11, p < .001; two intervening distractors, F(l,312) = 325.84,p < .001; targets diametrically opposite, F(l,312) = 244.93,p < .001]. We also examined the conditional probabilities with an ANOVA including all four target separations. This analysis simply compared the other target location against a combination of all the distractor locations. It revealed that probes for the other target location were reported more
often than distractor location probes, consistent with the analyses described above [F(1,52) = 92.64, p < .001]. However, there was also a significant interaction between probe location and target separation [F(3,156) = 3.60, p < .05]. For some reason, the attentional effect was greatest when there were two distractors between the targets. Finally, to determine whether a single attentional window covered both targets and the region between them, we compared the probability ofreporting the probes at intervening distractor locations with that ofprobes at other distractor locations. This analysis could only be conducted in cases in which one or two distractors intervened between the targets. In both cases, the probability ofreporting the probes at intervening distractor locations was not significantly different than the probability of reporting the probes at other distractor locations [one intervening distractor, F( 1,312) < 1.0; two intervening distractors, F(1,3l2) < 1.0]. Overall, these results suggest that both target locations can be attended simultaneously, without distractor locations between them being selected. Even though the conditional probability of reporting the other target probe is much higher than the conditional probability of reporting any given distractor probe, it is never very high. In other words, subjects often report just one target probe correctly. This low accuracy does not mean that attention cannot be split across the two target locations. It likely reflects the fact that even after the two locations are selected, the fast display times and the simultaneous demands of the two tasks make it difficult to identify and remember both the target probe letters. Ifthe probe data reflected a single focus of attention, probe accuracy for the other target location should have been higher when the two targets were adjacent and they could both be selected together (see, e.g., Eriksen & St. James, 1986; LaBerge, 1983; Posner et al., 1980). Instead, the target accuracy is just as low with adjacent targets as it is with distractors between them.
420
BICHOT, CAVE, AND PASHLER 40
no intervening dist ract ors
35 30 25 20 15 10 5 40
one int ervening dist ract or
35 30 25
.. .. .. .. o
Gl
0
u
20 15 10 5
c 40
Gl
U
Gl
C.
two int ervening dist ract ors
35 30 25 20 15 10 5 40
three intervening dist ract ors
35 30 25 20 15 10 5
.J.-~-.------r-
1234567
Distancefrom reported target probe Figure 14. Percentages of correct responses in the probe task when a probe at a target location is reported correctly. The abscissa represents the distance (in positions) ofstimuli with respect to the target location at which the probe was reported correctly. (Positions 1 and 7 are both adjacent to the target location.) The ordinate represents the conditional probability of correct reports at these relative stimulus locations. The number of intervening distractors between the targets is indicated in the upper right corner of each panel. The other target position is highlighted with the gray shaded boxes.
Discussion If spatial attention operates by facilitating the processing of selected locations, as many researchers have assumed, selecting two locations is probably a more complex operation than selecting just one. However, one recent study indicated that, in search for a color target, se-
lection is accomplished by inhibition applied specifically to distractor locations (Cepeda et aI., 1998). Such a mechanism that eliminates distractors leads naturally to the selection of multiple targets, if they are present (see Cave & Bichot, in press, for more detail). In this experiment, we found that two target locations can be selected simultaneously without distractors between them being selected. These results suggest that the spotlight metaphor of attention, in which only one target location can be selected at a given time (Posner et al., 1980), does not accurately reflect selection in these search tasks. These results are also inconsistent with the zoom-lens model (Eriksen & St. James, 1986), in which only contiguous target locations can be selected simultaneously by expanding the region covered by a unitary spotlight. If a unitary spotlight covering both target locations had been used in this experiment, we would have observed improved probe report accuracy at distractor locations between the targets, possibly to the level ofthe accuracy for probes at target locations. Instead, the accuracy of probe report at intervening distractor locations was no different than that at other distractor locations. Kramer and Hahn (1995) reported split attention in a spatial cuing paradigm. However, the subjects in their experiment were able to split their attention only when distractors (as well as the targets) were not presented as sudden onsets, thereby drawing attention automatically. In our experiment, however, all the stimuli were presented as sudden onsets, and the subjects could still split their attention between the target locations. The difference in the results of these two experiments can be partially due to the experimental paradigms used. Kramer and Hahn used spatial cuing to indicate target locations, whereas in our experiment, the colors ofthe stimuli distinguished the targets from distractors. Perhaps the inherent difference between targets and distractors in our experiment (i.e., bottom-up differences) was strong enough to override the effects of sudden onset. There could also be other differences in attention between these tasks. Whereas attention in our color search tasks takes the form of inhibition of distractor locations, attention in response to spatial cuing may be a facilitation of the target locations. An important alternative explanation ofthese results involving attentional shifts ofa single moving spotlight (Posner et aI., 1980) was discussed in Experiments 3 and 4. The subjects might have been attending to one target location and then rapidly shifting their attention to the other, rather than splitting their attention between the two target locations. In Experiment 6, the duration of the probe display (i.e., 60 msec) was critical in determining the feasibility of this strategy. Previous experiments have estimated that it takes on the order of200 msec to identify a stimulus at one location and switch attention to a second location (see, e.g., Eriksen & Yeh, 1985; Krose & Julesz, 1989). On the other hand, measurements based on visual search slopes result in estimates of 50-60 msec for each item (see, e.g., Wolfe, Cave, & Franzel, 1989). It is doubtful whether this latter value is a reasonable estimate ofthe time that would be required to select the targets serially in Experiment 6. Ifthere
SELECTING NONCONTIGUOUS LOCATIONS
421
abstract identity detect1rs
'\
/
'\ I /
@@ ©@) @~C?1-®~~; master location map
\1,
0)
~\
red
\1, (I)
"form features"
~\
Figure 15. Location-based selection of two targets, without selection of the distractors between them.
is some property of visual search that allows subjects to shift attention faster than the usual 200 msec, it is not clear whether the tasks in Experiment 6 shared this property. Even ifthe subjects were treating Experiment 6 as ifit were a visual search, the 50-60 msec estimate still should not have allowed the subjects to select and identify both target probes by shifting attention. More directly relevant to this experiment, Kramer and Hahn (1995) also used a stimulus duration of 60 msec and conducted a control experiment showing that switching attention to a second letter location after identifying a letter at one location takes between 70 and 84 msec. This estimate does not include the time necessary to process and identify the second letter. Furthermore, in our experiment, the subjects were also performing the target shape match identification task, which was emphasized over the probe detection task, making it unlikely that they would have concentrated all their efforts on identifying the probe letters. The additional task may have delayed or slowed the planning and initiation of attentional shifts to identify probe letters. Thus, attentional shifts in the context of our experiment would probably have required more than the 70-84 msec minimum estimated by Kramer and Hahn. For all these reasons, and because the horizontal and vertical visual angles subtended by the letters used in Kramer and Hahn's experiment were identical to those in our experiment, we can reliably conclude that the
60-msec letter presentation duration in our experiment was not sufficient for the subjects to identify the letter at one target location, shift their attention to the second target location, and identify the letter at this location. Also note that the subjects in our experiment were not given any incentive whatsoever to identify the letter at one target location, shift their attention to the second target location, and identify the letter at this location, rather than identifying letters at distractor locations. Like the previous experiments, Experiment 6 demonstrates that attention can effectively be split across two different locations. Like Experiments 4 and 5, however, it also suggests that there is some cost in simultaneously selecting and identifying stimuli at noncontiguous locations, because performance in the primary task is best when the two targets are next to one another. This additional cost may be related to attention (and the probe data indicate that attentional effects are stronger when the selected locations are noncontiguous), or there may be increased difficulty in the comparison when the targets are separated by other stimuli.
GENERAL DISCUSSION These experiments all required the identification of target stimuli in the presence of distractor stimuli that
422
BICHOT, CAVE, AND PASHLER
shared many perceptual properties with the target. Under these conditions, the same/alternating comparisons in Experiments 4 and 5, the probe data in Experiment 6, and a number of studies reviewed above indicate that subjects use spatial attention to select target locations over distractor locations. The results reported in this article demonstrate that subjects select different locations simultaneously, even when those locations are separated by distractors that must be excluded. The conclusion about split attention is strengthened by convergence of evidence from two very different experimental techniques that rely on two very different sets of assumptions. Selecting noncontiguous regions simultaneously would require separate attentional windows at different locations that can open and close independently. Separate attentional gates have also been proposed by Reeves and Sperling (1986). Cepeda et al.'s (1998) study suggests that, in this task, only the gates controlling distractor locations will be closed. Figure 15 provides an illustration of how this selection might work in these experiments.' This flexibility to select more than one location is no doubt very useful in identifying occluded objects or collections of separated elements. If the purpose of spatial selection is to prevent information from distractors from interfering with processing of a target, it is not surprising that this sort of split attention was not seen in cuing studies with no distractors present (Posner et al., 1980). Because of the absence of distractors in those displays, there would be little reason for subjects to maintain attention at two separate locations while not selecting the region in between. Although selection of two noncontiguous locations might be possible, it is not necessarily easy. Experiment 6 suggests that selection oftwo locations might be more effective when they are adjacent, and a comparison of Experiments 1-5 with the results from Cave and Pashler (1995) indicates that performance with two targets at two locations (either simultaneous or successive) is lower than performance with two targets at the same location. Thus, it would be no surprise to find that subjects can identify multiple stimuli better when split attention is not necessary (see Podgorny & Shepard, 1983). Likewise, interference between two stimuli will often make it more difficult to identify them simultaneously. The subjects in these experiments might have elected to select targets individually if they had been visible for a much longer time. Splitting attention might take extra effort, and it might only be done when necessary. These results, together with those in Cave and Pashler (1995), show that spatial attention can be a very dynamic process. In these displays, stimuli are changing very quickly, so that information from each stimulus element is available for only a very limited time. In order for a spatial attention mechanism to be used in these tasks, it must be very agile, responding quickly to new targets and distractors as tliey appear. However, the fact that spatial attention effects can be measured in these experiments also demonstrates the limits on the speed with which spatial
attention can be adjusted. Because of those limits, the pattern of spatial attention allocated for one stimulus affects the processing of a stimulus following it. These effects should make it possible to map out the allocation of spatial attention in response to different types of stimuli in great detail, and by doing so, we will gain a better understanding ofthe types of interference in visual processing that make selection necessary. REFERENCES BICHOT, N. P., SCHALL, J. D., & THOMPSON, K. G. (1996). Visual feature selectivity in frontal eye fields induced by experience in mature macaques. Nature, 381, 697-699. BROADBENT, D. E., & BROADBENT, M. H. P. (1987). From detection to identification: Response to multiple targets in rapid serial visual presentation. Perception & Psychophysics, 42,105-113. CARPENTER, R H. S. (1988). Movements of the eyes. London: Pion Press. CASTIELLO, V., & VMILTA, C. (1990). Size of the attentional focus and efficiency of processing. Acta Psychologica, 73,195-209. CASTIELLO, V., & VMILTA, C. (1992). Splitting focal attention. Journal ofExperimental Psychology: Human Perception & Performance, 18, 837-848. CAVE, K. R, & BICHOT, N. P. (in press). Visuo-spatial attention: Beyond a spotlight model. Psychonomic Bulletin & Review. CAVE, K. R, & PASHLER, H. (1995). Visual selection mediated by location: Selecting successivevisual objects. Perception & Psychophysics, 57, 421-432. CAVE, K. R., & ZIMMERMAN, 1. M. (1997). Flexibility in spatial attention before and after practice. Psychological Science, 8, 399-403. CEPEDA, N. 1., CAVE, K. R., BICHOT, N. P., & KiM, M.-S. (1998). Spatial selection via feature-driveninhibition of distractor locations. Perception & Psychophysics, 60, 727-746. COLBY, C. L. (1991). The neuroanatomy and neurophysiology ofattention. Journal ofChild Neurology, 6 (Suppl.), S88-SI16. CONSTANTINIDIS, c., & STEINMETZ, M. A. (1996). Neuronal responses in area 7a to stimuli that attract attention. Society for Neuroscience Abstracts, 22, 1198. DoWNING, C. 1., & PiNKER, S. (1985). The spatial structure of visual attention. In M. I. Posner & O. S. M. Marin (Eds.), Attention and performance Xl: Mechanisms ofattention (pp. 171-187). Hillsdale, NJ: Erlbaum. DUNCAN, 1. (1984). Selectiveattentionand the organizationof visual information, Journal ofExperimental Psychology: General, 113,501-517. ERIKSEN, C. w., & ST.JAMES, J. D. (1986). Visual attention within and around the field offocal attention: A zoom lens model. Perception & Psychophysics, 40, 225-240. ERIKSEN, C. w., & YEH, Y.-Y. (1985). Allocation of attention in the visual field. Journal ofExperimental Psychology: Human Perception & Performance, 11, 583-597. GOODALE, M. A., & MILNER, A. D. (1992). Separate visual pathways for perception and action. Trends in Neurosciences, 15, 20-25. HARMS, L., & BUNDESEN, C. (1983). Color segregation and selective attention in a nonsearch task. Perception & Psychophysics, 33, 11-19. HEINZE, H.-J., LUCK, S. J., MONTE, T. E, Gas, A., MANGUN, G. R., & HILLYARD, S. A. (1994). Attention to adjacent and separate positions in space: An electrophysiological analysis. Perception & Psychophysics, 56, 42-52. HOFFMAN, J. E., & NELSON, B. (1981). Spatial selectivity in visual search. Perception & Psychophysics, 30, 283-290. HOFFMAN, J. E., NELSON, 8., & HOUCK, M. R. (1983). The role of attentional resources in automatic detection. Cognitive Psychology, 51, 379-410. HUGHES, H. C, & ZIMBA, L. D. (1985). Spatial maps ofdirected visual attention. Journal of Experimental Psychology: Human Perception & Performance, 11,409-430. HUGHES, H. C., & ZIMBA, L. D. (1987). Natural boundaries for the spatial spread of directed visual attention. Neuropsychologia, 25, 5-18.
SELECTING NONCONTIGUOUS LOCATIONS
JONIDES, J. (1983). Further toward a model of the mind's eye's movement. Bulletin ofthe Psychonomic Society, 21, 247-250. KIM,M.-S., & CAVE, K. R. (1995). Spatial attention in visual search for features and feature conjunctions. Psychological Science, 6, 376-380. KIM,M.-S., & CAVE, K. R. (1998). Perceptual grouping via spatial attention in a focused-attention task. Manuscript submitted for publication. KRAMER, A. F., & HAHN, S. (1995). Splitting the beam: Distribution of attention over noncontiguous regions ofthe visual field. Psychological Science, 6, 381-386. KRAMER, A. F., WEBER, T. A., & WATSON, S. E. (1997). Object-based attentional selecticn-s-Grouped arrays or spatially invariant representations? Comment on Vecera and Farah (1994). Journal of Experimental Psychology: General, 126, 3-13. KROSE, B., & JULESZ, B. (1989). The control and speed of shifts in attention.Vision Research, 29,1607-1619. LABERGE, D. (1983). Spatial extent of attention to letters and words. Journal of Experimental Psychology: Human Perception & Performance, 9, 371-379. PAN, K., & ERIKSEN, C. W. (1993). Attentional distribution in the visual field during same-different judgments as assessed by response competition. Perception & Psychophysics, 53, 134-144. PODGORNY, R., & SHEPARD, R. N. (1983). Distribution of visual attention over space. Journal of Experimental Psychology: Human Perception & Performance, 9, 380-393. POSNER, M. I., SNYDER, C. R. R., & DAVIDSON, B. J. (1980). Attention and the detection of signals. Journal of Experimental Psychology: General, 109, 160-174. RAYMOND, J. E., SHAPIRO, K. L., & ARNELL, K. M. (1992). Temporary suppression of visual processing in an RSVP task: An attentional blink? Journal of Experimental Psychology: Human Perception & Performance, 18, 849-860. REEVES, A., & SPERLING, G. (1986). Attention gating in short-term visual memory. Psychological Review, 93, 180-206. RIZZOLATTI, G., RIGGIO, L., DASCOLA, I., & UMILTA, C. (1987). Reorienting attention across the horizontal and vertical meridians: Evidence in favor of a premotor theory of attention. Neuropsychologia, 25,31-40. ROBINSON, D. L., BOWMAN, E. M., & KERTZMAN, C. (1995). Covert orienting of attention in macaques: II. Contributions of parietal cortex. Journal ofNeurophysiology, 74, 698-712. SCHALL, 1. D., HANES, D. P., THOMPSON, K. G., & KING, D. J. (1995). Saccade target selection in frontal eye field of macaque: I. Visual and premovement activation. Journal of Neuroscience, 15, 6905-6918. SCHALL, 1. D., MOREL, A., KING, D. J., & BULLIER, J. (1995). Topography of visual cortical afferents to frontal eye field in macaque: Functional convergence and segregation ofprocessing streams. JournalofNeuroscience, 15,4464-4487. SHAW, M. L. (1978). A capacity allocation model for reaction time. Journal of Experimental Psychology: Human Perception & Performance, 4, 586-598. SHAW, M. L., & SHAW, P. (1977). Optimal allocation of cognitive resources to spatial locations. Journal of Experimental Psychology: Human Perception & Performance, 2, 201-211. SHIFFRIN, R. M., & GARDNER, G. T. (1972). Visual processing capacity and attentional control. Journal ofExperimental Psychology, 93, 7282. SHIH, S.-I., & SPERLING, G. (1996). Is there feature-based attentional selection in visual search? Journal of Experimental Psychology: Human Perception & Performance, 22, 758-779. STEINMETZ, M. A., CONNOR, C. E., CONSTANTINIDIS, C., & McLAUGHLIN, J. R. (1994). Covert attention suppresses neuronal responses in area 7a of the posterior parietal cortex. Journal ofNeurophysiology, 72, 1020-1023.
423
THEEUWES, J. (1995). Temporal and spatial characteristics ofpreattentive and attentive processing. Visual Cognition, 2, 221-233. THOMPSON, K. G., BICHOT, N. P., & SCHALL, J. D. (1997). Dissociation of visual discrimination from saccade programming in macaque frontal eye field. Journal ofNeurophysiology, 77,1046-1050. THOMPSON, K. G., HANES, D. P., BICHOT, N. P., & SCHALL, 1. D. (1996). Perceptual and motor processing stages identified in the activity of macaque frontal eye field neurons during visual search. Journal of Neurophysiology, 76, 4040-4054. TSAL, Y., & LAVIE, N. (1993). Location dominance in attending to color and shape. Journal ofExperimental Psychology: Human Perception & Performance, 19, 131-139. VECERA, S. P., & FARAH, M. J. (1994). Does visual attention select objects or locations? Journal of Experimental Psychology: General, 123,146-160. WOLFE, 1., CAVE, K. R., & FRANZEL, Q. (1989). Guided search: An alternative to the feature integration model for visual search. Journal ofExperimental Psychology: Human Perception & Performance, IS, 419-433. YANTIS, S. (1995). Attentional capture in vision. In A. F. Kramer, M. G. H. Coles, & G. D. Logan (Eds.), Converging operations in the study of visual selective attention (pp. 45-76). Washington, DC: American Psychological Association.
NOTES
I. Thanks to Jeff Miller for pointing out this possibility. 2. First, we found all the trials with at least one target location being correctly reported. We then counted the number of other correct reports for each of the other locations, including the other target location. Locations were specified, relative to the correctly reported target and the other target. On trials in which only one target probe was reported, we added one to the count for each location whenever the probe at that location was reported. On trials in which both the targets were reported, we started with one target location, adding one to the count for each location relative to that target location, and then repeated the same procedure for the other target location. The sums of all the counts across trials were then divided by the number of correctly reported target location probes, to obtain the conditional probabilities. We also considered an alternative procedure that produces a more conservative estimate of the attention allocated to target locations. Under this procedure, when both target probes were reported correctly, each target probe added only 0.5 to a count, and each correctly reported distractor probe in the same trial added 0.5 to each of two counts. Each count would then be divided by the number oftrials in which at least one target probe was reported correctly. Although this alternative method resulted in somewhat smaller values of conditional report probabilities of the second target probe and a smaller difference between the second target and distractor probe conditional report probabilities, all the conclusions of the experiment are the same when this alternative method is used. On the basis ofa suggestion ofone reviewer, we are presenting the results of the first rather than the alternative method of computation of conditional probabilities. 3. Our current data lead to no conclusions about the nature of the abstract identity detectors, and the diagrams are not intended to make such claims. Likewise, our data allow no conclusions about the shape of the selected area or the sharpness ofthe boundary between the selected and the unselected areas.
(Manuscript received July 6, 1993; revision accepted for publication February 19, 1998.)