For instance, an apple may look green at midday ..... Technical report, Eastman Kodak Company - ... CMOS: Facts and fict
Visual sensors and physical effects
An excerpt from a thesis submitted in partial fulfilment of the requirements for the degree of Doctor of Philosophy
at Lincoln University by Kenji Irie
2010
ii
This excerpt provides a background to the principles of the human vision system, cameras, lighting, and shadows. It has been extracted and adapted by the author from his PhD thesis, entitled “Noise-limited scene-change detection in images”, for use in CV Online (http://homepages.inf.ed.ac.uk/rbf/CVonline/CVentry.htm). The entire thesis can be found at the Lincoln University Library: http://hdl.handle.net/10182/1351 Please reference the full thesis when citing any part of this excerpt.
CONTENTS
CHAPTER 1
THE HUMAN VISION SYSTEM 1.1 The non-linear intensity response of the HVS 1.2 Colour response of the HVS 1.3 Chromatic adaptation and image display
1 1 2 2
CHAPTER 2
IMAGE CAPTURE
4
CHAPTER 3
METAMERISM
5
CHAPTER 4
DIGITAL CAMERAS 4.1 A brief history of digital imaging 4.2 CCD/CMOS image capture
6 6 7
CHAPTER 5
LIGHT & SHADOWS 5.1 Colour temperature 5.2 Sunlight, skylight, and daylight 5.3 Artificial illumination 5.4 Shadow classification 5.5 Shadows and imaging
REFERENCES
9 9 9 11 12 12 13
Chapter 1 THE HUMAN VISION SYSTEM
1.1
THE NON-LINEAR INTENSITY RESPONSE OF THE HVS
The human vision system (HVS) has a non-linear perception of intensity. Although light intensity can be easily measured, brightness is a subjective phenomenon. Studies show that there is a complex relationship between intensity and perceived brightness that depends on several factors, including the level of surrounding light (Stone 2003), but is often approximated as log intensity, or intensity powered to between 1/2 and ´ 1/3 (Poynton 1996). The Commission Internationale de l’Eclairage (CIE) defines luminance, denoted Y , as radiant power weighted by a spectral sensitivity function that is characteristic of the HVS (CIE 2009). Furthermore, the CIE defines lightness, L∗ (scale 0–100), the perceptual response to brightness, as predominately a modified cube root of luminance: ∗
L = 116
�
Y Yn
�1 3
− 16,
Y > 0.008856 Yn
(1.1)
where Yn is the luminance of the white reference. This response is graphed in Figure 1.1 where Yn is 100.
Lightness (perceived luminance)
100
80
60
40
20
0
Figure 1.1
0
20
40 60 Luminance
80
100
The human perceptual response to luminance as defined by the CIE.
1.2
2
COLOUR RESPONSE OF THE HVS
An example demonstrating the non-linearity of the HVS is demonstrated in Figure 1.2. The top bar is luminance, encoded linearly, where it appears that most of the values are light. The bottom bar is lightness which is perceptually encoded such that the photographic mid-grey appears at value 50, but is only 18% of the maximum luminance value 100. Luminance
Figure 1.2 (bottom).
1.2
20
40
60 Lightness
80
100
20
40
60
80
100
Linearly encoded intensity values (top) and linearly encoded lightness (perceptual) values
COLOUR RESPONSE OF THE HVS
Colour is what we see, and much more than just a physical attribute of the light our eyes detect. Sir Isaac Newton describes it as follows (Newton 1730): “For the Rays (of light) to speak properly are not coloured. In them there is nothing else than a certain Power and Disposition to stir up a Sensation of this or that Colour.” An example of this process is given by the colour purple. Purple is not a hue listed in the spectrum of colour (red, orange, yellow, green, cyan, blue, indigo (Gerritsen 1975)) but a combination of the red and blue/violet hues. This illustrates the difficulty in developing machine vision systems capable of mimicking the HVS (Huang & Wu 1998). The eye captures light in the rods and cones of the retina. The rods are highly light sensitive, and allow vision in dim lighting conditions. The reason we see monochromatically at night is because we only have one type of rod. There are three varieties of cone: short, medium and long, which are sensitive to blue, green, and yellowgreen light respectively (Trussell, Saber & Vrhel 2005) giving colour. These sensitivities form the basis for the trichromatic (R,G,B) colour primaries in digital imaging. The relative populations of the short, medium and long cones are approximately 1:20:40. The scarcity of short (blue) cones, which are absent entirely from the centre of the fovea, limits the sharpness of intensely blue colours (Stone 2003). The eye’s colour sensitivity curve peaks at 555 nm, in the green hue of the spectrum (Gerritsen 1975).
1.3
CHROMATIC ADAPTATION AND IMAGE DISPLAY
Chromatic adaptation describes the ability of the HVS to adapt to the colour of the light illuminating the scene (Stone 2003), helping to keep the perceived object colour
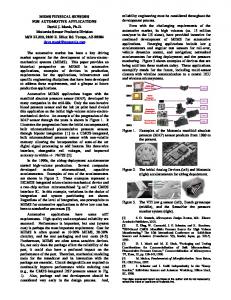
constant when viewed in different lighting conditions. For instance, an apple may look green at midday when the sun is approximately white in colour, but also at sunset when the illumination has a red cast. This helps the HVS identify objects. Most consumer-grade digital cameras have an automatic white-balance mode that is designed to adjust the captured images to appear as if illuminated by a pure white illuminant. Virtually all output devices are calibrated to a white reference. For example, the white used in standard monitors is defined as RGB(255,255,255), whereas the white for a standard printer is the colour of the paper. The process of adjusting a captured image so that it appears as if recorded under an ideal white illuminant is known as colour constancy. The process of achieving colour constancy in digital images is a non-trivial task and is an active area of research (Funt, Barnard & Martin 1998, Barnard, Cardei & Funt 2002). Shown in Figure 1.3 is an example highlighting the difficulty of achieving colour constancy. Each image was taken in different illumination conditions with the camera set to full automatic mode. A perfect colour constancy process would adapt the colouring of each image to an ideal white illuminant yet there remain significant colour differences between the images. The differences would have been greater if the automatic white balance in the camera had been disabled. The eye would adapt to the colouring in each of the images if they totally encompassed the eye’s field of view, but the images appear different when placed together on a background because the eye adapts to the paper as a white reference.
(a)
(b)
(c)
(d)
Figure 1.3 Images taken with a Canon Powershot A75 camera in different illumination conditions with automatic white balance enabled: (a) ambient sunlight, (b) flash, (c) incandescent, and (d) fluorescent lighting.
4
Chapter 2 IMAGE CAPTURE
The components required in capturing an image are: an object/scene an illuminant (light source) a sensing array
The sensing device, typically an eye or an electronic sensor, is limited in spectral bandwidth and sensitivity and can be affected by metamerism (colour aliasing, see Chapter 3) and saturation. The sensor of a camera system usually modifies the image non-linearly and digitizes the pixel data before export. The representation of an image of the scene will change as it passes through the camera and display system. Figure 2.1 shows the pathway of scene irradiance from capture to reproduction for a digital imaging system. The scene to be imaged is subject to an illuminant such as the sun or sources of artificial lighting. The reflected scene illumination passes through the camera optics and the incident image falls upon the sensor. The sensor then converts the incident image photons into an electronic signal. This signal is amplified and is referred to as the captured image. Some form of processing typically occurs, such as gamma, gain and white balance adjustment, before the captured image is nonlinearly encoded and the recorded image is available for export in a digital form (e.g., raw, JPEG, Y CR CB ). The recorded image is usually stored and/or transmitted to an output device such as a monitor or printer, which creates a rendered image for visual display.
Figure 2.1
The image capture and reproduction pathway.
Chapter 3 METAMERISM
The spectral energy P of an object recorded by a sensor is a function of the illumination E, the object surface response S, and the sensor response C, such that: P (λ) = E(λ)S(λ)C(λ)
(3.1)
where λ is the wavelength of light (Funt & Finlayson 1995). The particular value of P for a specific surface S1 and illuminant E1 is not unique, as other surfaces and illuminants S2 and E2 will exist such that: E1 (λ) S2 (λ) = . E2 (λ) S1 (λ)
(3.2)
This effect is known as metamerism, or colour aliasing. In practical terms it means that the colour image of two objects with different surface colourants may appear identical when placed under different illuminants. For standard colour imaging, the recorded spectral energy is a combination of the responses of the R, G, and B wavelengths: � � P(R,G,B) = P (λR ), P (λG ), P (λB ) .
(3.3)
Metamerism can occur on any one or more of the R, G, and B colour primaries. Multiple objects, having different spectral reflectance curves but the same measured spectral response, are defined as metameric objects (Billmeyer & Saltzman 1966).
Chapter 4 DIGITAL CAMERAS
The purpose of digital imaging is to capture a scene in a digital format for accurate scene reconstruction at a later time. Most digital cameras have the ability to alter characteristics of the image such as white balance or contrast to visually improve the quality of the image when reproduced for the HVS. These adjustments can have significant impact on the machine processing of digital images as the captured image is no longer representative of the incident image. Charge-coupled devices (CCDs) have traditionally been the dominant image-sensor technology. However, recent advances in the design of complementary metal-oxidesemiconductor (CMOS) technologies have led to its adoption in many consumer-grade devices, as well as being a viable alternative to professional CCD systems (El Gamal & Eltoukhy 2005). Both Nikon and Canon shifted to CMOS sensors in their professional SLR cameras from the D3 (Nikon) and EOS-1Ds Mk-III (Canon) cameras onwards.
4.1
A BRIEF HISTORY OF DIGITAL IMAGING
The following section is summarized from Flory (Flory 1985), Fossum (Fossum 1997), and El Gamal (El Gamal & Eltoukhy 2005). The entire history of electronic image acquisition spans more than 80 years, starting with the iconoscope which was invented around 1925. The period 1945–1965 saw the era of the orthicon, which was a complex solution to the shortcomings of the iconoscope. Both of these devices used scanning electron beams to scan a photosensitive element. In 1965 the photoconductive sensor was developed, and it became the dominant image sensor technology until 1970, when the CCD was developed. It has since been the dominant sensor technology. MOS photodiodes were developed in the late 1960s, but MOS image sensors started arriving only in the early 1980s. The arrival of CMOS passive-pixel sensors happened in the mid-1980s, where they were the technology of choice for only a very few scientific fields due to low dynamic range and low signal-to-noise ratios (SNR). In the early 1990s work began on the modern CMOS active-pixel sensor, originally conceived in 1968. It was quickly realized that adding an amplifier to each pixel significantly increases sensor speed and SNR, overcoming the limitations of passive-pixel CMOS. With the recent advent of deep submicron CMOS and integrated microlens technologies, active-pixel CMOS sensors have become viable alternatives to CCD image sensors. CMOS image
4.2
7
CCD/CMOS IMAGE CAPTURE
sensors remain in an active state of research and development, and are likely to be the choice of imaging sensor in the future.
4.2
CCD/CMOS IMAGE CAPTURE
The CCD and CMOS sensor architectures share many similarities. Photons are captured and converted to charge in the photo detection process, the charge is conditioned/sampled, and the samples are digitally enhanced for output. This process is described comprehensively in the literature (El Gamal & Eltoukhy 2005, Flory 1985, Litwiller 2001, Blanc 2001, Kremens 2001, El Gamal, Fowler, Min & Liu 1998, Catrysse, Wang & El Gamal 1999, Costantini & S¨ usstrunk 2004, Anaxagoras, Guerrini, Turchetta & Allinson 2005). Figure 4.1 details a typical digital image sensor for a CCD/CMOS digital camera system. Colour filter array Microlens spacer Colour filter planarization layer Microlens overcoat Microlenses
Semiconductor elements (CMOS) Photodetectors
Sensor optics
Figure 4.1
The layout of a typical digital image sensor.
Light passing through the optics falls onto the imaging sensor. Some image sensors use microlenses to increase the amount of light incident on the photodetectors (El Gamal & Eltoukhy 2005, Chen, Catrysse, El Gamal & Wandell 2000). This helps reduce the problem of vignetting, where light entering the sensor in a direction that is not parallel to the optical axis does not reach the photodetectors due to the optical tunnel formed by the sensor manufacturing process. For consumer grade colour cameras the light passes through a colour filter array (CFA) to generate trichromatic images. The filtered light then enters the photodetectors, where approximately half of the photons are converted to charge (Brouk & Nemirovsky 2004). The CCD and CMOS fabrication technologies are significantly different. Specifically, CCDs are manufactured with technologies solely optimized for imaging and charge transfer, whereas CMOS devices are manufactured with mostly standard technologies and have the ability to incorporate logic and analogue processing on the same die as the photodetectors. Apart from the ability to integrate the sensor, control logic, and processing on the same chip, CMOS sensors enable each individual pixel to have its own transistors, amplifiers, charge-to-voltage conversion, or even digital signal processors (DSPs). The drawback is that the pixel fill rate, or the area that can be used to capture photons, is reduced when logic is added alongside each pixel.
4.2
8
CCD/CMOS IMAGE CAPTURE
Figure 4.2 (left) shows a typical interline CCD readout architecture. The charge from each pixel is read sequentially, with each charge moving along a column or row in a conveyer-type fashion. Analogue-to-digital conversion (ADC), storage, and enhancement are performed on supporting integrated circuits (ICs). There are three major readout architectures used for CCD sensors: full-frame (FF), frame-transfer (FT), and interline-transfer (IL). FF has a fill rate of up to 100% of the pixel area, but is prone to smearing during charge readout. FT shifts the image to a second image buffer at high speed prior to readout, thereby reducing image smear. IL CCD is the most popular image sensor for camcorders and digital still cameras, but suffers from a reduced fill rate due to charge storage buffers located beside each pixel (Nakamura 2006, Kodak CCD Primer KCP-001 1999). This reduction in fill rate varies, but fill rates between 20 and 50% are not uncommon. A microlens is often used to compensate for this reduction by increasing the effective area of incident light collection. Photodiodes
Output
Row decoders
Photodetectors
Charge transfer
CCD’s
Column amplifiers Charge transfer
Figure 4.2
Output
Column ADC/MUX
Typical architectures of interline CCD (left) and passive-pixel CMOS (right).
Current CMOS sensors can be divided into two main architectural types: passivepixel sensors (PPS) and active-pixel sensors (APS) (Nakamura 2006, Yadid-Pecht & Fish 2004, El Gamal & Eltoukhy 2005). Figure 4.2 (right) shows a typical readout architecture for a CMOS PPS. Each pixel contains a photodiode and one MOS transistor. As in most CMOS image sensors, row and/or column decoders are used for addressing the pixels in the array. Although they have relatively high fill rates due to having only a single transistor, PPS devices suffer from high noise due to large capacitive bus loads during pixel readout. They are also prone to column fixed-pattern noise (FPN) from variations in the manufacturing process of the column amplifiers, which can result in objectionable vertical stripes in the recorded image. CMOS APS can be divided into three main subtypes: photodiode, photogate, and pinned photodiode, where in each type three or more transistors are used in each pixel. APS devices typically have a fill rate of 50-70%, but the reduced capacitive bus load during readout due to the transistor amplifiers leads to lower readout noise, which increases the signal-to-noise ratio (SNR) and sensor dynamic range (DR). The pinnedphotodiode APS has currently been reported as the most popular implementation for CMOS image sensors (Nakamura 2006). There are other types of APS available but they are currently not in widespread use. The logarithmic photodiode sensor (Loose, Meier & Schemmel 2001) operates continuously and provides increased dynamic range from logarithmic encoding of the photocurrent. However, low output sensitivity during low illumination and significant
temperature dependence are serious drawbacks limiting the use of this method. Fowler et al. describe a ‘digital-pixel sensor’ that has 22 transistors and ADC functionality at each pixel (Fowler, El Gamal & Yang 1994).
Chapter 5 LIGHT & SHADOWS
Light is a small component of the electromagnetic spectrum, consisting of two perpendicular oscillating magnetic and electric waves (Parisi, Sabburg & Kimlin 2004). However, light can exhibit properties of both waves and particles. This property is referred to as wave-particle duality, with references found in many textbooks, such as (Ditchburn 1976).
5.1
COLOUR TEMPERATURE
An illuminant’s colour can be described loosely by its colour temperature (Stone 2003), which is based on the colour output of a black-body radiator at a specific temperature. In general, low colour temperatures represent a reddish-yellow illuminant and high colour temperatures represent bluish-white illuminants. For example, candle flames have a relatively low colour temperature of 2,000 K. The tungsten in incandescent lighting has a colour temperature ranging from 2,500–2,800 K. Halogen lights range from 2,800 K to around 3,200 K, and fluorescent lamps typically operate between 2,500– 6,500 K. Sunlight at midday light is approximated by a 6,500 K colour temperature. The CIE-defined daylight spectrum for midday light is labelled D65. This term is sometimes used interchangeably with 6,500 K but the colours defined by the CIE are different from black-body radiators because they simulate not only the colour of the sun (a black body radiator of approximately 5,800 K) but also the scattering effect of the atmosphere. The spectral emission of high-intensity discharge (HID) and fluorescent lamps are not appropriately described by colour temperature alone when used in photography, as their spectrum is composed of specific descrete wavelengths. Figure 5.1 shows the CIE 1931 chromaticity space which is often used to approximately describe colours. The Planckian locus describes the colour emitted by a blackbody radiator at increasing temperature. Colours falling in the vicinity of the lines crossing the locus can be described as a correlated colour temperature of the associated line’s intersection with the locus.
5.2
SUNLIGHT, SKYLIGHT, AND DAYLIGHT
10
Figure 5.1 The CIE 1931 x,y chromaticity space, also showing the chromaticities of black-body light sources of various temperatures (Planckian locus), and lines of constant correlated colour temperature. (Image PlanckianLocus.png from http://www.wikipedia.org. Permission to freely distribute this image under the GNU Free Documentation license, Version 1.2 or later).
5.2
SUNLIGHT, SKYLIGHT, AND DAYLIGHT
The sun emits radiation that roughly approximates a black-body radiator from 5750– 5800 K (Henderson 1977, Iqbal 1983). The intensity and spectrum of daylight changes primarily with atmospheric conditions (ignoring changes in the solar constant). The earth’s albedo is roughly 40% (approximately 40% of the incoming solar radiation is reflected back into space). About 15% is absorbed in the atmosphere, and around 45% reaches the earth’s surface, where it is absorbed and re-radiated at infra-red wavelengths (Henderson 1977). The atmospheric filtering process is non-linear, hence the apparent colour of sunlight when viewed from Earth is typically yellow depending upon the number and size of particles in the atmosphere. According to Rayleigh’s theory of molecular scattering, the probability that a single photon of sunlight will be scattered from its original direction by an air molecule is inversely proportional to the fourth power of the wavelength (Lynch & Livingston 1995). That is, the shorter the wavelength of light (i.e., the bluer the light), the higher its
5.2
11
SUNLIGHT, SKYLIGHT, AND DAYLIGHT
chances of being scattered. This causes the sky to appear to irradiate a blue colour, called skylight, which is the Rayleigh-scattered component of the sun’s light passing through the atmosphere. Figure 5.2 illustrates the illumination of earth from the sun, and the colouring of cast shadows from skylight. On earth, daylight is a combination of sunlight and skylight. The colour of the daytime sky in clear conditions changes with the viewing angle. The sky viewed directly upwards is typically deep blue in appearance, with a ‘fading’ to a lighter shade of blue or even white when looking towards the horizon. Each molecule in the atmosphere can be considered a source of Rayleigh-scattered light. Looking towards the horizon increases the quantity of air mass that is viewed when compared to looking directly upwards, increasing the amount of scattered light seen by the observer. The maximum viewing distance before all light is scattered and the view becomes opaque is dependent upon wavelength. The shorter the wavelength, the shorter the distance until the transmitting medium becomes optically thick. As the view of the sky is shifted from directly above the observer towards the horizon, the blue end of the spectrum is the first to become opaque (i.e, maximum brightness from Rayleigh scattering), followed by green then red, until all wavelengths become opaque and the skylight illumination appears white. The red or yellow sky at dawn and dusk is primarily from the added scattering of light from dust, smoke, and water particles in the air. These particles attenuate the sunlight after the Rayleigh scattering has removed the shorter wavelengths of light (Lynch & Livingston 1995).
Sun
Rayleigh-scattered light Sunlight
Atmosphere Skylight-lit region (cast shadow) Daylight-lit region
Earth
Figure 5.2
The generation of daylight illumination on earth.
5.3
ARTIFICIAL ILLUMINATION
5.3
12
ARTIFICIAL ILLUMINATION
Incandescent and halogen light bulbs are essentially black-body radiators that use heated filaments to produce light, and compared to more modern methods of lighting are relatively crude and inefficient as a large amount of energy is lost as heat. They emit light over a broad spectrum extending beyond the 350–700 nm range of the HVS. Fluorescent and high-energy discharge (HID) lamps emit light efficiently but only at specific wavelengths. Monochromatic LEDs are narrow band, and the increasingly popular white LEDs have spectral emission curves closer to that of the HVS. The effect of the significant differences in spectral emission curves of the different forms of artificial illuminants is in part negated by the band-pass filtering of light into the three primary colours in the eye and in standard digital cameras.
5.4
SHADOW CLASSIFICATION
Shadows are a natural and common occurrence in almost every environment, and are caused by the occlusion of light. Shadows are typically categorised as being either ‘cast’ or ‘self’ shadows. Cast shadows are generated by objects partially or completely occluding the illuminating light sources, whereas self-shadows describe the shading that occurs on an object from the object itself, e.g., the side of a box on the opposite side from the illuminating source. Cast shadows can contain areas of umbra, or ‘hard’ shadows, and penumbra or ‘soft’ shadows. The umbra is the area completely occluded from the light source. The penumbra is the area that is partially occluded from the light source because the light source (non-point) is only a finite distance away. In reality, all natural images will contain shadows with both umbra and penumbra shadows, although the size of the penumbra in an image may be very small depending upon the resolution, field-of-view of the imaging device, and the size and distance of the light source.
5.5
SHADOWS AND IMAGING
The digital image capture of any non-trivial scene introduces several complexities that can confound the shadow identification and/or removal process: Imaging devices have limited dynamic range and may not be able to capture enough scene information to allow shadow algorithms to perform robustly. Many imaging devices automatically adjust settings and parameters so that the device’s response to the given scene is maximized. Hence colour balance, focus, gain etc., may be used to alter the content and quality from image to image. The image noise may change from image to image, as it is highly dependent upon camera settings, parameters, temperature and scene content.
REFERENCES
Anaxagoras, T., Guerrini, N., Turchetta, R. & Allinson, N. M. (2005). High dynamic range sensor active pixel sensor, Proc. of the First International Conference on Sensing Technology pp. 448–453. Barnard, K., Cardei, V. & Funt, B. (2002). A comparison of computational color constancy algorithms. i: Methodology and experiments with synthesized data, IEEE Trans. Image Processing 11(9): 972–984. Billmeyer, Fred W., J. & Saltzman, M. (1966). Principles of Color Technology, John Wiley & Sons. Blanc, N. (2001). CCD versus CMOS - has CCD imaging come to an end?, Photogrammetric Week ’01’ . Brouk, L. & Nemirovsky, Y. (2004). CMOS SOI image sensor, Proc. of the IEEE International Conference on Electronics, Circuits and Systems 11: 156–159. Catrysse, P. B., Wang, M. & El Gamal, A. (1999). Comparative analysis of color architectures for image sensors, Proc. of SPIE Sensors, Cameras, and Applications for Digital Photography 3650: 26–35. Chen, T., Catrysse, P. B., El Gamal, A. & Wandell, B. A. (2000). How small should pixel size be?, Proc. of SPIE Sensors and Camera Systems for Scientific, Industrial, and Digital Photography Applications 3965: 451–459. CIE (2009). http://www.cie.co.at. Costantini, R. & S¨ usstrunk, S. (2004). Virtual sensor design, Proc. of SPIE Sensors and Camera Systems for Scientific, Industrial, and Digital Photography Applications V. 5301: 408–419. Ditchburn, R. W. (1976). Scattered and filtered solar UV measurements, third edn, Academic Press, London. El Gamal, A. & Eltoukhy, H. (2005). CMOS image sensors, IEEE Circuits and Devices Magazine 21(3): 6–20. El Gamal, A., Fowler, B., Min, H. & Liu, X. (1998). Modeling and estimation of FPN components in CMOS image sensors, Proc. of SPIE . Flory, R. (1985). Image acquisition technology, Proc. of the IEEE 73(4): 613–637.
REFERENCES
14
Fossum, E. (1997). CMOS image sensors: electronic camera-on-a-chip, IEEE Trans. Electron Devices 44(10): 1689–1698. Fowler, B., El Gamal, A. & Yang, D. (1994). A CMOS area image sensor with pixellevel A/D conversion, 1994 IEEE International Solid-State Circuits Conference pp. 226–227. Funt, B., Barnard, K. & Martin, L. (1998). Is machine colour constancy good enough?, 5th European Conference on Computer Vision pp. 445–459. Funt, B. & Finlayson, G. (1995). Color constant color indexing, IEEE Trans. on Pattern Analysis and Machine Intelligence 17(5): 522–529. Gerritsen, F. (1975). Theory and Practice of Color, Studio Vista. Henderson, S. T. (1977). Daylight and its spectrum, second edn, Adam Hilger Ltd, Bristol. Huang, W.-C. & Wu, C.-H. (1998). Adaptive color image processing and recognition for varying backgrounds and illumination conditions, IEEE Trans. Industrial Electronics 45(2): 351–357. Iqbal, M. (1983). An Introduction to Solar Radiation, Academic Press Canada, Ontario. Kodak CCD Primer KCP-001 (1999). Technical report, Eastman Kodak Company Microelectronics Technology Division. Kremens, R. (2001). Image processing system applications: from barbie cams to space telescopes, Technical report. Litwiller, D. (2001). CCD vs. CMOS: Facts and fiction, Photonics Spectra pp. 154–158. Loose, M., Meier, K. & Schemmel, J. (2001). A self-calibrating single-chip CMOS camera with logarithmic response, IEEE Journal of Solid-State Circuits 36(4): 586–596. Lynch, D. K. & Livingston, W. (1995). Color and Light in Nature, Press Syndicate of the University of Cambridge, Cambridge. Nakamura, J. (2006). Image Sensors and Signal Processing for Digital Still Cameras, CRC Press. Newton, I. (1730). Opticks or a treatise of the reflections, refractions, inflections and colours of light, fourth edn, Oxford University Press, London. Parisi, A. V., Sabburg, J. & Kimlin, M. G. (2004). Scattered and filtered solar UV measurements, Kluwer Academic publishers, Netherlands. Poynton, C. (1996). A Technical Introduction to Digital Video, John Wiley & Sons. Stone, M. C. (2003). A Field Guide to Digital Color, A K Peters Ltd. Trussell, H. J., Saber, E. & Vrhel, M. (2005). Colour image processing (basics and special issue overview), IEEE Signal Processing 22(1): 14–22. Yadid-Pecht, O. & Fish, A. (2004). Active Pixel Sensor Design - from pixels to systems, Kluwer.