Visual Support for Programming-in-the-large. Vaclav Rajlich. Nicholas Damskinos. Panagiotis Linos. Joao Silva. Wayne State University. Detroit, MI 48202.
Visual Support for Programming-in-the-large Vaclav Rajlich Nicholas Damskinos Panagiotis Linos Joao Silva Wayne State University Detroit, MI 48202 Wafa Khorshid Eastem Michigan University Ypsilanti, MI 48197
ABSTRACT cated ways. This makes it difficult for the prcgrammer to memorize complex interrelationships among program parts. Moreover, textual represer tation of a program does not reveal such informztion right away. Programmers, like most people, think in terms of pictures. To understand a program, a programmer translates it into a graphicitl conceptualization in hisher mind. To modify a program, the programmer has to modify the graphical conceptualization in hisher mind and then translate it back to the textual form. T h s process is repeated several times until program maintenance is complete [2]. One way to alleviate this problem is to create a tool which relieves the programmer from the burden of keeping the graphical conceptualization of a program in hisher mind. Such a tool will maintain the graphical representation of the program and provide the programmer with a visuiil editor to build and modify the program. VIFOi is a tool aimed to provide such support.
In this paper, a brief description of the VIFOR (Visual Interactive FORtran) environment is given. VIFOR is based on a simple, but effective data model of Fortran programs. The model contains three entity classes and three relation classes only. Programs can be displayed and edited in two forms: the traditional one (i.e. code) and in the visual form. VIFOR contains transformation tools for both directions, i.e. from code to visual form and from visual form to skeletons of code. Hence, it is suitable for reverse engineering and maintenance of existing code. Specially designed browsers implement the graphical interface.
1. Introduction It has been acknowledged that the maintenance of software is the most expensive part of the software life-cycle [l]. In order to modify a program, software maintainers have to understand the program. Understanding programs is one of the most time consuming activities in software maintenance. This is partially due to the fact that quite often the only reliable and available documentation is the source code of the program itself. But programs are complex, abstract objects. They include many components with many different attributes that are interrelated in compli-
2. VIFOR VIFOR (Visual Interactive FORtran) is a language centered programming environment [3 I. The distinguishing feature of VIFOR is the dala model which contains only three different classes of entities and three relations, yet it is able to support programming in a language as powerfit1 and universal as FORTRAN programming language.
This research was partially supported by the grant #20021734 of Chrysler Challenge Fund and Institute for Manufacturing of Wayne State University.
92
CH2615-3/88/0000/0092$01.00 0 1988 IEEE
Authorized licensed use limited to: IEEE Xplore. Downloaded on March 22, 2009 at 16:51 from IEEE Xplore. Restrictions apply.
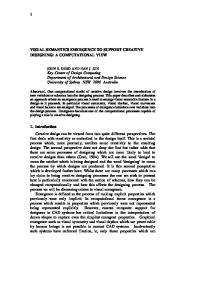
In VIFOR, a program can be represented in two different forms: the traditional one (code), or in the visual form. In the visual form, the program is represented by a graph consisting of icons and edges between icons. Figure 1 shows the graphical representation of a small program for a computerized telephone directory, where a person's telephone number is found by searching a database. Subroutines, functions, and commons are represented by rectangles, diamonds, and parallelograms, respectively. Notice that the graph in Figure 1 is laid out as two columns of entities. The left column consists of subroutines and functions, and the right column consists of commons. The arrows on the left represent the call relations among subroutines and functions (i.e. the call graph) and the lines in the middle represent the reference relations (i.e. the reference graph). We call this type of layout two column graph (abbreviated 2CG). Graphical interface is implemented the socalled browsers. Browsers are specially designed windows which provide the communication medium through which the user can invoke operations and get responses from VIFOR. Each browser is equipped with features like top panel, pull-down cascading menus, drawing area, scrollbars, and message area at the bottom. As the program grows larger, the graph gets larger and more complex. The graph may become difficult to read because of the large number of crossings, particularly for reference relations. To overcome this problem we have implemented two enhancement operations for 2CG: views and graph rearrangement.
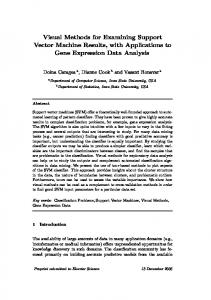
Views are subsets of the database which contain a particular structural information of the program. The need for views is supported by the fact that programmers usually are not interested in the complete structure of a large software system. At any given time, they need to see some crosssection that contains the entities relevant to a particular task. Views are a general and effective way to overcome problems of tracing and navigating through large database. Views are defined by using the buttons of the query panel in the upper part of the browser. In order to illustrate views, consider the view of Figure 1 which represents the entities of a complete program. The buttons "Complete" and "Ent" are highlighted in the top panel. All procedures, functions, commons, and all call and reference relations of the program are displayed. Another example of a view is in Figure 2, where the same program is displayed in a mixed mode (button "Mix" is highlighted). It displays not only entities and their relations "call" and "refer" as in Figure 1, but also the files (modules) to which all these entities belong . Finally in Figure 3, the same program is displayed in the module mode (button "Mod" is highlighted). It shows only the modules (files) which the program consists of and the call relationship among them . For further clarification of how queries work, consider the query of Figure 4. The query displays the program in entity mode (button "Ent" is highlighted), it represents call relation (button "Calls" is highlighted), and "depth" is indicated as "2". The result of this query is displayed in the drawing area of Figure 4. The view contains the focus entity MAIN, all subroutines and functions of depth 1 for call relation (i.e. SEARCH, READ-INPUT, DONE, and INIT-DATABASE), and all subroutines and functions of depth 2 for call relation (i.e. LESS, PRINT-MSG, EQUAL, and PRINT-INFO). The focus entity (MAIN) has been selected by the mouse. Similarly, views can be displayed using "called by" (inverse of "calls" and "refer" relations). Below is a brief description of the views appearing in the view panel which have not yet been explained. These are predefined queries which extract all the entities with a certain property *
3. Views The database of information about the program is based on a data model with three classes of entities and three types of relations. The three classes of entities are: process (i.e. subroutines and functions), commons, and source files (modules). The three types of relations are call, reference, and "belong to". Call and reference are represented graphically by arrows and lines, respectively. Relation "belong to" determines which subroutines/functions belong to which source file (module).
93
Authorized licensed use limited to: IEEE Xplore. Downloaded on March 22, 2009 at 16:51 from IEEE Xplore. Restrictions apply.
of these operations: add: adds an entity or a relation to the database.
Module displays all entities residing in a selected module. 0 Backlog is the collection of all the entities which have been introduced in the database but have not been defined yet. This query is particularly useful for top-down programming [4,51. Complete database displays all entities and relations of the program. Views can be either separated or appended to an existing view. Separate views display the result of a query in a newly created window. Appended views display the result of a query as a new part of a previously existing window. Appended views are powerful tools that help the user to navigate progressively through the database. 0
delete: deletes an entity or a relation. save: stores the complete database into a user specified file. 0 initialize: empties the content of the ERdatabase, so that the user may switch to ii different project or restart without exit from the environment. loud: restores the contents of a saved file. Graph-to-Code Operations: An icon in a graph is always associated with a code. For subroutine and function icons, the code is the body of thc subroutine or function. For common icons, it i,; the definitions of COMMON statements. Wherever appropriate, the user can display, create, or modify the code of an entity by invoking tht: define operation. When an entity is being defined for the first time, the system will generate a simple skeleton code. Code Operations: The user can edit source codc through text editing windows. VIFOR uses the vi editor, which is standard in UNIX. Emacs i,; being considered as a future alternative. Code-to-Graph-Operations: Program Analyzer identifies all entities and relations which appear in a source code, and then generates or modifie,; the database.
4. Graph Rearrangements To improve the readability of complicated graphs, VIFOR provides the following graph rearrangement operations: 0 The layout within a browser can be scaled down to make more entities and relations visible, or scaled up to provide a clearer view of the information displayed. 0 Icons can be moved to new locations within their column, so that fewer crossings or shorter lines are achieved. 0 Hiding all relations entering or leaving an entity is a method of temporarily factoring out redundant information. The complementary operation, unhiding, can restore hidden relations. 0 Highlighting the relations and icon of an entity can make them more prominent and easier to follow. Highlighted lines are thicker and can be of a distinct color. The colors are selected in the top panel by color-oriented buttons.
6. Maintenance VIFOR supports maintenance, modifications, and enhancements of already existing software. The relations stored in the database help the programmer to follow the ripple effects of tht: modifications of the code. In this section, wc! describe a modification of the telephone directory. Figure 5 shows the complete graph of the program along with the bodies of subroutinc: SEARCH and INIT-DATABASE. A binary search method is used to locate a key in the database. We want to alter the method into a hashing search. As a first step, we define a new function called HASH. Figure 6 shows the new ER-graph with the HASH function highlighted and its definition in the right window. Hash function is defined so that it returns an integer, which is used as an index in the database. When a key is searched for, it can be be found directly b i
5. Tools and Operations We can divide the operations of VIFOR into four groups: graph, graph-to-code, code, and code-to-graph operations. Graph Operations: These operations allow the editing of thp database content. Here is a sample
94
Authorized licensed use limited to: IEEE Xplore. Downloaded on March 22, 2009 at 16:51 from IEEE Xplore. Restrictions apply.
accessing it’s hash index. Afterwards, subroutines SEARCH and INIT-DATABASE must be redefined in order to incorporate the new algorithm. Figure 7 shows new definitions of SEARCH and INIT-DATABASE as modified by the user. Figure 8 shows the final ER-graph produced by Program analyzer.
7. History VIFOR has been an ongoing research project at the computer science department of Wayne State University since January 1986. Currently VIFOR staff includes six graduate research assistants and a faculty member. A prototype environment VIC which supports programming in C language was demonstrated at the National Computer Conference held in Chicago, June 15-19, 1987. VIFOR system is implemented in C language and it employs the X window management system. A current version of VIFOR runs on microVAX I1 GPX workstation running under the ULTRIX operating system.
REFERENCES [ l ] Lientz, B.P. and Swanson, E.B., Software Maintenance Management, Addison-Wesley, Reading MA, 1980. [2] Raeder, G., Survey of current Graphical Programming Techniques, IEEE COMPUTER, Vol. 18, NO. 8, pp. 11-25, August 1985. [3] Habemann, N., et al, Sofrware Development Environments, IEEE COMPUTER, Vol. 20, No. 11, pp. 18-28, November 1987. [4] Rajlich, V., Stepwise Refinement Revisited, J. Syst. Software, Vol. 5 No. 1, pp. 80-88, March 1985. [5] Rajlich, Refinement Methodology for Ada, IEEE Trans. on Software Engineering, Vol. SE-13, No. 4, April 1987.
95
Authorized licensed use limited to: IEEE Xplore. Downloaded on March 22, 2009 at 16:51 from IEEE Xplore. Restrictions apply.
t: 1 Figure 1. Graphical display of the telephone directory program.
.
- _._-._..-.-l.-.-l
~
Figure 2. Display of program entities and modules.
Authorized licensed use limited to: IEEE Xplore. Downloaded on March 22, 2009 at 16:51 from IEEE Xplore. Restrictions apply.
Figure 3. Display of program modules only.
4
-