0 0 prmt1. 0 1 prmt2. 0 2 prmt3. 0 3 prmt4 . . . . . . . ARTICULATORY. TABLE. AUDIO. VIDEO. A.lpc. Source. A. KOHONEN training chains of phonemes. Training.
VISUAL SYNTHESIS OF SOURCE ACOUSTIC SPEECH THROUGH KOHONEN NEURAL NETWORKS A.Lagana`, F.Lavagetto, A.Storace DIST-University of Genova, Italy
ABSTRACT
2. DATA REPRESENTATION
The objective of bimodal (audio-video) synthesis of acoustic speech has been addressed through the use of Kohonen neural architectures encharged of associating acoustic input parameters (cepstrum coe�cients) to articulatory estimates. This association is done in real-time allowing the synchronized presentation of source acoustic speech together with coherent articulatory visualization. Di�erent architectural solutions have been investigated and compared in terms of objective measures (estimation distortion) as well as of subjective evaluation (perception experiments).
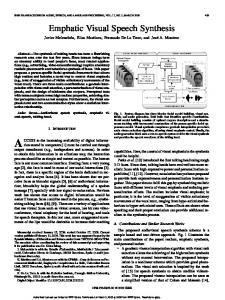
The speech signal has been sampled at 8 KHz and quantized linearly at 16 bits before being processed through the following steps: � spectral preemphasis; � segmentation into non overlapped frames of duration T = 20 ms; � linear predictive analysis of 10-th order; � power estimation and computation of the rst 12 cepstrum coe�cients; � normalization of the cepstrum coe�cients to the range [-1, 1]. The normalized cepstrum vectors are then presented in input to the conversion system based on Kohonen neural network, as explained in the next section, trained to provide estimates of speci c articulatory parameters. In order to understand how many articulatory parameters were necessary to allow a faithful visual synthesis of speech, a very large database has been collected consisting of 25 minutes synchronous video and audio stored in digital D1 format. Through the appropriate use of a mirror, two orthogonal views (frontal and side) of the speaker's face have been recorded. PAL video frames have been suitably subsampled to obtain a 25 frame/sec YUV sequence at a 352x288 pixel resolution, 24 bpp, 8 bit/component. D1 digitized audio (mono), sampled at 48 KHz and quantized at 16 bit/sample, has been low-passed and subsampled 1:6 to 8 KKz. The total required storage was 11.5 Gbyte composed of 11.4 Gbyte for video plus 144 Mbyte for audio. To simplify the extraction of the articulatory parameters from the video frames, the speaker's face was conditioned by means of lipstick and white markers placed in correspondence to the tip of the nose and of the chin. The mouth model which has been employed, sketched in Figure 1, is de ned by a vector of 10 parameters (LC, lup, Lup, dw, w, W, LM, h, H, teeth) extracted from the frontal view plus the protrusion parameter (protr) extracted from the side view. Cross-correlation between these parameters has been estimated in order to identify inter-dependencies and provide a basis of independent parameters. From the experimental
1. INTRODUCTION A bimodal (audio-video) corpus in italian has been recorded and has been used to train and test the system. Through suitable analysis algorithms, the acoustic component of the corpus has been segmented in 20 ms intervals and represented in terms of the rst 12 cepstrum coe�cients while each frame of the visual component (25 Hz) has been processed and represented in terms of 5 mouth articulatory parameters. The Kohonen networks have been trained with acoustic data to clusterize speech in the cepstral domain while the articulatory association (estimation) has been obtained eventually by associating to each neuron a representative descriptor. In order to take into account forward and backward coarticulation, time acoustic-articulatory correlations have been modeled according to di�ent criteria leading to di�erent algorithms and to competing architectures. In consideration of the particular application, oriented to the integration of conventional acoustic speech information with coherent articulatory cues, evaluation and quality assessment have been carried out through subjective experiments with normal hearing and hearing impaired persons. This has been done in cooperation with FIADDA, the italian Association of the parents of deaf children, within a the european TIDE project SPLIT. Many application scenarios can be gured out like in speech rehabilitation, training to speechreading, telephone communication for the deaf, multimodal interfaces, ecc.
nose dw LC
lup
Lup
w
h
teeth
H
LM
W
chin
Figure 1: Articulatory parameters extrected from the frontal view. outcomes it has been decided to use a basis of 5 parameters (LM, H, W, dw, Lup). TIME Correlation AUDIO
Cepstrum
A.lpc
LPC
t-2
lpc1
t-1
lpc2
t t+1
lpc3
t+2
lpc5
Source
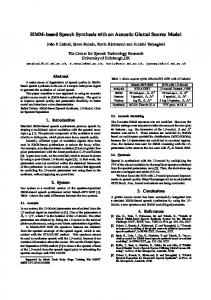
In other terms, past and future acoustic information must be processed in order to provide reliable articulatory estimates. Three competing architectures have been proposed, based on 2-dimensional Kohonen networks, each of them embedding a di�erent approach to time-correlated speech classi cation. The rst of them, sketched in Figure 2, is called "Augmented Clustering Map" (ACM) since it processes augmented input vectors obtained as the concatenation of time consecutive speech vectors. The second architecture, shown in Figure 3, is called "Multistep Clustering Map" (MCM) and consists of one initial Kohonen map, encharged of clustering incoming speech vectors, whose ouputs are then collected to form time vectors which are then fed into a second clustering map. The third and last structure is the one shown in Figure 4, named "Trajectory Clustering Map" (TCM), whose neurons contain a multidimensional array suited to associate visemes no more to single cepstrum vectors but to their trajectories in time. As explained in the follow, each map implements its own particular mechanism for analyzing the time correlation among consecutive speech frames before associating the viseme estimation. Each network has been trained on the same corpus with a xed memory of 5 speech frames (5x20=100 ms) for the coarticulation modeling in order to compare homogeneously their performances.
lpc4
AUDIO
Cepstrum
A.lpc
LPC
A
training KOHONEN simple phonemes
Training Evaluation
A.nvs
Source
Extraction of Video VIDEO Parameters
Training Evaluation
training KOHONEN chains of phonemes
A Extraction of VIDEO
Video Parameters
TIME Correlation A.prmt
A.prmt ARTICULATORY
TABLE 0 0 prmt1 0 1 prmt2 0 2 prmt3 0 3 prmt4 .......
ARTICULATORY
A.tab
Algorithms for Articulatory Table
TABLE 0 0 prmt1 0 1 prmt2 0 2 prmt3 0 3 prmt4 .......
A.tab
Algorithms for Articulatory Table Training Evaluation
t-2
00
t-1
10
t
11
t+1
22
t+2
18
training KOHONEN chains of phonemes
Figure 2: "Augmented Clustering Map": example of neural
Figure 3: "Multistep Clustering Map": example of neural
3. SPEECH CLASSIFICATION
3.1 The "Augmented Clustering Map"
architecture for the visemes estimation from speech.
Di�erently from previous approaches [1], based on the direct estimation of the articulatory parameters of the mouth from speech, an intermediate stage of acoustic classi cation is here introduced for driving the following and nal stage of visemic estimation. The algorithmical structure which has been choosen is the Kohonen self- organizing map, wellknown for its good performances in pattern clustering and classi cation [2]. Considering the fundamental role played by the complex mechanisms of foward and backward coarticulation, a time correlated analysis of speech cannot be avoided but, on the contrary, strongly encouraged.
architecture for the visemes estimation from speech.
In this scheme 5 cepstrum vectors, corresponding to 5 consecutive speech frames of 20 ms each, are ordered together to form an augmented 60-dimensional vector which is then input to the map. In this way the Kohonen network clusterizes vectors in the augmented space thus modeling the time dependence. After having trained the map with the augmented cepstrum vectors computed on the audio component, the map is addressed one last time with the augmented vectors for associating articulatory estimates to each neuron. This is achieved
Cepstrum
AUDIO
training KOHONEN simple phonemes
A.lpc
LPC
3.2 The "Multistep Clustering Map"
Training Evaluation
Source
A Extraction of Video
VIDEO
A.prmt
Parameters
TIME Correlation
Algorithms for Articulatory Table
t-2
00
t-1 t
10 11
t+1
22
t+2
18
ARTICULATORY
TABLE
Data
Organization
A.tab
0 0 prmt1 0 1 prmt2 0 2 prmt3 0 3 prmt4 .......
in
Tree Structure
Figure 4: "Trajectory Clustering Map": example of neural architecture for the visemes estimation from speech.
In this scheme, on the contrary, the rst Kohonen stage is encharged of clustering speech vectors in the 12-dimensional cepstrum space with no concern on time correlation and on articulatory estimation. The coordinates of the most responding neurons at time t-2, t-1, t, t+1 and t+2, form 10-dimensional vectors which are then input to the second Kohonen stage where they are clustered and associated to articulatory parameters as described in the previous subsection. An example of the achieved performances is shown in Figure 6 with reference to the parameter H. 1 Real_H Estimated_H
0.8
by storing into the most responding neuron the mouth descriptive vector (see Figure 1) associated to the central speech frame among the 5 which compose the augmented vector. This means that the visemic information is correlated not only to the current speech frames but also to the two previous and to the two following speech frames. After all the video component of the corpus has been processed, each neuron of the map is associated to a list of articulatory vectors which are referred to the acoustic class it identi es. After averaging the vectors in each list, neurons are nally associated to speci c articulatory vectors which represent corresponding visemes. An example of the achieved performances is shown in Figure 5 with reference to the parameter H.
0.6 0.4 0.2 0 -0.2 -0.4 -0.6 -0.8 -1 0
20
40
60
80
100 120 t (20msec)
140
160
180
200
Figure 6: Multistep Clustering Map: original and estimated parameter H. The rst 80 time segments are referred to a word included in the training set while the last segments refer to a word outside the training set.
1 Real_H Estimated_H
0.8
3.3 The "Trajectory Clustering Map"
0.6 0.4 0.2 0 -0.2 -0.4 -0.6 -0.8 -1 0
20
40
60
80
100 120 t (20msec)
140
160
180
200
Figure 5: Augmented Clustering Map: original and estimated parameter H. The rst 80 time segments are referred to a word included in the training set while the last segments refer to a word outside the training set.
In this last scheme each neuron is no more associated to a simple list but to a 5-dimensional array where articulatory vectors are stored. Neurons in the map are numbered sequentially. Considering 5 consecutive cepstrum vectors, the array associated to the neuron which most reponds to the rst vector is choosen. The number of the neuron which most respond to the second, third, fourth and fth vectors select one element in the array where the corresponding articulatory parameters are stored. An example of the achieved performances is shown in Figure 7 with reference to the parameter H.
4. CONCLUSIONS The curves plotted in Figures 5, 6 and 7 show clearly the typical performances achievable through the three competing architectures, in the sense it's evident how they behave di�erently in case of data extracted from the training set and
perimental results indicate that the synthetic lips animated by the estimated parameters are most of the time speechread with a success rate comparable to that achieved when lips are animated by true parameters (directly extracted from the corpus images).
1 Real_H Estimated_H
0.8 0.6 0.4
5. REFERENCES
0.2 0 -0.2 -0.4 -0.6 -0.8 -1 0
20
40
60
80
100 120 t (20msec)
140
160
180
200
Figure 7: Trajectory Clustering Map: original and estimated parameter H. The rst 80 time segments are referred to a word included in the training set while the last segments refer to a word outside the training set. of data outside the training set. The Augmented Clustering Map (ACM) and the Multistep Clustering Map (MCM) exhibit appreciable capability to generalize in constrast to the Trajectory Clustering Map (TCM) which learns "by heart" the training set but show poor generalization outside the training set. The computational complexity required for training the ACM is higher than in the case of MCM and TCM because of the higher dimensionality of the input vectors. On the other hand, the memory required by the TCM is far larger than in the case of ACM and MCM since a multidimensional array is required to store the articulatory information associated to cepstrum trajectories. As far as the MCM is concerned, the major advantage is the separation of two processing stages which can be optimized separately and the low computational and memory requirement while, on the hand, the major drawback is the presence of three non-linearities being the two networks themselves and the data domain tranformation (the rst network operates on cepstrum vectors while the second operates on topological vectors representing the coordinates of the most responding neurons in the rst). The major impairments, common to all the three architectures, are the still too high sensitivity (estimates are too unstable and do not reproduce the smoothness of the actual articulatory trajectories) and the still signi cant amplitude distortion in correspondence to articulatory peaks (positive and negative). In contrast, the slow dynamics (main modes of the articulatory trajectories), is tracked correctly. The subjective evaluation of the results has been carried out by using the articulatory parameters to animate synthetic lips on a computer monitor and by asking people to speechread the animation. Experiments are still in progress and no nal conclusion has been reached yet. Preliminary ex-
1. F. Lavagetto. Converting Speech into Lip Movements: A Multimedia Telephone for Hard of Hearing People, IEEE Trans. on RE. 3:1, pp. 90-102, (1995). 2. T. Kohonen. The "Neural" Phonetic Typewriter, Computer. pp.11-22, (1988).