Visualisation for Intrusion Detection Hooking the Worm Stefan Axelsson Department of Computer Science Chalmers University of Technology G¨ oteborg, Sweden
[email protected]
Abstract. Even though intrusion detection systems have been studied for a number of years several problems remain; chiefly low detection rates and high false alarm rates. Instead of building automated alarms that trigger when a computer security violation takes place, we propose to visualise the state of the computer system such that the operator himself can determine whether a violation has taken place. In effect replacing the “burglar alarm” with a “security camera”. In order to illustrate the use of visualisation for intrusion detection purposes, we applied a trellis plot of parallel coordinate visualisations to the log of a small personal web server. The intent was to find patterns of malicious activity from so called worms, and to be able to distinguish between them and benign traffic. Several such patterns were found, including one that was unknown at the time to the security community at large.
1
Introduction
Computer security addresses the problem of protecting computers and data against malicious attack. Several forms of protection have been devised. Many of these fall under the guise of separating data and computing resources from potential attack(ers) by devising some sort of perimeter protection. A fundamentally different approach to the computer security problem is to employ the principle of monitoring. By reason of analogy, the former methods try to erect a fence around the protected resources, and solve the problems of opening the fence in just the right way for those that are to have legitimate access. Monitoring and surveillance, seeks instead to enable the operator to detect malfeasors so that they may be rendered harmless. This paper explores the possibilities of employing a trellis plot of parallel coordinate visualisations to the log of a small personal web server. The aim being to enable the operator to tell apart the access patterns of automated (or semi automated) attacks and more normal, benign access patterns.
102
1.1
Stefan Axelsson
Intrusion Detection
An intrusion detection system (IDS for short) processes information about the monitored system, and looks for evidence of malicious activity. The information about the system is most often in the form of a log of the system activity. This log does not necessarily have to have been collected solely for security purposes. These logs are typically very large; e.g. Yahoo inc. reports that they collect on the order of five gigabytes of log data per day. A detector then processes these logs and raise the alarm when there is enough evidence that an intrusion or other computer security violation has taken place. The reader interested in intrusion detection is referred to the extensive literature in the field e.g. [DDW99,Amo99,Axe00b,Bac99]. An important problem with intrusion detection systems today, are a high number of false alarms [Axe00a]. This is perhaps not surprising if we make an analogy with the common burglar alarm. Burglar alarms operate under a very restricted security policy. Any activity whatsoever is suspicious. No door or window can be opened. No suspect heat sources, or movement may be detected, before the alarm is triggered. Intrusion detection systems on the other hand work on the assumption that the computer system is in full operation. Hence a lot of benign activity and processing is taking place. Thus, the analogy with a burglar alarm is not apt. 1.2
Worms
Worms (e.g. [Pfl97, pp. 179,192]) are self replicating programs that attack a remote computer system (often by exploiting some weakness) to gain access. They then transfer a copy of themselves to the subverted system and start running there. Once they are established in the subverted system the cycle begins anew, and the worm starts scanning for other systems to infect. Worms may or may not carry some sort of payload (logic bomb or otherwise) that perform an additional sinister task. The Code red worm [CER01a] for example, launched a denial-of-service attack against a fixed IP address (belonging to the whitehouse.gov web site) on the 20–27 of each month. Worms have spread far and wide in the last few years, with far reaching consequences. Often they are combined with viruses i.e. the worm has viral properties also, but not always. The names of the most successful worms have percolated up to the common consciousness, with instances reported widely in the press and other news media e.g. the outage of The New York Times servers when they were attacked by the Nimda worm [USA01]. Worms often exist in several variants, which are smaller or larger variations on the same basic theme. The Nimda worm is reported in five different variants in the wild [CER01b]. Finding different variants of worms, if and when they occur, is therefore interesting from a security perspective, since they may exploit new vulnerabilities that may yet not have been addressed, and for research into the spread of worms.
Visualisation for Intrusion Detection
1.3
103
Visualisation for Intrusion Detection
We previously pointed out the flaw in the analogy between the intrusion detection system and the burglar alarm. We propose that a better analogy from the world of physical security is found in the shoplifting scenario. In this scenario an ordinary burglar alarm would not do since there would be a multitude and mass of normal, benign activity taking place in the shop—the shopkeeper even encouraging this—and hence a substantial potential for false alarms. This situation is addressed by performing surveillance—i.e. human supervision—of the potential shoplifters. Often the human is too expensive to employ directly using his senses unaided, and therefore technology is brought to bear in the form of video cameras, video recorders, etc. By reason of analogy then, we wish to build; not a ’burglar alarm for the Internet,’ but a ’security camera for the Internet’ to coin a phrase. The security camera analogy taken literally leads to the idea of the application of visualisation to the problem of intrusion detection. We believe this will have a number of desirable effects, mainly that the site does not need as detailed a security policy as with pre-programmed intrusion detection systems (The operator can in effect ’make it up as he goes along.’), and that an understanding of the underlying security principles being violated is furthered.
2
The Monitored System
We have chosen to take the access log file of a small personal web server, that has been continuously available on the Internet for some months. This web server serves a small number of web pages from the home of the author, to the circle of his immediate family and close friends. This web server is perhaps not representative of the majority of web servers on the Internet in that it requires authentication for all accesses. This would of course make it relatively simple in some sense to sort the illegitimate access attempts from the legitimate ones, but we’ve chosen not to take the result codes of the operation into account in our visualisation, and therefore feels that the study of such a system could be generalised to include systems which do not require authentication. A perhaps more significant problem is that the web server does not have much in the way of legitimate traffic. It is small and personal, and is only accessed by a dozen people or so. One could argue that this could make illegitimate accesses stand out more, not having much in the way of legitimate traffic to ’hide’ in. Even so, since we are looking for worms that often account for the majority of the traffic on much larger web sites, we still think the study of such a small system worth while, even though it remains to be seen if the results from this study can be generalised to larger systems. It is interesting to note in this context that the accesses patterns on this webserver is similar to what would be seen on a honey pot webserver, i.e. a server set up for the sole purpose of drawing attacks to it in order to study them further.
104
Stefan Axelsson
The web server runs thttpd, a small, secure and fast web server written and maintained by Jef Poskanzer, see http://www.acme.com for more information. Thttpd does not at the time of writing have any known security vulnerabilities (and has in fact never had any). The log records (see appendix C for a few examples) from the web server contain the following fields: IP address This is the IP-address of the system the request originated from. Remote username This is ostensibly the username of the (remote) user that the request originated from. We know of no web browser (or other client) that divulges this information. Authenticated username The username the client provides authentication for. Thttpd (and other web servers) provide for authentication in the form of requesting a username–password pair from the originating web browser. If the authentication fails the attempted username is not logged, instead this field is left blank. Time The time and date the request was received. Http request The request string exactly as it was received the client. This is formed by the access method (GET, HEAD, etc), followed by the URL of the resource the client requested. Http status code The status code that was returned to the client. Unfortunately the full list of codes is too long to reproduce here. Noteworthy are the codes: 200 which denotes the successful delivery of the requested page, and 404 which signals the well known ’page not found’ error. Number of bytes This is the number of bytes that was sent in response to the request (if any). The HTTP response is not included in the count, only the actual page that was sent. Hence this value is blank for all erroneous requests. Referring URL If this request resulted from the user clicking a link on another web page, the client has the option of sending the URL of that web page (the ’referring’ page) as part of the request. Not all web browsers do this so this information is not always available. User agent The name of the client software, if divulged by same. Note that for compatibility reasons many browsers let the user modify the value sent, to be able to masquerade as using another browser than they actually do. Thus the log contains a maximum of nine degrees of freedom. In our data set this is reduced to eight, since no web client divulged the remote login name of the user, and hence this field is always empty. All the other fields have values for at least a subset of the records. The log contains some 15000 records, and begins in earnest on 25 Sept 2002. It ends on 1 Jan 2003, and thus covers some three months of activity. As a comparison, the web server log for the computer science department at Chalmers for the month of November 2002 contains on the order of 1.2 million accesses, comprised of circa 200 000 unique requests.
Visualisation for Intrusion Detection
3
105
Scientific Visualisation
Since computers do not have a visual form—that is interesting for our purposes anyway—we have to find some way of giving our log data ’body’, as it were. The problem of giving abstract data a tangible visible form is addressed by the field of information visualisation. Good introductions to this area can be found in [Spe01] and [CMS99]. Applying information visualisation to the problem of intrusion detection may seem obvious (at least in retrospect) but success is by no means assured. The main problem is one of scale. Most information visualisation techniques cannot in general handle the large amounts of data that we are faced with, at least not in a straight forward manner. On the order of a few thousands of data objects is the norm [Spe01]. Our security log data typically has multiple dimensions with no a priori dependent variables and is therefore multivariate in nature. Spence [Spe01, pp. 45] lists only a handful of methods for the visualisation of multivariate data. Of these we have chosen the tried and tested techniques of the parallel coordinate plot [Ins97] combined with a trellis plot in one variable [Spe01, pp. 168]. The main reasons for choosing parallel coordinate plots over the other methods were: – The visualisation does not give preference to any dimension at the cost of other dimensions. This is important if we don’t have any indication about which data may be more important from the point of view of making a successful visualisation of the data set. – Parallel coordinate plots can visualise data with more dimensions than the other methods. It is not unreasonable to visualise data with ten or even twenty dimensions. Most of the other available methods strain when faced with four. As we shall see this turns out to be less important to us as we will reduce the data set to five dimensions. Since our original data set contains eight degrees of freedom, and it wouldn’t be unreasonable to visualise them all in an operational setting, the ability to visualise many dimensions is still an important consideration in choosing the visualisation method. – The visualisation methods lends itself to trellis plots, i.e. where we make a plot of plots (see below), in one of the variables. This is an effective method in seeing trends in higher dimensional data, when one variable has been singled out, in our case to group the requests. Not all the other methods lend themselves to trellis plots as well as the parallel coordinate plot, if at all. – The parallel coordinate plot is very generally applicable; it can handle both continuous and categorical data (though admittedly some of the key benefits are lost then) and it can be used to both see statistical correlations between data points, and as a more general profile plot, where the appearance of the graph itself (rather than the curve forms as in an ordinary x-y scatter plot) can be used to identify features. We will use the parallel coordinate plot in the latter capacity.
106
Stefan Axelsson
– The last, but by no means the least, of our considerations is that the parallel coordinate plot is well researched and the theory around it somewhat more mature than is true of many of the alternatives. 3.1
The Parallel Coordinate Plot
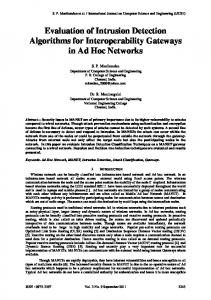
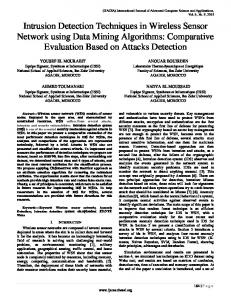
We have used the tool Spotfire to make the parallel coordinate plot, more information can be found at http://www.spotfire.com. A parallel coordinate plot is prepared by taking each data point and projecting it as a line joining the components of the vector onto a set of parallel coordinate axes. This form of visualisation does not only let the viewer learn about the dependencies between the variables, but also lets the viewer quickly see emerging patterns, and compare different datasets for similarities and differences [Ins97]. Figure 1 illustrates the case where 68 different points in eight dimensional space have been mapped onto (eight) parallel coordinate axes. In this case the dataset was chosen by limiting the log file from our webserver to the first 68 data points. We choose the eight dimensions that had data. They are in order in the figure: Date The date and time the request was made. In this case the data has been limited by selection, and hence the available dates only cover a small percentage of the axis. Spotfire doesn’t rescale the axis when the visible data is limited in this way, to preclude the effect where abrupt scale changes makes the user lose his orientation as different ranges of data are selected. Note the date slider, in the query devices sidebar, that has been manipulated to select the narrow range of records that are displayed. Remsys/Request/Url This variables are imported as strings, lexicographically sorted, and plotted as categorical data. Authuser The username of an authenticated user, or the minus sign if no authentication has been performed. Note the check boxes corresponding to the two possible values in this dataset at the very top of the query devices side bar. Binned status The status (e.g. 404–not found ) that the request resulted in. This data was imported as integers. However the result codes aren’t integral per se—i.e. magnitude comparisons between the result codes 200 and 404 interpreted as the integers 200 and 404 respectively, makes little sense. Instead the result codes have been rescaled by being sorted into bins chosen so that each result code ended up in a bin of its own. This has transformed the integral data into categorical data which is plotted with each bin equidistant on the vertical axis. Bytes The number of bytes that were sent in response to the request. Imported as integers, and in this case the data has a magnitude as opposed to the status data. Spotfire has the ability to logscale such data (and many other possible scalings can be applied as well) should the user so chose. Useragent Typically the browser that made the request, if that information has been divulged. Imported as a string and hence treated as lexicographically sorted categorical data.
Visualisation for Intrusion Detection
Fig. 1. A simple parallel coordinate plot
107
108
Stefan Axelsson
For the purpose of this paper we will not use the possibility of finding correlations between data points using the parallel coordinate plot directly. However, just to hint at the possibilities; in figure 1 we see a strong inverse correlation between the result code (binned status) and the auth user field, indicating that the lack of authentication leads to “access denied” types of error codes, and vice versa. This is not surprising given that we’ve already stated that the webserver was configured to use authentication for all accesses. However, a similar plot was used by the author to discover that the access controls had been misconfigured at one time (after having upgraded the webserver) giving access to the world. It should be noted that while Spotfire does not mark the axes with any label indicating the range in absolute terms (only relative) hovering the mouse over any specific value displays the coordinate of the axis, as well as all coordinates for the closest record. Data points can also be marked and the data for the corresponding records displayed in the sidebar details-on-demand. Here we’ve marked one record (indicated by the thicker lines surrounding it) and the corresponding record is visible in the lower right corner of figure 1. Another sidebar (query devices) allows the user to dynamically adjust the data that is displayed, e.g. a continuous variable can have a slider (or other user selectable input element) that lets the user select the relevant parts of the data set for display. This sidebar is in the upper right corner in the figure. In this case it displays three examples of query devices: check boxes, a range slider and an item slider. As these are dynamic user interface properties, the awareness of the data this lends the user is of course difficult to give justice to in a paper. 3.2
The Trellis Plot
The trellis plot (or prosection matrix in the case of continuous data) is described in [Spe01, pp. 168]. It was originally used as a way of extending two dimensional scatter plots into three dimensions, without introducing a 3D view and all the complications that follow. Instead a pair of the variables is singled out and a plot of subplots is made, typically arranged in a triangular matrix, where the axes represent the different possible choices for the pair of parameters, and the x–y position in the matrix contains a plot of the other parameters for the x–y value of the singled out parameters. In the case of continuous data, it is of course not possible to make a continuum of of subplots. Instead a discrete number of ranges of values of the pair of parameters is chosen and the corresponding subplots made. In our case, we will chose only one variable, not a pair. We will single out the request string, which is already a categorical entity. Since we only make one parameter choice, the x–y position of the subplot within the trellis plot will not carry any further information—conceptually the subplots would be laid out in a linear fashion one after another—but are laid out on the plane so as to use screen real estate effectively. By doing the trellis plot this way we hope to find similarities in access patterns corresponding to different requests, and hence being able to visually cluster them corresponding to the entities (human
Visualisation for Intrusion Detection
109
or worm) that lie behind the particular requests in that cluster. This is also how we use the parallel coordinate plot as a profile plot. It is the profiles (’blobs’ if you will) that exhibit similarities between the different subplots and we will use these similarities to group the requests into clusters.
4
Visual Analysis of the Log File
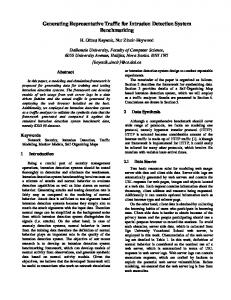
The aim of this investigation is to find support for the hypotheses that the web server was targeted by some of the more popular worms (that attacked web servers) during the period in question. We would also like to be able to tell apart the different types of worms, if any, and also to differentiate between the access patterns made by worms, and those made by others, i.e. more or less ordinary users. We intend to perform this by correlating different requests with each other and see if they cluster into patterns of activity that can be distinguished from each other, both in terms of distinguishing benign accesses from malicious, but also the various malicious accesses from each other. We feel justified in assuming that such differences will be present, e.g. Feinstein et. al. [FSBK03] reports differences in the distributions of source IP addresses between automated denial-of-service type attacks and benign traffic. These differences are significant and enables the attacked site (or intervening router) to differentiate between these types of traffic based on source IP address alone. Since our web server requires authentication it would be natural to divide access into allowed and denied as a first step, but as we we have mentioned earlier; since most web servers aren’t configured this way, we’ll refrain from using this data. Furthermore, since we don’t see how this would allow us to tell different kinds of worms apart, another approach is necessary. Attack of web servers typically have to do with exploiting weaknesses in the web servers handling of input data, either by having the server misinterpret it, doing something the designers never intended, or by triggering a buffer overrun, thereby allowing the attacker to take control at a lower level. Since the only real source of input data is the request the web client (browser/worm) makes, it is (as we mentioned earlier) natural to make the visualisation pivot on the request. We’ve already mentioned that one way of accomplishing this—using Spotfires parallel coordinate plot—is to make a trellis plot of the log data, with the request being the controlling variable. In figure 2, a specific parallel coordinate plot has been made for each of the unique request strings (59 in total), i.e. the request string has been held constant, and all data pertaining to other requests have been filtered out in each of the 59 plots. As a consequence the request string was removed from the subplots themselves as it wouldn’t add any useful information. In fact it would have detracted from the similarities of the plots since it would have been different for each of the subplots.
110
Stefan Axelsson
Fig. 2. A trellis of parallel coordinate plots
Visualisation for Intrusion Detection
111
In order not to taint the results of the investigation with data that pertains to the success or failure of authentication, we’ve reduced the dataset to the following four variables: Date, Remsys, Url and Useragent. The variables Authuser, Status and Bytes had to be removed since they tainted the experiment by leaking information (directly or indirectly) about the success or failure of the authentication. Removing data from the visualisation actually strengthens the results of the experiment in that we remove security relevant information, making the task more difficult. In an operational setting we most likely would not perform this reduction.
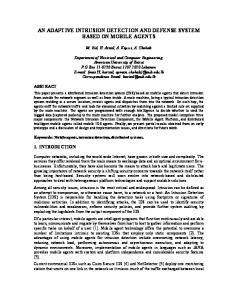
Fig. 3. A plot of the “Code-red” worm access pattern
To illustrate the concept in greater detail; figure 3 is an enlargement of the plot marked ’3’ in figure 2. The axes are labelled with the respective variable.
5
Results of the Investigation
Even a quick glance at figure 2 reveals four interesting patterns (marked 1–4 in the figure). Looking closer at the individual plots we can see that they originate
112
Stefan Axelsson
from a large number of systems, and dates. They are also comprised of a lot of repetitive accesses (i.e. a large number of records). Other patterns can also be identified. They look markedly different even ignoring the fact that they are comprised of much fewer accesses. Even without knowing the contents of the web site, it’s is difficult to believe that there would be four sets of pages that would give rise to such access patterns. Indeed, the four patterns are quite distinct when compared to the rest of the subplots of the trellis plot. If we draw on knowledge about the contents of the website the game is immediately up. There are one or two different additional suspicious looking candidates but viewing the request themselves gives that game away. It is not unreasonable to view the requests to eliminate suspects; we envision this method as mainly useful for the system administrator of the site, i.e. someone that is familiar with the site and and manner in which it is used. Indeed someone who was not familiar with the site could not make the sort of security policy decision on the spot that we alluded to in the introduction to the paper. The four suspicious request patterns may be indicative of worm activity and merit further investigation. Dissecting the clusters with regards to the number of different requests results in: Pattern Pattern Pattern Pattern
1 2 3 4
Six different requests. Ten different requests. One request. One request.
Viewing the access requests themselves (we’ve refrained from a detailed listing of all of them here to save space, but appendix A lists the six requests of the first pattern) and searching computer security sources we find evidence of two different instances of Nimda [CER01b] in patterns one and two. These two worms seems to have invaded the same types of systems, given the similarities in the IP-address ranges they originate from. Nimda is interesting in that it attacks web servers (Microsoft IIS) by either scanning for back doors left by other successful worms (Code red), or by so called Unicode attacks, where the URL is modified (certain characters escaped) to avoid subroutines in the web server that clean the request of certain ’dangerous’ characters e.g. characters that modify the search path to requested resource. The third pattern consists of only one type of access. It was found equally quickly in the literature, since it consists of one very long access request, designed to overflow a buffer in IIS [CER01a]. The Code red worm does not probe for a wide variety of weaknesses in IIS, as Nimda does, relying solely on the one buffer overflow to gain entrance. Comparing these two worms is illustrative in that we see a marked difference in the range of IP-addresses of infected systems. We presume that this is because Nimda can infect not only web servers, but also web clients (Microsoft Internet Explorer 5.0)—when the user visits a subverted web page, or be attached as an email virus. Thus home users, who presumably does not run web servers on their home computers frequently, are susceptible to infection by Nimda. Nimda
Visualisation for Intrusion Detection
113
then goes on to spread through all available means, including scanning nearby IP segments for vulnerable web servers and hence end up in our logs. Code red, on the other hand, relies solely on web server infection, and hence will infect other IP address ranges, that have not been reserved by Internet service providers who cater predominantly to the home users. Therefore we see such a marked difference in the access pattern. Pattern four is the pi`ece de r´esistance of the investigation. Neither the literature nor any of the major security information sources on the Internet at the time of investigation listed this particular access request in conjunction with any known worm. They did list several similar access requests (as they are part of larger class of IIS vulnerabilities), and indeed had we only looked at the access requests themselves—see appendix B—we might have missed that pattern four is different from the Nimda patterns since the request strings themselves look strikingly similar. The total number of accesses was small; only 71 access requests (about on the same order as for Code red, and an order of magnitude less than Nimda). Another odd characteristic was that they were not repeated from the same system twice (with one or two exceptions). We concluded that we were either dealing with a careful worm writer, or perhaps not even a worm at all, but rather the activities of so called script kiddies, who follow a pre made recipe found somewhere on the Internet ’underground.’ As far as we could tell this was a new type of worm, or a new type of intrusive activity. In preparing this paper a very detailed search of the available information sources revealed that these access requests had in fact been spotted earlier and identified as being the product of the manual application of the ’cracking tool’ sfind.exe [Jel02]. This tool is employed by the pubstro movement [Bra], that break into web and file servers in order to build a network of computers with which to distribute software copied in breach of copyright (so called warez ). We were justified in our observation that the access requests were very similar to Nimda and may have been mistaken as such had we only looked at the access requests in isolation. Indeed many system administrators let this particular activity go unnoticed mistaking it for an instance of Nimda [Jel02].
6
Discussion
A sticking point in discussing the applicability of these results is the issue of scalability of the method demonstrated here. The log file we investigated has only 59 unique requests, and as earlier pointed out; more realistic log files from larger installations can contain as much as 200 000 unique requests. The method of inspecting the requests directly, using a trellis plot, as we have done here is unfeasible when the number of unique requests is as large as 200 000. We conjecture that a data set of not much more than on the order of 100 unique requests could be investigated using the method developed here. We see two ways of addressing this problem to enable this method to scale to larger data sets.
114
Stefan Axelsson
The first is to reduce the number of requests before applying the visualisation. One method of doing so could be to apply some form of anomaly detection to the requests, sorting out unusual requests, and then visualising the output from the anomaly detection system to. This would allow us to tell apart the malicious accesses from the inevitable false alarms that would creep into the output from the anomaly detection system. An advantage of such an approach [Axe00a] is that it would allow the anomaly detection system to be tuned so that the number of false alarms were relatively high—and hence the likelihood of detection would be correspondingly higher—since we would not observe the output directly, but use it as input for our visualisation method. The other approach (perhaps most realistically used in conjunction with the first) is to reduce the number of unique requests by doing stepwise elimination by first identifying two or more similar patterns and then combining them into one pattern (sub plot). Hereby iteratively reducing the number of subplots until it is small enough that an overview of all of them can be made, analogous with what we have performed in this experiment.
7
Conclusion
We have demonstrated that worm activity can be detected and analysed by applying a trellis plot of parallel coordinate visualisations on the log of a small web server. The different requests made by worms can be correlated to the particular type of worm making the requests. Furthermore, the clusters formed by worm requests are markedly different from the clusters formed by benign requests. The visualisation was successful even though the number of data points visualised was larger than what is generally considered the limit for such methods. Four different worm (or worm like) activities were found. Two of these were found to be indicative of the Nimda worm, one of the Code red worm, and the last of a then largely unknown malicious activity, later identified as emanating from the manual application of the tool sfind.exe.
8
Related Work
There have been a few attempts at bringing visualisation to the field of intrusion detection. The first instance of mention in the literature is [VFM98]. This work has the nature of a position paper on a theoretical model for visualising the security state of a system. No argument is presented how this should be accomplished (i.e. the security state of the system be determined), instead the proposed the visual model (named spicule) is presented and developed. More recently Erbacher et. al. [EWF02] have presented work building on the previous work by Frincke et. al. [FTM98]. This work is based on encoding information about network traffic and alarms from a network of intrusion detection sensors as glyphs onto a stylised map of the network. As such their approach is very different from ours, in that we don’t map the traffic as such, but rather try
Visualisation for Intrusion Detection
115
and visualise meta data from the application layer in a manner that makes the dependencies between the underlying variables apparent. A different tack from that of Erbacher was taken by Theo et. al. [TMWZ02]. They visualise communication between pairs of routers on the Internet using the BGP (Border Gateway Protocol) routing protocol. Their choice of problem and visualisation techniques are different from ours, and they do not delve as deeply into the analysis of the security problems they detect (they are not as clearly security problems as ours), but they do visualise a greater amount of data more compactly than we do and still manage to detect anomalies in the BGP traffic.
9
Future Work
This investigation has really only scratched the surface of both what security relevant information is hiding in data sets such as this and of what visualisation in general, and how parallel coordinate plots in particular can be brought to bear to extract it. Also, the data set itself could be expanded with more realistic traffic, and more advanced simulated attacks.
10
Acknowledgements
We would like to thank Spotfire inc for letting us use ’Spotfire Decision Site.’ The valuable discussions with, and support from, my supervisor Prof. David Sands, and my research colleague Dr. Rogardt Heldal is also gratefully acknowledged. We would also like to thank the anonymous reviewers and in particular Prof. John McHugh for their helpful comments and support.
References [Amo99]
Edward Amoroso. Intrusion Detection. intrusion.net books, P.O. Box 78, Sparta, New Jersey 07871, 1999. http://www.intrusion.net. [Axe00a] Stefan Axelsson. The base-rate fallacy and the difficulty of intrusion detection. ACM Transactions on Information and System Security (TISSEC), 3(3):186–205, 2000. [Axe00b] Stefan Axelsson. Intrusion-detection systems: A Taxonomy and Survey. Technical Report 99–15, Department of Computer Engineering, Chalmers University of Technology, SE–412 96, G¨ oteborg, Sweden, March 2000. [Bac99] Rebecca Bace. Intrusion Detection. Macmillan Technical Publishing, first edition, December 1999. ISBN 1-57-870185-6. [Bra] Richard Braithwaite. The ’pubstro’ Phenomenon: Robin Hoods of the Internet. Avaliable as: http://www.deakin.edu.au/infosys/docs/seminars/handouts/RichardBraithwaite.pdf Verified: 2003–07–24. [CER01a] CERT Advisory CA-2001-19 ’Code Red’ Worm Exploiting Buffer Overflow in IIS Indexing Service DLL. CERT Advisory by CERT/CC, Email:
[email protected], CERT Coordination Center, Software Engineering Institute, Carnegie Mellon University, Pittsburgh PA 15213-3890, U.S.A., 19 July revised 17 January 2001. http://www.cert.org.
116
Stefan Axelsson
[CER01b] CERT Advisory CA-2001-26 Nimda Worm. CERT advisory by CERT/CC, Email:
[email protected], CERT Coordination Center, Software Engineering Institute, Carnegie Mellon University, Pittsburgh PA 15213-3890, U.S.A., 18 September revised 25 September 2001. http://www.cert.org. [CMS99] Stuart K. Card, Jock D. MacKinlay, and Ben Shneiderman. Readings in Information Visualization—Using Vision to Think. Series in Interactive Technologies. Morgan Kaufmann, Morgan Kaufmann Publishers, 340 Pine Street, Sixth Floor, San Fransisco, CA 94104-3205, USA, first edition, 1999. ISBN 1-55860-533-9. [DDW99] Herv´e Debar, Marc Dacier, and Andreas Wespi. Towards a Taxonomy of Intrusion-Detection Systems. Computer Networks, 31(8):805–822, April 1999. [EWF02] Robert F. Erbacher, Kenneth L. Walker, and Deborah A. Frincke. Intrusion and Misuse Detection in Large-Scale Systems. Computer Graphics and Applications, 22(1):38–48, January 2002. [FSBK03] Laura Feinstein, Dan Schnackenberg, Ravindra Balupari, and Darrell Kindred. Statistical Approaches to DDoS Attack Detection and Response. In Proceedings of the DARPA Information Survivability Conference and Exposition, page 303. IEEE Computer Society, IEEE, 22–24 April 2003. [FTM98] Deborah A. Frincke, Donald L. Tobin, and Jesse C. McConnell. Research Issues in Cooperative Intrusion Detection Between Multiple Domains. In Proceedings of Recent advances in intrusion detetection RAID’98, 1998. [Ins97] Alfred Inselberg. Multidimensional Detective. In Proceedings of InfoVis’97, IEEE Symposium on Information Visualization, pages 100–107. IEEE Information visualisation, IEEE, 1997. [Jel02] Peter Jelver. Pubstro-hacking—Systematic Establishment of Warez Servers on Windows Internet Servers. Avaliable as: http://www.esec.dk/pubstro.pdf Verified: 2003–07–24, 23 July 2002. [Pfl97] Charles P. Pfleeger. Security in Computing. Prentice Hall, second edition, 1997. ISBN 0-13-185794-0. [Spe01] Robert Spence. Information Visualization. ACM Press Books, Pearson education ltd., Edinburgh Gate, Harlow, Essex CM20 2JE, England, first edition, 2001. ISBN 0-201-59626-1. [TMWZ02] Soon Tee Teoh, Kwan-Liu Ma, S. Felix Wu, and Xiaoliang Zhao. Case Study: Interactive Visualization for Internet Security. In Proceedings of IEEE Visualization 2002, The Boston Park Plaza hotel, Boston, Massachusetts, USA, 27 October to 1 November 2002. IEEE Computer society. [USA01] ’Ny Times’ Outage Caused by Nimda virus. http://www.usatoday.com/tech/news/2001/11/01/new-york-times-outage.htm, 1 December 2001. Verified 2003–04–11. [VFM98] Greg Vert, Deborah A. Frincke, and Jesse C. McConnell. A Visual Mathematical Model for Intrusion Detection. In Proceedings of the 21st National Information Systems Security Conference, Crystal City, Arlington, VA, USA, 5–8 October 1998. NIST, National Institute of Standards and Technology/National Computer Security Center.
Visualisation for Intrusion Detection
A
117
Nimda Example
These are the six different requests made by pattern number one in figure 2: "GET /MSADC/root.exe?/c+dir HTTP/1.0" "GET /_vti_bin/..%255c../..%255c../..%255c../winnt/system32/ cmd.exe?/c+dir HTTP/1.0" "GET /c/winnt/system32/cmd.exe?/c+dir HTTP/1.0" "GET /d/winnt/system32/cmd.exe?/c+dir HTTP/1.0" "GET /scripts/root.exe?/c+dir HTTP/1.0" "GET /scripts/..%255c../winnt/system32/cmd.exe?/c+dir HTTP/1.0"
B
Requests Made by the Elusive Fourth Class
This is the request made by the elusive pattern number four in figure 2. Compare the similarity with the last request made in appendix A. "GET /scripts/..%255c%255c../winnt/system32/cmd.exe?/c+dir HTTP/0.9"
C
Logfile Example
This section contains a few records of the webserver log file: 213.37.31.61 - - [25/Sep/2002:17:01:56 +0200] "GET /scripts/..%%35c../ winnt/system32/cmd.exe?/c+dir HTTP/1.0" 404 - "" "" 172.16.0.3 - stefan [25/Sep/2002:19:28:28 +0200] "HEAD /sit3-shine.7.gif HTTP/1.1" 304 2936 "http://server/" "Mozilla/5.0 (X11; U; Linux i686; en-US; rv:1.1) Gecko/20020827" 172.16.0.3 - - [25/Sep/2002:19:28:46 +0200] "GET /pub/ids-lic.pdf HTTP/1.1" 200 615566 "http://server/pub/index.html" "Mozilla/5.0 (X11; U; Linux i686; en-US; rv:1.1) Gecko/20020827" 213.64.153.92 - - [25/Sep/2002:22:57:51 +0200] "GET /scripts/root.exe?/c+dir HTTP/1.0" 404 - "" ""