Visualising Tierra’s tree of life using Netmap Russell K. Standish1 and John Galloway2,3 1
Mathematics, University of New South Wales, 2052 Australia
[email protected], http://parallel.hpc.unsw.edu.au/rks 2 Netmap Analytics, 16/39 Herbert St, St Leonards, 2065 Australia
[email protected], http://www.netmap.com 3 University of Technology, Sydney Abstract We report on some preliminary results of a project using Netmap to visualise the network of genotypes generated in an evolutionary run of Tierra (the tree of life). Netmap is a sophisticated tool for visualising and analysing any dataset containing a network of graph structure. It has been successfully used for fraud detection in a number of commercial datamining projects, in the insurance and retail sector. It has the potential for detecting unusual relationships in the wide varieties of networks generated in Complex Systems.
Introduction Scientific Visualisation is an important tool for making sense of the large quantities of data generated by high performance and often highly complex computer models (Fosdick et al. 1996, Chapter 10). It couples the human visual system, which is a supreme pattern recogniser honed by millions of years of evolution, with the analysis process. Non-visual techniques, by contrast, always require a hypothesis which is tested by analytical techniques on the data. Consequently, non-visual analysis will miss what is not suspected. Network graphs are a crucial component to the understanding of complex systems (Green, Newth, & Kirley 2000). Network graphs are cartoon-like models of the system that capture formally the important properties of the system. Graphs have a rich set of properties that is still being actively explored(Albert & Barab´asi 2002). However, little work has been done to date on visualising network graphs generated by complex systems, aside from visualising Internet traffic1 , and in the social network community2 . Netmap3 is a tool for laying bare patterns and coincidences within large datasets of loosely related data. It 1
See http://www.caida.org for a discussion and links See, for instance, the network visualisation session in the Sunbelt series of conferences: http://www.inf.unikonstanz.de/algo/visone/SunbeltXX 3 http://www.netmap.com 2
has been used successfully for a number of years in detecting unusual patterns that may be evidence of fraud in datasets belonging to the insurance industry and the retail sector. The purpose of this project was to examine some datasets generated by complex systems models for interesting patterns that may have been missed by conventional analysis. As an initial foray into this subject, we examined a genebank dataset generated by the well known Tierra artificial life system.
Netmap Netmap displays the network data in a number of ways in a zoomable, panable and rotatable canvas. In the first mode of use, the network nodes are arranged around the circumference of a circle, with the edges drawn between the nodes. If a group of nodes is more interconnected from within, than without, it is split from the main ring, and displayed in a subsidiary ring outside. Such networks are termed emergent networks, and are indications of something interesting. More precisely, each node within the emergent network has more than 50% of its links to other members of the emergent network. An example of this display is shown in figure 2. The subsidiary ring in that case, are not emergent networks, but rather genotypes sorted according to the maximum population reached. A second visualisation method involves selecting a particular node, and displaying the nodes connected to it, and the ones connected to those and so on. The nodes within a particular column, all have the same hop-count from the selected node. Figure 3 shows an example of this kind of display.
Tierra Tierra (Ray 1991) is an artificial life system where short self-replicating programs running on a virtual CPU evolve and compete for survival. Part of the Tierra system, called the Genebanker records the organism’s program code (the genotype) as each new genotype arises. The genotypes are written to disk once it has exceeded
172
ALife VIII: Workshop proceedings
bits: 3 EX TC TP MF MT MB genotype: 0035aaa genetic: 0,35 parent genotype: 0044aaf 1st_daughter_a: inst: 259 instP: 259 1st_daughter_b: flags: 0 mov_daught: 35 breed_true: 1 2nd_daughter_a: inst: 260 instP: 260 2nd_daughter_b: flags: 0 mov_daught: 35 breed_true: 1 Origin: InstExe: 4775,573754 clock: 1000789270 Tue Sep 18 15:01:10 2001 MaxPropPop: 0.3859 MaxPropInst: 0.1174 MaxPop: 220 mpp_time: 4800,242218 MaxCpus: 0 ploidy: 1 Figure 1: Genebank record header for 0035aaa. It originated from 0044aaf at 4775,573754 instructions.
Figure 2: Ancestor-Descendent network. Genotypes are arranged anti-clockwise around the circle starting at the 3 o’clock position, according to the maximum population count (MaxPop field of the genotype header). A line connects a genotype with its parent genotype. Neutral mutations are shown in black, but its hard to make them out in this figure. The outlying rings show nodes that belong to a group with the same MaxPop count. /C=/NetMap/NetMap/queues/tierra/002.plt
Created : 16-Aug-2002 18:14:44
Plotted : 16-Aug-2002 19:11:55
a user specified threshold - either as a perecentage of the total memory of the computer, or a certain number of individuals. The thresholds can be set to zero so that every genotype is written to disk, including transitional forms between adaptive species, however this is usually not done, as the I/O then dominates the total runtime. A wide variety of behaviours evolved, with organisms making use of other organism’s copy loops (parasites), or stealing their CPU resources (hyperparasites) for example. Standish (1999; 2003) has developed a means of measuring the phenotypic properties of Tierran or-
ganisms, and in particular can determine if two Tierran genotypes (programs) correspond to the same phenotype (has the same behaviour when executed). Two genotypes with the same phenotype are said to be neutrally equivalent. He has found that around each genotype in genotype space, there are a large number of neutrally equivalent genotypes. It is therefore expected that neutral evolution(Reidys, Kopp, & Schuster 1997) (evolution of the genotype without phenotypic change) would be very important. In Tierra, with the amount of CPU resource allocated evenly to all organisms, selection favours shorter organisms that are less expensive to copy. Clearly, this effect limits the evolutionary potential of the system. By setting a parameter called SlicePow, CPU resources are allocated proportional to `SlicePow , where ` is the organisms length. SlicePow=1 corresponds to no selection bias as a function of length, and organisms can grow in size, but seemingly not in informational complexity (Standish 2003). In practice, organisms rapidly grow in size until a single organism occupies more than half of the soup, at which time it can no longer replicate, unless SlicePow is significantly less than 1. In this paper, we report on analysing a single dataset, with SlicePow=0.95. The largest genotype in the dataset was 6712 instructions long, but the most complex genotype was just over 100 instructions in complexity4 so evolution seemed to mostly involve adding “junk” code.
Results This project has only just started, and results only preliminary. We analysed the data from a single Tierra run of about 6 × 10⁹ executed instructions, with SlicePow=0.95, which resulted in 4848 genotypes recorded in the GeneBanker database. Phenotype analysis showed that there were 1376 distinct phenotypes amongst these. Each record in the GeneBanker database 4 Information Based Complexity is usually reported in bits — in Tierra, one instruction corresponds to 5 bits.
ALife VIII: Workshop proceedings
173 /C=/NetMap/NetMap/queues/tierra/004.plt Created : 16-Aug-2002 18:16:41
004
Plotted : 16-Aug-2002 19:11:59
0460aaa 0433aac 0649aaa 0324aab 0057aay 0462aaa 0215aad 0508aab 0507aaa 0296aab 0449aaa 0090abe 0385aac 0155aah 0155aag 0148aal 0041aap 0231aae 0533aab 0209aag 0342aab 0656aaa 0225aae 0077abp 0116aaq 0312aae 0173aak 0050abs 0125aav 0047aaq 0043aae 0128aau 0436aaf 0207aad 0045aar 0108abi 0045aaz 0040aai 0053abe 0066acb 0085abi 0472aaa 0046aaj 0040aah 0040aaj 0061abk 0070abt 0035abf 0249aac 0665aaa 0070aby 0029aac 0054abt 0031aad 0277aae 0048aap 0716aac 0560aab 0683aac 0571aab 0540aab 0304aab 0983aac 1378aaa 0734aac 0191aaf
0080aaa
0035aaa
0018aaa
0050aah
0041aae
0041aaa
0035aaz
0045aaj
0036aac
0053aaf 0070aal
0036aah
0047
aac
0059aac
0058
aaq 0050
abc
f
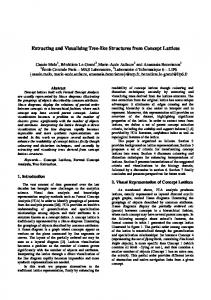
Figure 3: One of the most highly radiated family trees in the dataset. The ancestral genotype is 0367aab, shown at the top of the figure.
0053aaf 0070aal
aa
j
0017aab
50
m
0048aa
0062aa
n
0050ab a
0065aa
00
0045ab i
0045aau
0040aa e
0049aa n
j
b
0080aa
r
0064aa
aaq
0054ab
0045aau 0036aah
00 49 aa j
0050aam 0047aac 0059aac
cb
0054aaz
54 a
0055 aam 0054
aam
0059
0059
0048 aaa
00
0044 aac
0045ab 0040aa i 0048aa e 0062aa j f
aav
0041 aal
0049aa 0050ab n a
a
0054ab 0065aa j n
0014aa
w
0054aa
0049aa 0050aa j 0080aa q b
aal
0050
0045
aae
aav
aax
0063
0039 aaf
0054ac b 0058ab c 0064aa r
0044 0050 aac 0055 aav 0054 aam aaq
0045 0059 aal aam
0044
c
0039 0044 aaf 0041 aae 0048 aal aaa
0048 0059 aac 0063 aav aax
00 48 aa
Figure 4: Zoomed piece of figure 2 at the 3 o’clock position, showing 0080aaa and 0035aaa. Neutral mutations are marked in green, whereas non-neutral ones are shown in blue. has a header, which records (amongst other things) the immediate ancestor of that genotype, and the time of creation. An example header is shown in figure 1. Using the parent genotype field, a network was constructed linking the genotypes together. However, because Genebanker does not record all genotypes generated, but only those crossing a particular threshold, the network is not fully connected. In the future, we will probably restrict our analysis to genebank records where the threshold is set to zero so that the network is continuous. Netmap initially threw up a few oddities — quite a few node pairs were listed as being parents to each other, and there was even one case, shown in figure 5) of a triplet with 0169aae begetting 0123aau begetting 0123aav begetting 0169aae. At this stage, it is not clear how this situation came to pass, whether it is a bug in the Genebanker code, or a design feature. Figure 2 shows all the genotypes classified by their maximum population count (MaxPop), starting at the 3 o’clock position and progressing anti-clockwise. The outlying rings respresent sorting of the genotypes according to the maximum population reached by that genotype. The outer rings are coloured to indicate the different MaxPop classes. The first red ring are those genotypes with a zero value of MaxPop, namely those mentioned in the Parent Genotype field, but not otherwise represented in the Genebanker record. The next ring has a MaxPop of 1 and so on. At approximately the 12 o’clock position, a marked discontinuity occurs, indicating a threshold above which genotypes are adaptive, rather than being interim forms. Figure 4 shows a piece of this graph at the 3 o’clock position zoomed in. The most successful genotype is the ancestor 0080aaa with a MaxPop of 277 and the next is 0035aaa with a MaxPop of 220, both of which can be seen here. Figure 2 shows the neutral mutations in a different color to the non-neutral mutations, but it is rather hard to make out the neutral mutations. Figure 6 shows just
0035abf
0070aby
0031aad
0716aac
0683aac
0304aab
0047aad
0044aai
0036aaj
0035aay
0031aad2
0024aab
0023aaa
0018aab
0017aab
0012aaa
0209aag
0077abp
0050abs
0207aad
0040aai
0665aaa
0029aac
0277aae
0560aab
0540aab
0983aac
0734aac
0054abd
0053aav
0052aag
0049aay
0048aad
0044aam
0042aab
0036aaa
0035aat
0026aaa
0024aaa
0019aac
0018aaa
0014aaa
ALife VIII: Workshop proceedings
abh
0045aar
0049aab
0041aap
0054
0125aav
0051aak
0385aac
00 5 4 abg 0191 aae aae
0169
aav
aak 0047 acd 0080 aag 0036
Plotted : 16-Aug-2002 19:12:37
0123
Created : 16-Aug-2002 18:27:48
0312aae
0052abj
0191aaf
0342aab
0054aah
1378aaa
0231aae
/C=/NetMap/NetMap/queues/tierra/010.plt
0155aag
174
01
23
aa
u 00 00 67 00 88 ab 64 ab i aa u x
00 00 67 00 64 ab 01 79 aa n 00 08 aa z 54 aa y aa r v
00 00 79 7 01 1 ab 00 08 ab c 5 00 0 aa b 54 aa t aa k q
e
b
e aa
v 00
j
35
aa
aa
45
01
i
23
aa
45
aa v
0037 aaf
aa
00
00 37
44
00
00
t
35
aa
aa
45
u
00
00
aq
5a
35 aa z
4 00
00
45
ab
the neutral mutations. What is surprising is the very small role played by neutral evolution in this particular example. Most of the neutral evolution is centred on one genotype — 0035aaa shown at the 3o’clock position in Figure 6. This genotype features in figure 3 3 hops from the root, and has given rise to a large number of different genotypes, many of which are neutral. The neutral mutations are again shown in green.
aab
0038aa
abc
00
0038
0040aad
0041aaa
0040aae
aad
b
0041
0041aa
0106
0038aak
Figure 5: The three way cycle where 0169aae begets 0123aau begets 0123aav begets 0169aae again. Note that 0123aau and 0123aav are neutrally equivalent.
z
aa 94
i
00
00
60 ab
aa
h
00
j
35
00 49
aa
f
00
35
aa
i
00
50
d
aa
g
35
aa
00
0050
aaa
aac
0032
0050 abq
aab
0035
0094ab b
g 0037aa
0053aaz
0261aab
0054abg
0014aac
0054abh
0035aaa
0114aai
0056aan
0094abd
0058abw
0096ab
a
0058ac
h
0106
aak 0060
abf
0116
aaq
aam
0060
01
24 aa
m
ab
n
60
00
00
n ab
60
00
00
q ab
80
ac
i
76
ac
71 00
f
00 74 ab t
w aa 61
00
ab
aa
74
x
00
This is still a very preliminary report, and the various oddities raised by netmap need further investigation. It is surprising how little neutral evolution occurred in this example, but this could have been due to the high SlicePow value. Further Tierra runs with different parameter settings need to be studied to draw any real conclusions. However, it is clear that Netmap is a useful tool for throwing up unusual features of datasets created by artificial evolution.
61 00
62
0065abq
e 0065ab
0065abk
aau
0063
aat
n
0123
63
aa
00
o
acg
00
n
ab
acb
0067ab
0084abh
0067abi
0067
0067
68
c
00
ab
ab
70
f
00 6
00
bs 2a
1a b
b
7 00
by
2a
aa
z
7 00
00
q
61
Conclusion
Figure 6: A plot showing just those nodes undergoing neutral evolution /C=/NetMap/NetMap/queues/tierra/007.plt
Created : 16-Aug-2002 18:23:32
Plotted : 16-Aug-2002 19:12:20
References Albert, R., and Barab´asi, A.-L. 2002. Statistical mechanics of complex networks. Reviews of Modern Physics 74:47. Fosdick, L. D.; Jessup, E. R.; Schauble, C. J. C.; and Domik, G. 1996. An Introduction to High Performance Scientific Computing. Cambridge, MA: MIT
ALife VIII: Workshop proceedings Press. Green, D. G.; Newth, D.; and Kirley, M. 2000. Connectivity and catastrophe – towards a general theory of evolution. In Bedau, M. A.; McCaskill, J. S.; Packard, N. H.; and Rasmussen, S., eds., Alife VII: Proceedings of the Seventh International Conference, 153–161. Cambridge, MA: MIT Press. Ray, T. 1991. An approach to the synthesis of life. In Langton, C. G.; Taylor, C.; Farmer, J. D.; and Rasmussen, S., eds., Artificial Life II. New York: Addison-Wesley. 371. Reidys, C.; Kopp, S.; and Schuster, P. 1997. Evolutionary optimization of biopolymers and sequence structure maps. In Langton, C., and Shimohara, K., eds., Artificial Life V, 379. MIT Press. Standish, R. K. 1999. Some techniques for the measurement of complexity in Tierra. In Floreano, D.; Nicoud, J.-D.; and Mondada, F., eds., Advances in Artificial Life: 5th European Conference, ECAL 99, volume 1674 of Lecture Notes in Computer Science, 104. Berlin: Springer. Standish, R. K. 2003. Open-ended artificial evolution. International Journal of Computational Intelligence and Applications. (accepted).
175