2010 14th International Information Conference Visualisation Information Visualisation
Visualising Virtual Learning Environments: Case Studies of the Website Exploration Tool V. Pascual-Cid Universitat Pompeu Fabra & Barcelona Media - Innovation Centre Barcelona, Spain
[email protected]
L. Vigentini The University of Edinburgh Edinburgh, UK
[email protected]
data are tailored for the business needs and highly focused on key performance indicators (KPIs) [2]. When considering a closed-access system within an educational setting, in which the VLE is either complementing the course material in a blended delivery of instruction or provides the interactive space in which teaching occurs, as in distance learning, the KPIs used in business models loose meaning as usability and students experience are central.
Abstract—In this paper we describe the long term evaluation of the Website Exploration Tool (WET), an exploratory system for visualising web data, through the assessment of two Virtual Learning Environments (VLE). VLEs provide log files that can be studied with web mining techniques to understand the behaviour of the students and consequently improve the pedagogy. However, statistical metrics are not always easy to interpret for the educators, which suggests the need to develop novel approaches for the easy discovery of usage patterns. The integration of WET in the assessment process of two VLEs gave us the opportunity to conduct long-term case studies that supported the evaluation of the visual approaches used in our tool. Our main contributions are the description of the benefits of such approaches for the analysis of VLEs as well as recommended features for supporting this task, and a summary of the main findings from our case studies.
In previous work [3], [4] WET was introduced as a visual tool enabling to explore web data through interactive visual representations of the structure and usage of a site. WET allows to dynamically adjust parameters to be observed via different views and tools adding a visual dimension to aid web usage mining. Furthermore, a key feature of WET, which is not available in traditional log analysis tools, is the potential to include meta-information to the logs and add this to the visualisations. In an effort to go beyond classical website evaluation, we integrated the system in the analysis process of two projects that sought the assessment of two different e-learning spaces.
Keywords-Infovis evaluation, Virtual Learning Environments, Web Mining
I. I NTRODUCTION Ramsden [1] suggested that integrated monitoring of student experience is an essential component and a minimum standard of online learning provision. In fact, usage access data could be valuable for instructors to gain a better understanding in how students use the online resources and evaluate how effective they might be. However, in practice, it is rare that teachers use such data to inform their teaching or pedagogical goals, preferring traditional faceto-face interaction or feedback evaluation forms at the end of the teaching term. This is strikingly different from the growing trends in e-commerce in which the use of advanced analysis and visualisation techniques to explore usability and effectiveness of web material has become a cornerstone of business strategy to understand customers’ behaviour. The lack of applied examples of web usage mining in education is partially caused by the clunky interfaces implemented in VLEs to access and view data, and partially by the difficulty of finding the expertise in data mining among teachers and instructors. There is certainly a need to make available simple and intuitive tools to improve pedagogy and students experience. Furthermore, typical web analytics approaches and applications to study web usage 1550-6037/10 $26.00 © 2010 IEEE DOI 10.1109/IV.2010.31
M. Quixal Barcelona Media - Innovation Centre Barcelona, Spain
[email protected]
The research presented in this paper has two main goals: the first is to explore the potential and the benefits of a visual mining tool in educational online provision of content using standard VLEs. The second is to provide further evidences in support of the usefulness of WET in exploratory data analysis providing a detailed evaluation of this tool with two long-term case studies. This paper is organised as follows: Section II provides a review of current techniques for analysing VLEs as well as visualisation methods applied in web analysis. Section III describes the main features of WET while Section IV introduces the methodology of our evaluations. Section V provides a detailed description on how we integrated WET in the assessment of the AutoLearn and e-STUB projects, as well as the main findings to demonstrate the usefulness and potential of the tool. Section VI includes a discussion on the benefits of WET in the assessment of VLEs and suggests improvements in the design of visual web mining systems. 149
II. S TATE OF THE ART
In [18] Plaisant challenged researchers to reformulate their evaluations to capture the exploratory nature of infovis systems and later contributed to the Multi-dimensional Indepth Long-term Case Studies (MILC) [19] in the attempt to overcome some of these issues. This methodology enables to conduct more naturalistic evaluation procedures with qualitative assessment based on the observation of real users with real tasks using the target tool during a long period of time.
The web based nature of VLEs makes data mining techniques suitable to gather information from web server logs that contain trails of student and teacher activity within the platform [5], [6]. Specifically, web mining techniques, which include the analysis of the structure, content and usage of a site, can be used to discover and model the success of pedagogical strategies and ease of use of the learning platform. Early attempts to use web server logs to explore students behaviour using online learning material have been reported in different studies with various degrees of success. For example, Ingram [7] used logs to evaluate utility and usability of instructional websites. Crook and Barrowcliff [8] carefully logged students engagement to demonstrate the value of ubiquitous computing on campus. Hardy and colleagues [9] monitored students access to material provided via a VLE across different disciplines to identify useful behaviour patterns. However, these studies provide a snapshot view of usage, and much like web analytics, give only a descriptive overview of activity. There are many web analytics tools that generate a wide variety of metrics such as number of page views or average time spent by the users on the site that help to understand website usage. However, these statistics usually provide little insight into usage due to the lack of adequate and comprehensible visualisations that may potentially assist the process of making sense of the vast amount of data available. Information Visualisation (infovis) techniques have been applied in an attempt to overcome such problem. The most common approach has been the usage of node-link diagrams where nodes represent content pages and edges represent links among them. Different layouts have been used for representing either the organisation of the website or the routes followed by the users when navigating through the site [10], [11], [12], [13]. In fact, a few cases can be found demonstrating the applications of these techniques into the e-learning domain. For example, [14] used a file-navigation-like tree for digging into the details of student session. [15] implemented the DMASC tool, which provided fine-grain details of the paths of individual users through the learning space. However, the evaluation of information visualisation systems provides a number of challenges which has captured researchers interest for several years. Although the evaluation of specific techniques can be usually tackled by analysing users’ performance times and error rates through predefined tasks, the exploratory and interactive essence of infovis systems makes it difficult to evaluate their effectiveness and the usefulness of the visual outputs with classical methods such as controlled and artificial experiments [16]. In that sense, Perer and Shneiderman stated that “telling the users which tasks to carry out is incompatible with discovery” [17].
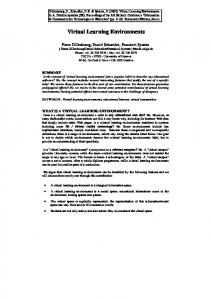
III. T HE W EBSITE E XPLORATION T OOL The WET system consists of a web mining module and a visualisation system. The former is based on a database that holds the data regarding structure and usage. New metrics can be incorporated through the development of SQL queries enabling the system to capture the results, and generate a XML file. The visualisation system (Figure 1) is responsible for interpreting the XML file and provides an interactive environment for exploring the data. The system incorporates three main coordinated views: a hierarchical representation of the website structure showing the shortest paths from the root node to every content on the site (top left image), a visualisation of the most common paths performed from a landing page also represented as a hierarchy [4] (top right image), and a graph visualisation showing an aggregation of all user paths (bottom image). Both hierarchical visualisations can be displayed using a radial tree or a treemap metaphor, while the graph representing the navigation of the users in the site uses a force directed layout. The system also enables to map different metrics with visual attributes such as colour, shape and size, and provides dynamic filtering tools to reduce the amount of information to be displayed. Further details of the functionalities of the system can be found in [3] and [4].
Figure 1. The WET interface provides a set of coordinated visualisations, a menu that allows the customisation of the visualisations and charts representing page visits over time.
150
IV. E VALUATION M ETHODOLOGY
V. C ASE S TUDIES We hereafter describe the projects that incorporated the VLE assessment with WET as well as discuss a subset of the main insights gathered with our tool. Due to space constraints we will only introduce the most important findings in each case study.
To validate the usefulness of the visualisations and the mining system of WET, we conducted two case studies with real scenarios in which WET was used by at least one analyst per project in the assessment of two e-learning platforms. As indicated earlier, the need of visualisation tools in education is demonstrated by the fact that in both cases, the first engagement followed an expression of interest from the project leaders in using visualisation tools to aid their assessment. Following the guidelines proposed in [19] and [20], the main steps that we applied in the MILC evaluation can be summarised as follows:
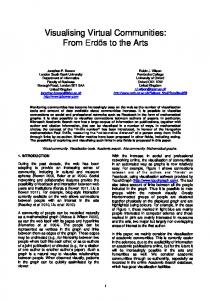
A. AutoLearn AutoLearn is a VLE to learn English or German as a foreign language developed using Moodle; AutoLearn incorporates automatic correction facilities that go beyond spell and grammar checking based on Natural Language Processing techniques. The main goal of the project was to study the use of automatically generated feedback in reallife instruction environments, which adds machine-learner interaction to the existing teacher-learner and learner-learner interaction. To what concerns our work, the project sought the evaluation of the usability of the platform to understand students satisfaction and to assess the pedagogical and linguistic aspects of the courses. AutoLearn was used in 7 institutions across Europe, managing a total of 28 courses taken by 610 students during two periods of respectively 4 and 2 months. The whole project was divided into two phases: the first testing phase was dedicated to the implementation of the learning system in the first 13 courses. During this stage analysts aimed at improving the system through the application of an iterative evaluation-development methodology. WET was used as the main tool in the explorative analysis of quantitative data extracted from log files. The lack of experience of the analysts in the web mining field generated no primary hypothesis, which emphasised the need of an exploratory tool for the discovery of outliers and behavioural patterns. 1) Data Integration: Although WET incorporates automatic tools for importing data from the most common web server log files, the existence of proxies in some schools prevented the user identification through classical methods of log file analysis [21]. Hence, we ported the Moodle database, which incorporates its own usage data with identified users, into the WET mining system. We generated a hierarchy based upon the main structure of the project that can be seen in Figure 2. The provided structure had nodes representing assignments in the outermost ring of the hierarchy, enabling a histogram like visualisation when mapping the nodes’ height with exercisebased statistics. Such histogram gets visually integrated with the hierarchy of the platform, which enabled the discovery of patterns and outliers, as can also be seen in Figure 2. The developed quantitative metrics were based on the time spent per exercise, number of visits and number of interactions per assignment. The last one was especially interesting as it provided a measure of the number of times that a user interacted with the automatic correction module.
1) Initial interview and experiment setup: a first interview enables the user and the evaluator to define the goals of the analysis according to the capabilities of the system. Such goals will be used afterwards to assess the success of the analysis process. 2) Training: an extensive training must be provided to the participants so they can understand the functionalities of the system. 3) Early use: participants install the tool in their workplace and get the required datasets formatted accordingly to the needs of the system. Continuous contact with the evaluator occurs to accommodate the tool to the needs of the user. 4) Mature use: it is expected that most of the outcome of the analysis should come during this phase, where the participant is already skilful with the tool and has a better idea of the type of analysis that can be performed. Ethnographic type-of observations should be performed. 5) Outcome: a final interview must be conducted to review the findings and compare them with the goals defined in the initial meeting. Participants should provide thoughts and conclusions about the potential of the system as well as suggest improvements for future designs. During the analysis process, participants were encouraged to annotate and provide feedback about their findings or frustrations, as well as to capture images or recordings when discovery occurred. Moreover, the proximity with the participants of the AutoLearn project gave us the opportunity to install a screencast tool that video recorded all the analysis sessions. The interviews, communication and analysis tracking of the e-STUB project was performed entirely online through voice calls (Skype) and IM sessions using Google Wave. The latter was particularly interesting because it allows for a seamless combination of real-time and asynchronous exchanges.
151
Regarding categorical data, the analysts identified every node based on its type, differentiating quizzes, assignments, resources and automatically corrected exercises. 2) Early Use: At the end of the testing phase, we provided the analyst with an XML file containing aggregated data from the 244 students that participated in 13 courses. WET incorporated a radial tree as well as a treemap to analyse the hierarchical structure of the platform, both of them with the same interaction capabilities such as dynamic filtering and visual mapping of metrics. We observed that analysts felt more comfortable with the radial tree than with the treemap as the hierarchical structure pops up more clearly. Moreover comparing bar heights was easier than comparing the treemap squarified areas. At the time of this analysis there were no users’ paths visualisations in WET, which limited the data exploration to the comparison of the different metrics with the visualisation of the structure of the project. During the analysis, each quantitative metric was mapped accordingly onto the height of the nodes, while colour was used to distinguish between categorical values such as level of the course (Intermediate or Advanced), language (German or English) or type of exercise (quiz, assignment, resource and automatically corrected exercise). Such mapping enabled the discovery of a usage pattern that revealed a decay in the visits as the lesson advanced, as can be seen in Figure 2. In a more detailed analysis, it was also discovered that there was a different slope considering students from advanced courses with intermediate ones. This finding encouraged the analysts to develop and integrate more usage related metrics to compare in the second round of the project.
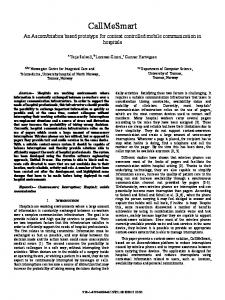
3) Mature Use: The recorded analysis sessions allowed us to observe a dramatic improvement in task performance, proof of the learning curve of the analyst. When prompted, the analyst said: “I already knew how to use the tool, so I went straight to visualise what I wanted to see”. We observed that the analyst developed a clear exploration strategy that followed the Information Seeking Mantra [22]: a very first overview of the whole structure using size and colour according to specific metrics helped to detect outliers and trends. Then, most relevant courses were filtered and explored in more detail. In this phase analysts found more examples that supported the findings made in the early stage regarding exercise visits. 4) Outcome: Analysts discovered a very common behaviour pattern that involved the absence of use of direct links between exercises within a course. Images from Figure 3 make apparent a pattern referred by one of the analysts as the “flower visualisation”. In the images, the main node represents the home page of the course, while surrounding coloured nodes represent the different exercises in the course. As can be seen, users tend to move back and forth between the exercises instead of moving from one exercise to the other. This pattern was interpreted as a sign that each activity was in principle self-contained and that all, at least most of, the materials needed to answer the questions posed by the teacher could be answered without the need to navigate around. This interpretation is supported by a decision made after the first testing phase, which implied that all activities including reading and listening comprehension activities had to be so implemented that learners could have access to either the audio, the video or the text as well as to the questions in one single screen. In the final interview with the analysts, it was argued that the explorative capabilities of the tool and the “easy way to represent the hierarchical structure of the project” helped them in the process of generating new hypotheses which in the long term allowed them to perform a deeper analysis. Their main findings were also contrasted and confirmed with the qualitative analyses performed during the project. We also noticed an extensive usage of image editing tools for annotating relevant screenshots after every discovery in order to incorporate them in the analysis report. This fact strongly suggested the need to incorporate basic annotation tools to the system, which at the same time may stimulate the collaborative analysis. The final report of the project incorporated images extracted from WET to show the findings. More details about gathered insight from the analysis of AutoLearn may be found in [23]. B. e-STUB project The main goals of the e-STUB project (exploration of Students Tracking and User Behaviour) was to analyse in detail how students used online resources provided in
Figure 2. Hierarchy of AutoLearn structure. Leafs of the tree represent course exercises, that can be mapped according their specific quantitative and categorical metrics.
152
Figure 3. Aggregated users’ paths from the 4 most visited courses of AutoLearn. The central node in the visualisations correspond to the main page of the course which contain links to the different exercises, which are colour-coded according to its type.
blended courses via a VLE, and relate usage behaviours with both performance and a number of personality metrics. In a prior quantitative analysis, Vigentini [24] identified some compelling correlations between the amount of usage (characterised by frequency of access and time spent on resources) and academic performance. However, one of the key limitations reported was the inability to meaningfully represent visually the visitation patterns or attempting to define what a typical session would look like. The dataset included over 2000 students enrolling into the foundation psychology courses over a period of 5 years at the University of Edinburgh. This is an extremely heterogeneous sample in composition as the cohorts were followed from the first into the second year and the fact that not all students enrolled pursue a degree in social sciences, but take the psychology course as an outside subject (i.e. only 40% of the students are enrolled in psychology degrees).
first or second year) and performance (good performance, i.e. student with grades above 65%, and poor performance, i.e. between 35%-marginal fail- to 55% -satisfactory-). 2) Early Use: We observed that the learning curve to attain a good proficiency with the use of WET was fairly rapid. This was predominantly because the project leader was already familiar with web analytics and some of the core concepts involved with the handling and processing of web log data in web usage mining. The steps to produce the data in the right format, however were time-consuming and required a considerable amount of effort. The exchanges between the analyst and the developer were frequent and the aid of the communication tool (Google Wave) in storing and reproducing the exchanges was very valuable. After an initial live session in which the evaluator described the tool and its functionalities in detail, the work on graphs’ generation took much more prominence and the analyst conducted the exploration using WET largely independently.
1) Data Integration: Web logs were obtained directly from WebCT Vista 6.0 (now Blackboard) using a powertool in the admin interface rather than the enduser GUI. This generated a log of content units (pages with all the frames/graphics and scripts) organised by user and session. Such format is an excellent starting point as it allows one to skip some of the preprocessing steps normally required by the common log format. Each content unit was coded with metadata according their functions: these correspond to tools (i.e. content page, quiz etc), actions (i.e. view content page, search performed etc.) and abstractions (i.e. core content, social activity, learning activity etc.). Normally such information is not readily available in server logs, but the extra processing step to enrich the data gives a deeper understanding of usage behaviours. Users’ goals cannot be easily extrapolated from the path taken, but using the metadata, intentions can be inferred based on the resources used. In fact, contrary to the concept of conversion page in e-commerce, for an educational website, students could be driven by potentially competing goals within the same session (i.e. performing a self-test using a quiz as a learning goal as much as spending time in reading core content, but the intentions are different). Furthermore, although user data cannot be easily segmented with WET, the sample was stratified to provide single datasets based on the course year (i.e.
3) Mature Use: Once the analyst had an opportunity to explore WET and its capabilities, the representation of meta-data and user information in the visualisation became central. The inclusion of categorical and user data required a further elaboration at the database level, before the generation of graphs. As the steps were standardised in the earlier stages of the project, the exchanges of data files and generation of graphs was considerably faster at this point, leading to an efficient workflow. WET needed a small upgrade to allow for the inclusion of all visual information available, but not previously used in a concurrent fashion, however this did not cause any side-effects in the data analysis allowing the analyst to focus on the exploration of data. 4) Outcome: Given the previous quantitative understanding of the patterns in the data, the analyst was mainly interested in the best possible visual representation of patterns. In this paper we would like to focus specifically on one cohort of students (students enrolled in the Psychology 1 course in 2007 and continuing into Psychology 2 in 2008) to demonstrate some useful insights generated from the use of WET. For example, the analyst knew already that the students mainly focused on three core content pages (both in terms 153
of time spent on resource and frequency of access): the home page, which is the first container displayed after login, the lectures hub (providing access to all lecture notes, handouts and core readings related to the teaching), and the tutorial hub (providing all material related to tutorials and practicals). These pages are prominent in the figures in which the size of items represents the frequency of use. The access to the social hub (i.e. discussion forums, internal mail system and chat) was less clear with aggregated data indicating uneven patterns across courses and years.
Figure 5. Differences between high and low performing students’ most common paths in a 2nd year course.
formance at the end of the year. The path to expertise in the higher performing students suggests increased efficiency in access, with shorter, frequent and targeted visits (i.e. the sessions are short for all types of content), whilst the lower performing group still shows broader and lengthier visits, more similar to the novice state in Y1. Y1 students also don’t seem to differentiate between the core content and social interaction: patterns that remain similar in lower performing students moving from Y1 to Y2. This could be an index of distraction or an attempt to seek external validation. Although all these observations need to be properly substantiated by statistical analysis of the data, the visual interaction with the navigation paths is essential to explore for meaningful patterns.
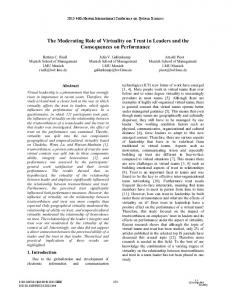
Figure 4. Paths and frequency of access in a 1st year course; most common paths from the homepage (left) and site structure highlighting shortest path to search results pages (green nodes).
The graphs (Figure 4 and Figure 5) demonstrate the expected patterns in accessing the core content. An interesting observation can be made in relation with the ’path to expertise’ in using the system: students in year 1 (Y1, Figure 4), in general, display longer paths in their browsing sessions compared to Y2 (Figure 5). Longer visits in Y1 were expected from the quantitative data analysis as Y1 students tend to ’cram’ visitation toward the end of the term, closer to the exams (see [9]). Another possible demonstration of this ’novice’, more chaotic approach, in using the VLE is offered by the access to the ’search’ facility. The search is available from anywhere in the site and the results pages are dynamically generated appearing in the structure as if they were static. Figure 4 (right) shows that in the Y1 class there are a number of long branches (green nodes) indicating repeated searches beyond 3 clicks. Occurrences of the search results pages are a behavioural pattern rather than reflecting the structure of the site and its usability. A shallow occurrence like in Y2 (i.e. log in and find X) demonstrates a strategic behaviour. In Y1 so many long branches and deeper occurrences in the clickstream could be interpreted as an index of disorientation. The similarity of the visitation patterns in students classed as low performers in Y2 and the Y1 group was particularly interesting as it could be an early indicator of lower per-
VI. C ONCLUSIONS The understanding of the usage patterns of teaching material offered via VLEs is a very important element that could provide valuable feedback to instructors and inform pedagogy in respect of both learning outcomes and teaching goals. However, web analytics and traditional log analysis tools are unable to provide a simple and accessible way to gain insight into the data with adequate tools for developing customised metrics. This paper demonstrates how the use of WET provides a way to visually represent website data for the evaluation of the usage of two VLEs. In both case studies, WET is enhancing the discovery of uncovered and unexpected patterns and could provide a valuable asset for instructors and policy makers to enhance the implementation and evaluation of elearning platforms, proving the sensemaking ability of our system. We have also seen that the ability to embed metainformation to log data represents an important enhancement compared with existing web analytics tools. In both cases the project leaders expressed that a visualisation tool could enhance their assessment and understanding of the data. Taking into account that the goal of applying web mining techniques to VLEs is to improve learning, which is not a tangible measure, contrary to what happens 154
in e-commerce where profit is pursued, interactive tools such as WET become especially important as they provide an explorative environment to aid the generation of new hypotheses. Relevant enhancements of the tool to be considered as future work should incorporate the ability to annotate the visualisations to facilitate collaboration, the generation of data reports for further analysis, and the possibility to stratify the data on-demand, allowing a real-time calculation of metrics according to metadata intervals, such as time or type of users.
[12] E. H. Chi, J. Pitkow, J. Mackinlay, P. Pirolli, R. Gossweiler, and S. K. Card, “Visualizing the evolution of web ecologies,” in CHI ’98: Proceedings of the SIGCHI conference on Human factors in computing systems, 1998, pp. 400–407. [13] T. A. Keahey and S. G. Eick, “Visual path analysis,” in Proceedings of the IEEE Symposium on Information Visualization (InfoVis’02). IEEE Computer Society, 2002, p. 165. [14] J. Mostow, J. Beck, H. Cen, A. Cuneo, E. Gouvea, and C. Heiner, “An educational data mining tool to browse tutor-student interactions: Time will tell,” Proceedings of the Workshop on Educational Data Mining, National Conference on Artificial Intelligence, pp. 15–22, 2005.
R EFERENCES [15] S. Sobol, C. Stones, and A. Whitworth, “Qualitative evaluation of e-learning using a visualisation tool,” Proceedings, IADIS Conference on Applied Computing, 2005.
[1] P. Ramsden, “Learning to teach in higher education,” RoutledgeFalmer, London, 2003. [2] J. L. Ledford, J. Teixeira, and M. E. Tyler, Google Analytics, 3rd Edition. Wiley; Pap/Dig edition, 2009.
[16] S. Carpendale, “Evaluating information visualizations,” Information Visualization. Human-Centered Issues and Perspectives (Chapter 2), vol. 4950/2008, pp. 19–45, 2008.
[3] V. Pascual and J. Dursteler, “Wet: a prototype of an exploratory search system for web mining to assess usability,” Proceedings of the 11th International Conference in Information Visualisation (IV07), Jan 2007.
[17] A. Perer and B. Shneiderman, “Integrating statistics and visualization: case studies of gaining clarity during exploratory data analysis,” CHI ’08: Proceeding of the twenty-sixth annual SIGCHI conference on Human factors in computing systems, pp. 265–274, 2008.
[4] V. Pascual-Cid, R. Baeza-Yates, J. Drsteler, S. Mnguez, and C. Middleton, “New techniques for visualising web navigational data,” Proceedings of the 13th Conference in Information Visualisation (IV09), pp. 621 –626, Jul 2009.
[18] C. Plaisant, “The challenge of information visualization evaluation,” AVI ’04: Proceedings of the working conference on Advanced visual interfaces, May 2004.
[5] C. Romero and S. Ventura, “Educational data mining: A survey from 1995 to 2005,” Expert Syst. Appl., vol. 33, no. 1, pp. 135–146, 2007.
[19] B. Shneiderman and C. Plaisant, “Strategies for evaluating information visualization tools: multi-dimensional in-depth long-term case studies,” BELIV ’06: Proceedings of the 2006 AVI workshop on BEyond time and errors: novel evaluation methods for information visualization, May 2006.
` Nebot, F. Mugica, C. Nord, [6] F. Castro, A. Vellido, A. C. Girona, and M. Hidalgo, “Applying data mining techniques to e-learning problems,” Intelligence (SCI), vol. 62, pp. 183– 221, 2007.
[20] A. Perer and B. Shneiderman, “Integrating statistics and visualization for exploratory power: From long-term case studies to design guidelines,” Computer Graphics and Applications, IEEE, vol. 29, no. 3, pp. 39–51, May 2009.
[7] A. Ingram, “Using web server logs in evaluating instructional web sites,” Journal of educational technology systems, vol. 28(2), no. 137-57, 1999.
[21] R. Cooley, B. Mobasher, and J. Srivastava, “Data preparation for mining world wide web browsing patterns,” Journal of Knowledge and Information Systems, vol. 1, no. 1, pp. 5–32, 1999.
[8] C. K. Crook and D. Barrowcliff, “Ubiquitous computing on campus: Patterns of engagement by university students,” International Journal on Human Computer Interaction, vol. 13, no. 2, pp. 245–256, 2001.
[22] B. Shneiderman, “The eyes have it: A task by data type taxonomy for information visualizations,” VL ’96: Proceedings of the 1996 IEEE Symposium on Visual Languages, p. 336, 1996.
[9] J. Hardy, S. Bates, D. McKain, K. Murray, J. Paterson, B. McGonigle, L. Vigentini, and A. Jackson, “The modus operandi of the next generation e-learner; an analysis of tracking usage across the disciplines,” Proceedings of the 13th Association of Learning Technology Conference, 2006.
[23] R. N. M. Estrada and M. Quixal, “Report of the evaluation in the second testing phase. technical report. autolearn project,” Barcelona Media Innovation Centre, Tech. Rep., 2009. [Online]. Available: http://autolearn.barcelonamedia.org/node/37
[10] J. Cugini and J. Scholtz, “Visvip: 3d visualization of paths through web sites,” in DEXA ’99: Proceedings of the 10th International Workshop on Database & Expert Systems Applications. IEEE Computer Society, 1999, p. 259.
[24] L. Vigentini, “Using learning technology in university courses: do styles matter?” Multicultural Education and Technology Journal, vol. 3, 2009.
[11] J. I. Hong and J. A. Landay, “Webquilt: a framework for capturing and visualizing the web experience,” in WWW ’01: Proceedings of the 10th international conference on World Wide Web. ACM, 2001, pp. 717–724.
155