Visualization and Clustering of Author Social Networks Stefani Chan
Sandia National Laboratories Albaquerque, New Mexico
[email protected]
Raymond K. Pon
UCLA Computer Science Department Los Angeles, California
[email protected]
[email protected]
ABSTRACT We visualize author information in a social network to alleviate the burden of researchers in their literature search. A user interface has been implemented allowing users to submit an author name for which they wish to begin the query process to article databases. Co-author, referenced author, and article keyword information are extracted from the search results. Directed edges connect with edge weights are computed based on the level of collaboration. We hypothesize that the author information in the social network structure is partitioned into cluster groups based on two criterias: (1) authors that tend to work in similar areas of research are grouped together, (2) authors that tend to work together frequently are grouped together. Used in combination, the visualized social network is separated into clusters of authors with topic labels summarizing the general area of study for those groups.
1. INTRODUCTION A difficult task in any research project is to accumulate the related articles in a particular area of research, which in most cases are done with keyword searches into journal database, such as Citeseer. We apply social networks to the area of medical journal articles without loss of generality, to improve the effectiveness of such searches. Researchers that often find themselves scouring references of relevant papers manually can use social networks to facilitate their research efforts. Even search engines which offer users the ability to follow links to other authors that cite a certain paper require tedious navigation through different results and memorization of the relationships discovered. Instead of manually exploring each reference individually, we present a system to visualize author information and relationships simultaneously. Thus, with the social network visualization, researchers can easily identify the authors involved in particular research topics and find numerous papers relevant to a particular topic.
1.1
Alfonso F. Cardenas ´
UCLA Computer Science Department Los Angeles, California
Related Works
Being a popular area of interest, social networks have previously been investigated in the realm of author networks in other applications. While each application begins with similar foundations, the actual functionality and features available differ greatly. Three applications in particular, ReferralWeb, Netsight, and PubSearch, are discussed.
ReferralWeb [1] generates a social network of authors for recommending and finding experts in a particular field. The original motivation for creating such a system came from the tediousness of having to manually search referral chains. Instead of bothering authors with inquiries regarding their highly regarded referrals, ReferralWeb uses data available on the World Wide Web to determine experts automatically. Using the co-occurrence of author names in web documents, direct relationships between authors within close proximity on the pages is formed. ReferralWeb uses links on personal home pages, coauthors and references from papers, and messages sent between people in news archives to extract relationships and generate the social network [2]. ReferralWeb’s proposes experts in areas as well as familiarizes users with the social network in which the user belongs. Thus, the main purpose of this system is quite different from what our system hopes to accomplish. Our system focuses more on forming clusters of subcommunities for all authors rather than finding particular experts. Additionally, our system is able to generate labels for entire clusters. Despite these different focuses, both systems obtain author relationships through the web and support incremental extensions to the graph. Netsight visualizes and analyzes large-scale author data obtained from CiteSeer [3]. With large relational datasets, the graphs become so large that it is often necessary to perform filtering techniques. Netsight offers three types of filtering: KNeighborhood filtering, degree filtering, and vertex set filtering. With the KNeighborhood Filter option, vertices that are within a user specified k steps away from the selected vertices remain while the rest are filtered out of the displayed graph. With the Degree Filter option, those vertices with degree outside of the user defined boundaries are filtered out. Finally, with the Vertex Set Filter, the user selected vertices are not included in the final graph. Netsight additionally offers statistical analysis features such as Page Rank and S-T Betweenness. While Netsight focuses more on visualizing and analyzing large datasets, utilizing Page Rank and filtering algorithms, our system revolves around clustering algorithms instead. The most closely related system is PubSearch [4]. Research web sites, such as CiteSeer, are queried to obtain relevant scientific publications. Reference author information is extracted from the “Bibliography” or “References” section of retrieved articles. After storing the obtained information in the database, the PubSearch system applies two types of clustering techniques to generate the experts in the fields: document clustering and author clustering. The document
clustering step clusters documents based on keywords whereas the author clustering step clusters authors based on cocitation analysis. By combining the two clustering techniques together, a visualization is obtained, where both authors and their fields are represented as nodes. The distance separating the author node and the research label indicate the rank for that author in the particular area. Like the PubSearch system, our implementation also uses a variation of the multi-clustering technique to obtain clusters based on cocitation, co-authorship, and research area topics. However, our system places added emphasis on generating and using the social network idea when clustering. In PubSearch’s visualizations, there are no edges that link authors together. Thus, unlike our system, relationships and collaborations between authors are not the main focus of PubSearch’s implementation. Each of the three applications discussed have many promising features that our system has taken into account. Using these preexisting systems as a foundation, we are able to implement an application to accomplish our goals.
1.2
Intuition
This study revolves around co-authorship and co-citation of medical journal articles. By starting with a seed author, various search engines are used to obtain the articles written by the specified author. The coauthor and reference information is extracted from the documents and visualized in a social network. By progressively expanding the network to include more coauthors of coauthors and references of references, an author social network is formed illustrating the relationships and extent of collaboration among authors. Given vast amounts of author data, we would like to determine the clusters of meaningful author nodes groups. The authors are grouped together using the cosine distance measure [5]. The generated clusters are therefore formed based on common areas of study. Along with clustering based on author keywords, our system also attempts to take advantage of the nature of social networks and cluster by the actual authors. With the author relationships already organized in the form of vertices and edges in the graph, a second clustering method makes use of the physical closeness of the author nodes. The reasoning behind this algorithm is that frequently, authors that publish works together and reference each other repeatedly form natural groups or clusters since they generally perform related research [6]. So, by using the Euclidean distance measure to determine the proximity of author nodes, cluster collections are discovered from the graph. The final method explored is a multi-clustering technique that merges the cluster results from the keyword and author clustering algorithms together.
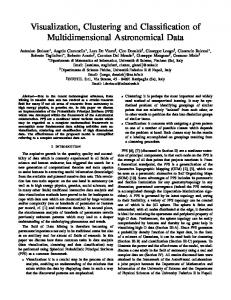
2. SYSTEM ARCHITECTURE The following sections expand on the system architecture. Figure 1 illustrates the general overview of the architecture employed for this author social network. The architecture mainly consists of three portions: the web portion is needed to collect the author and works information, the database portion is needed to store the results from the search, and the social network analysis portion is needed to analyze, cluster, and visualize all the information. Details pertaining to the web crawler and social network analysis are discussed.
2.1
Web Crawler
Figure 1: System architecture.
The first step in generating the author social network is to obtain the author, coauthor, and reference author information from the web. Since the system focuses on extracting citation information, it is necessary to select a search engine which has a references section readily available for each work found. Additionally, a medical search engine is required because our system focuses on medical journals and works in particular. Given these constraints, the Journal of the American Medical Informatics Association (JAMIA) [7] is the search engine chosen for this task. JAMIA provides users the ability to query the database of works based on author name, work title, abstract, and text. In our system, the user provides an author name to begin the searching process. From this query term, a list of the specified author’s articles is returned. Using a custom HTML wrapper developed with the HTMLParser package provided by [8] to extract the HTML content from the result pages, we extract coauthor and reference information for an article.
3. COLLABORATIVE WEIGHT COMPUTATION The following section discusses the formulas used to compute author relationship weights between searched authors and coauthors as well as searched authors and referenced authors. Since different information is available in both cases, different techniques are needed for weight calculation. Once the formulas are chosen, the weights can be used in the visualization layout to determine the node positions as well as the edge thickness.
3.1 Notation The author social network is a directed graph G = (V, E) with nodes V and edges E where |V | = n denotes the number of nodes and |E| = m denotes the number of edges. In a social network, vertices represent the entities, or more specifically the authors. The edges represent the relationships between entities, or in this case co-authorship and co-citation collaboration. A network consisting of n authors, is visualized as a graph composed of n nodes V = a1 , a2 , · · · , an . A directed edge between two author nodes, ai and aj , indicates either a co-authorship or co-reference relationship between the two authors. An edge between authors is written as ai → aj , and as is expected, the existence of an edge ai → aj does not imply aj → ai . The in-degree of a vertex is the number of edges which point to this node while the out-degree of a vertex is the number of edges which flow outwards from this node. The degree measure is simply the number of edges incident to this particular vertex. Figure 2
Figure 2: Social network notation. provides an example of a simple social network.
3.2
Coauthor Weights
To connect two authors together, a similarity measure needs to be chosen to quantify the strength of the relationship. The simplest approach is to compute Jaccard’s coefficient [9] which calculates tie strength based on the number of results obtained from a search engine, such as Google [10]. A variation of this approach is taken in our author social network. To begin with, instead of using the Google search engine and establishing friend links, the JAMIA search engine is used to establish coauthor and co-citation relationships. Additionally, our social network is inherently directed in nature. We modify Jaccard’s coefficient to the following where ai and aj represent the authors whose weight is being calculated for the edge ai → aj . weight(ai → aj ) =
|ai ∩ aj | |ai |
(1)
As mentioned earlier, when the user proposes an author to be queried or extends the graph to search more authors, the returned results are stored in the author database. Performing this calculation for each author pair, therefore, simply amounts to counting the number of entries in the database tables. Jaccard’s coefficient is consequently used as the edge weight between searched authors and coauthors as well as between two searched authors.
3.3
FC (ai , aj ) = (1 − w(ai → aj )) ∗ 100
weight(ai → ar ) =
X |ar | where ar , aR ∈ w |aR | w
(2)
When the referenced author becomes a searched author, the weight calculation connecting to this node defaults back to Jaccard’s coefficient. Also, all weight values range from [0, 1).
Weighted Layout
Given the tie strength formulas, we will use these weights in the visualized graph. The key component in the so-
(3)
When calculating the attractive force FA between vertices ai and aj , the force constant is used in the JUNG implementation as follows, where ! is defined as 0.000001, is the x-coordinate position in the graph for vertex ai , ayi is the y-coordinate position in the graph for vertex ai , and analogously for aj .
Reference Author Weights
The edge weights between searched authors and referenced authors are calculated in a different manner and do not use Jaccard’s coefficient. Since referenced authors have not been searched in JAMIA yet, the system has no way of knowing how many works they have actually written. Thus, we developed a different approach to determine the relationship strength of searched author ai and referenced author ar with edge ai → ar . In essence, the weight is calculated as the sum of the ratio of the number of times ai references ar over the total number of referenced authors for all works written by ai . This translates into the following equation, where aR represents all the referenced authors and w represents all of author ai ’s works:
3.4
cial network visualization is the Layout. The Layout specifies the vertex locations so they appear at certain parts of the visualized graph. Our implementation uses a variation of the Fruchterman-Rheingold algorithm [11], which distributes vertices in the graph so that connected nodes remain close together yet maintain a level of separation at the same time. Using an analogy from physics, vertices are equated to atomic charged particles exerting repulsive forces between nodes. Edges, on the other hand, are equated to springs causing attractive forces that instigate the movement of the edges’ connected vertices [12]. To start, the vertices’ initial configuration begins randomly on the graph. The attractive forces on each vertex are computed next, followed by the repulsive forces. The process concludes with a cooling stage which limits the displacement to some maximum value. As time progresses, this maximum temperature cools so that the adjustment becomes finer as the layout improves. After repeated iterations on all the nodes of the graph, a final resultant force is determined and each node is moved accordingly. The FRLayout provided by JUNG already accounts for these attractive, repulsive, and temperature cooling components [13]. However, to incorporate the relationship weight between authors, the FRLayout has been extended to the WeightedFRLayout. To account for the additional weight information, we created a new function to calculate the force constant for the edge ai → aj :
FA (ai , aj ) =
”2 “ q max(!, (axi − axj )2 + (ayi − ayj )2 FC2
(4)
Thus, the higher the weight between vertices is, the smaller the force constant becomes. The smaller force constant causes the attractive force to be stronger, and the vertices become closer in the visualized graph. For completeness, the equation to compute the repulsive force FR between any two vertices ai and aj remains unchanged from the original specification. The FC used is the original force constant based on the window height and width:
FR (ai , aj ) =
FC2 q max(!, (axi − axj )2 + (ayi − ayj )2
(5)
4. KEYWORD EXTRACTION
Before clustering, the authors must be associated with a set of keywords describing their general area of research. Because of the nature of JAMIA, keywords are not provided in the document metadata and must be generated explicitly. The general approach taken for all searched authors is to preprocess the authors’ work titles and abstracts to produce a list of keywords. The occurrence of these keywords are then counted and stored in the database. A summary
Figure 3: Keyword processing algorithm for searched author.
Figure 4: Keyword processing algorithm for references. of the algorithm steps that we developed for the keyword processing is listed in Figure 3. All work titles and abstracts written by each searched author are tokenized and stemmed, discarding stop words are ignored. The initial list of stop words were obtained from [14]. We use the PorterStemmer developed by Porter [15] for stemming. Next, the words extracted from the title are used as the keywords and as the words are encountered in the abstract, the occurrence count is incremented. After processing each document, the keywords obtained are sorted by their occurrence counts and the top 20 keywords are selected and stored in the database. Once the keywords are extracted for the searched authors, the occurrences of the terms in the referenced authors can be computed. Since the abstract information is not available in the case of referenced authors, only the titles are used. All of the searched author’s references are analyzed based on the searched author’s keywords. Thus, for each keyword from the searched author, the referenced author’s titles are preprocessed and as the words are encountered in the references’ titles, the count is incremented. A summary of this algorithm is given in Figure 4. Since coauthors collaborate with searched authors on the same work, the keywords obtained for the searched author is also used for the coauthors. After performing these computations, the database is populated with document vectors for all authors. These values and counts can be used in the clustering algorithms described in the next section.
5. CLUSTERING Our system incorporates two types of clustering, keyword clustering and author clustering, to identify the relationships and groupings of authors in a graphical manner. After each clustering method is performed on the data individually, the results from both techniques must somehow be combined. Using a multi-clustering technique, clusters can be formed that group the authors working in related fields and labels can be generated for these groups. We developed the keyword and author clustering algorithms and adapted the multi-clustering technique from [4].
5.1
Keyword Clustering
Previously, we described the process by which keywords are extracted from an author’s works. These keyword counts can now be used as part of the keyword clustering process. The algorithm begins by assigning each node a cluster state of UNCLASSIFIED. Then, each searched author is examined to determine which authors should be clustered together. Each searched author is assigned an integer cluster state number based on its unique identifier authorId from the database. The list of keywords and the counts associated with this searched author are obtained, and the same is done for each of the searched author’s references. To judge the closeness of the authors, a variation of term frequency × inverse document frequency (TF-IDF) is utilized. TF-IDF is modified to accommodate authors instead of documents and can be referred to as term frequency × inverse author frequency (TF-IAF). In our adapted version, a list of reference authors that are cited by the target author is generated for each searched author. TF-IAF can be used to match the keywords of the reference author against the keywords of the target searched author. The new equation becomes the following, where the term frequency measures the number of times the keyword appears for each author, n is the number of authors, and author frequency (AF ) is the number of authors that use the keyword: tf − iaf (kwi ) = |kwi ∈ aj | ∗ log
„
n AF (kwi )
«
(6)
Similar modifications to TF-IDF were also explored in [5]. The results of term weighting computation for the searched and reference authors are stored in separate vectors so that they can be compared. Because of the nature of social networks, the n(n1) comparisons that are usually required can actually be reduced. From the social network, it is already known which authors are collaborating, so it would not make sense to compare authors that have no direct relationship at all. Thus, only searched authors and its connected authors need to be evaluated. Our system utilizes a popular similarity measure [5], the cosine distance metric, to determine the extent of the relationship between the author and the author’s references. The cosine distance between two vectors, X and Y , of length i can be determined using this equation: P Xi ∗ Yi cos(X, Y ) = pP i 2 P 2 i Xi ∗ i Yi
(7)
If the cosine distance for that particular reference author is better than any set before, then the cluster state can be changed to the current author’s identifier. This cosine distance calculation and comparison between searched authors and references continues until all the searched authors have been evaluated. By the end of the algorithm, clusters have been generated based on common keywords. A summary of this procedure is given in Figure 5.
5.2 Author Clustering In social networks, clusters can also be formed based on the patterns of the relationships. From a relational standpoint, a strong direct relationship between individuals increases the likelihood that these individuals should be clustered together [16]. In the case of authors, the more they write papers together and the more they reference one another, the more cohesive they become, forming a definable group
1 2 3
Figure 5: Keyword clustering algorithm. Figure 6: Node legend after clustering. of collaborators. Our system takes advantage of this property of social networks to help in generating clusters based on author relationships. In a previous section, the strength of the authors’ relationship ties are taken into account when visualizing the social network. In other words, author nodes that have a larger weight, indicating a close relationship, are visually drawn closer together whereas author nodes with a smaller weight are drawn farther apart because the relationship is not as strong. The clustering procedure begins first by setting the cluster states of all nodes to UNCLASSIFIED. Then, each searched author is examined to determine which authors should be clustered together based on location. As in the keyword clustering algorithm, each searched author is assigned an integer cluster state number based on its unique identifier authorId from the database. Subsequently, each of the searched author’s directly connected authors are evaluated. Since the actual x and y coordinates of the author nodes are used to determine cluster membership, the Euclidean distance metric is used. The Euclidean distance between two authors, ai and aj , can be computed with the following formula: dist(ai , aj ) =
q (axi − axj )2 + (ayi − ayj )2
(8)
The smallest Euclidean distance between a searched author and a particular reference author indicates that on the graph, the two nodes are closer together than any other pair. This closeness implies that the relationship between them is stronger than anyone else’s. Therefore, when processing the searched authors, if a smaller distance is found, the cluster state can be changed to that author’s identifier. This distance calculation and comparison between searched authors and references continues until all the searched authors have been evaluated. By the end of the algorithm, all authors are assigned to a cluster based on the proximity to a searched author.
5.3
Combined Clustering
Up to this point, two separate algorithms have been used to generate clusters. The next logical step would be to develop yet another algorithm to combine the cluster information from both the keyword clustering and the author clustering algorithms together. We have adapted a multiclustering technique from [4] which analyzes generated cluster data from multiple clustering methods and merges them together through a vectorization, distance evaluation, and vector clustering process.
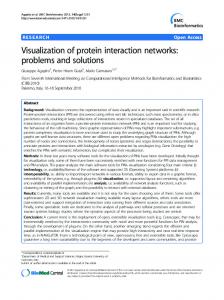
6. OBSERVATIONAL RESULTS We present our observational results with an example author social network and manually check the validity of the keyword labels generated. The system utilizes JUNG for visualizations. We ran several observational runs with different authors to determine the qualitative effectiveness of the system. In one of the example runs, we searched for author “Frances M. Weaver” and find the works he has published in JAMIA. To generate more clusters, we expand the graph to search Weaver’s coauthors and references. The initial graph generated from these searches is illustrated in Figure 7(a). After selecting the cluster option, the graph changes into what is depicted in Figure 7(b). The leftmost cluster is associated with the keywords “quality, primary, care, feedback, improve.” The middle set of authors is associated with “vaccinations, data, veterans, cord, disorders.” And the rightmost cluster is associated with “data, surveillance, association, control, infection.” The node legend summarizing this data is given in Figure 6. To verify the accuracy of the labels, we look at Weaver’s areas of research. He is assigned to the center cluster group associated with spinal cord disorders and vaccinations. When we submit “Frances M. Weaver” into Google, the professor’s biography page lists his research interests as “chronic diseases (i.e., Spinal Cord Injury, Parkinson’s Disease), long term care, program evaluation, surgical risks and outcomes” [17]. Therefore, from the work submitted into JAMIA by Weaver and his associates, the system was able to determine that one of his general areas of study is in spinal cord disorder research. Inspecting even further, a page for the “Spinal Cord Injury Quality Enhancement Research Initiative (SCI QUERI)” [18] research coordinating center is discovered which among the participants, include Weaver, Evans, LaVela, Wallace, Goldstein, Legro, and Smith, who are all clustered together in our system’s social network. We evaluate other cluster groups in a similar manner. Under manual inspection, the clusters and labels generated by the system are able to describe the authors’ research interests in most of the cases. The clustering and keyword generation system, however, is not perfect and possible future work is described in the next section to improve keyword extraction part of the system.
7. FUTURE WORK Since this work was a first attempt at developing a social network capable of producing author clusters based on common
(a) Before clustering.
1
3 2
(b) After clustering. Figure 7: Frances M. Weaver’s social network.
topics, future work should still be done on the system. Possibilities include using different search engines, improving the keyword extraction process, implementing more clustering methods, and handling author ambiguity issues. Enhancements can also be made to the keyword extraction process. In particular, along with stop word removal and word stemming, future implementation may also incorporate knowledge sources provided by the National Library of Medicine’s Unified Medical Language System (UMLS) [19]. UMLS provides a metathesaurus to link common medical terms and synonymous words together. Additionally, the SPECIALIST lexicon converts words with inflected forms into the common root word. This lexicon can be used in place of the PorterStemmer. Other clustering methods are currently being evaluated for their effectiveness and correctness. Problems of entity resolution can occur due to the method in which we collect authorship information. Future work should be done to account for ambiguities in the author data. In addition to the author name, work title, and work abstract, the web mining process can also extract institution locations and email addresses for the authors. In our experiments, we manually verified several examples. To manually verify all possible test cases would be too timeconsuming and not very rigorous. A more comprehensive and rigourous validation methodology for verifying the accuracy of the clusters and their associated keywords is currently being evaluated.
8. CONCLUSION We have implemented a system to translate author, coauthor, and citation data obtained from the web and generate a visual representation of a social network. We have also developed and implemented clustering methods to group authors together based on mutual research interests. After evaluating example runs, it is found that authors tend to be grouped together correctly because the co-citation and joint publications imply an extent of collaboration between the authors in the same clusters. In some occasions, two clusters may have somewhat similar keyword labels that could possibly be merged into one. In terms of the cluster labels, there is more variability in terms of the accuracy. There are cases when the labels match very well with all the authors in the group; the label results returned from the system match closely with the results returned from manually using Google to determine the research interests for every single author in the cluster. However, there are also cases when the keyword label only describes a portion of the group. In these cases the topic description covers the majority, but not all, of the authors in the group.
9. REFERENCES [1] H. Kautz, B Selman, and M. Shah. Referral web: combining social networks and collaborative filtering. Commun. ACM, 40(3):63–65, 1997. [2] D. W. McDonald. Recommending collaboration with social networks: a comparative evaluation. In Proceedings of the SIGCHI conference on Human factors in computing systems, pages 593–600. ACM Press, Ft. Lauderdale, Florida, USA, 2003.
[3] S. Lawrence, K. Bollacker, and L. Giles. Citeseer. http: //citeseer.ist.psu.edu/, 2005. [4] Q. T. Tho, S. C. Hui, and A. C. M. Fong. A web mining approach for finding expertise in research areas. In Cyberworlds, 2003. Proceedings. 2003 International Conference on, pages 310–317, 2003. [5] Y. He, S. C. Hui, and A. C. M. Fong. Citation-based retrieval for scholarly publications. IEEE Intelligent Systems, 18(2):58–65, 2003. [6] D. V. Kalashnikov and S. Mehrotra. Learning importance of relationships for reference disambiguation. RESCUE, December 8, 2004. [7] Journal of the American Medical Informatics Association. Jamia. http://www.jamia.org/, 2005. [8] D. Oswald, S. Raha, J. Kerievsky, and K. Kaila. Htmlparser. http://htmlparser.sourceforge.net/, 2005. [9] Y. Matsuo, K. Hasida, H. Tomobe, and M. Ishizuka. Mining social network of conference participants from the web. In Web Intelligence, 2003. WI 2003. Proceedings. IEEE/WIC International Conference on, pages 190–193, 2003. [10] P. Mika. Social networks and the semantic web. In Proceedings of the Web Intelligence, IEEE/WIC/ACM International Conference on (WI’04) - Volume 00, pages 285–291. IEEE Computer Society, 2004. [11] T. M. J. Fruchterman and E. M. Reingold. Graph drawing by force-directed placement. Softw. Pract. Exper., 21(11):1129–1164, 1991. [12] P. Mutton. Inferring and visualizing social networks on internet relay chat. In Information Visualisation, 2004. IV 2004. Proceedings. Eighth International Conference on, pages 35–43, 2004. [13] J. O’Madadhain, D. Fisher, T. Nelson, J. Krefeldt, S. White, and Y. B. Boey. Jung: Java universal network/graph framework. http://jung.sourceforge. net/, 2005. [14] THOMAS. Inquery stop word list for thomas. http: //thomas.loc.gov/home/stopwords.html, 1998. [15] M. Porter. The porter stemming algorithm. http:// www.tartarus.org/∼martin/PorterStemmer/, 2000. [16] M. H. Zack. Researching organizational systems using social network analysis. In System Sciences, 2000. Proceedings of the 33rd Annual Hawaii International Conference on, page 7 pp. vol.2, 2000. [17] F. M. Weaver. Frances m. weaver, ph.d. http://www. northwestern.edu/ihs/people/f weaver.html, 2005. [18] F. M. Weaver. Spinal cord injury quality enhancement research initiative research coordinating center, sci queri. http://www.sci-queri.research.med.va.gov/ mchspr.htm, 2004. [19] National Library of Medicine. Unified medical language system (umls). http://www.nlm.nih.gov/research/ umls/, 2005.