prediction with heterogeneous visualization and data mining software tools. Our paper primarily ... The objective of this paper structure is to convey the analytical.
th
7 International Conference on Hydroinformatics HIC 2006, Nice, FRANCE
VISUALIZATION AND DATA MINING TOOLS APPLIED TO ALGAL BIOMASS PREDICTION IN ILLINOIS STREAMS PETER BAJCSY1, ROB KOOPER1, LUIGI MARINI1, DAVID CLUTTER1 AND MOMCILO MARKUS2 1 National Center for Supercomputing Applications (NCSA), University of Illinois at Urbana-Champaign, IL 61820, USA AND 2 Illinois State Water Survey Champaign, IL 61820, USA Large amounts of hydrologic, geographic, meteorological, water quality, soil type, landuse and many other types of data are available for water scientists and practitioners. Those abundant and often multidimensional and heterogeneous datasets could be analyzed using sophisticated and complex techniques, which are facilitated by the increasing power of large computers. To better understand the data and methods, to better interpret the results, and eventually to make correct decisions, we present a set of visualization and data mining tools developed at the National Center for Supercomputing Applications (NCSA) for water resources research and applications. The tools are applied to prediction of algal biomass using habitat and nutrient measurements. Several methods for extracting variables from remote sensing data, clustering variables, and modeling relationships between variables with data-driven models, such as Naïve Bayes or decision tree, were explored with the observed habitat/nutrient/algal biomass data. Furthermore, in order to solve the algal biomass prediction problem, several heterogeneous software tools had to be executed and linked together with various data sets. Thus, we also introduce a meta-workflow technology for performing algal biomass prediction with heterogeneous visualization and data mining software tools. Our paper primarily focuses on the descriptions of the aforementioned technologies driven by the analysis of algal biomass prediction. INTRODUCTION Large amounts of hydrologic, geographic, meteorological, water quality, soil type, landuse and many other types of data are available for water scientists and practitioners. Those abundant and often multidimensional and heterogeneous datasets could be analyzed using sophisticated and complex techniques, which are facilitated by the increasing power of high performance computers. However, the wealth of data and methods for data analyses often are not easily accessible to water managers. Furthermore, they are not always understood and/or interpreted by end users. To better understand the data and methods, to better interpret the results, and eventually to make correct decisions,
2 water managers need to be presented with the results in a simple, clear, and informative manner while working with complex computational tools that can handle large datasets and computationally intensive operations. In addition, being able to exercise seamlessly functionality present in heterogeneous software packages is an obvious need in many disciplines including hydroinformatics. Water scientists and practitioners often form workflows by applying a sequence of analysis steps to data. Thus, the understanding of data and methods might still be insufficient to execute the needed analyses. There is a need to provide an environment where heterogeneous visualization and mining tools could be integrated, and the workflows can be re-used and modified. The National Center for Supercomputing Applications (NCSA) has been developing technologies and providing computational resources to several scientific communities including the hydroinformatics community [6]. Multiple technologies have been used for data storage (HDF), meta-data repository (Tupelo), heterogeneous data integration and analysis (Im2Learn, I2K), remote sensing data analysis (GeoLearn), data mining (D2K), security (myProxy), grid computing (teragrid at NCSA), and cyberenvironments (CyberIntegrator). Several of these technologies that have been developed in the past are relevant to water resources. Those components include algorithms for predictive modeling, hierarchical multi-dimensional multi-variate classification and segmentation, georeferencing of vector and raster data, feature selection, feature extraction, and decision support using geospatial information as described in Section IV of the hydroinformatics book [6]. Furthermore, the most recent effort has lead to a development of a meta-workflow environment where heterogeneous tools could be not only linked together but also recommendations about the use of tools and data sets could be obtained based on gathering provenance information Bajcsy et al [2]. This paper describes these technologies as they have been applied to the problem of algal biomass prediction in Illinois streams. The problem of algal biomass prediction in Illinois streams lies in explaining the variability in algal biomass measured as chlorophyl a, based on nutrients (total or dissolved nitrogen, and total or dissolved phosphorus) and habitat conditions (water velocity, canopy cover along the streambank, stream width/depth, etc.). Algae are either the direct or indirect cause of most problems related to nutrient enrichment. Our research is based on the past findings of Munn et al. [9], Bourassa and Cattaneo [3]; Lin et al. [7], and Markus et al. [8] that support the use of nutrients and habitat factors as the best indicators of trophic state. This study uses a dataset for the entire state of Illinois, consisting of numerous nutrient, habitat and chlorophyll a data. Although these long-term ambient datasets are incomplete and do not necessarily contain storm-event data, they represent the best currently available datasets for testing the results of this study Illinois [8]. The paper is divided into two additional sections, problem description and example of algal biomass analyses. The objective of this paper structure is to convey the analytical and computational challenges of a class of data-driven water quality analyses, and provide an example of utilization of existing mining and visualization technologies.
3 PROBLEM DESCRIPTION The algal biomass prediction problem can be described as a sequence of processing steps to establish data-driven models (relationships) between input variables and algal biomass growth, and to provide computer-assisted interpretation of the models supported by visualization for water scientists and practitioners. The flow of processing steps is illustrated in Figure 1. The overarching goals of the analysis are to predict algal biomass from multiple measurements gathered using water gauges, remote sensors and other instruments with unsupervised learning and supervised modeling techniques and to improve users understanding in terms of relevant and irrelevant variables for algal biomass prediction, as well as their spatial distribution.
Figure 1: The flow of processing steps for algal biomass prediction in Illinois streams. Data Description The input data are water quality point measurements acquired at the location of water gauges and include latitude and longitude of each water station, as well as nitrogen (TN), phosphorus (TP), dissolved phosphorus (Dissolved P), temperature, turbidity, canopy, depth/width ratio, stream velocity, date (day/month/year) and algal biomass (Chl-a) represented by Chlorophyll-a. The data contain 1862 records, covering the time period of March 2000 thru January 2004, and the spatial region of the Illinois streams. Visualization of spatially aggregated Chl-a, TN, TP, temperature and canopy coverage variables as a function of time is shown in Figure 2 and Figure 3.
4
Figure 2: Spatially aggregated algal biomass measurements (Chl-A) as a function of time. Chl-A is the output predicted variable.
Figure 3: Spatially aggregated input variables as a function of time. Left – nutrient variable TP. Right - habitat variable Temperature Not all measurements are available and the records denote any missing measurements as -99999. The number of missing values of each variable (also called features) in the unfiltered data set is: TN (mg/L) 1257; TP (mg/L) 95; Temp (deg C) 13; Turbidity (NTU) 109; Velocity (ft/s) 1754; DW Ratio (ft/ft) 1754; Canopy (%) 1755. The number of complete records with (a) all features is equal to 2, (b) TN (mg/L) removed is equal to 93, (c) Velocity (ft/s), DW Ratio (ft/ft) and Canopy (%) removed is equal to 567. As shown in Figure 1, additional terrestrial raster and vector data could be obtained from USGS (digital elevation maps), USDA (land use and land cover maps, soil maps) and ISWS (water shed boundaries), and the remote sensing raster data could be downloaded from NASA (MODIS satellite data). An example of remote sensing raster data is shown in Figure 4.
Figure 4: Remote sensing raster data of a NASA denoted geographic tile (h10, v5), acquisition year 2003, stored in HDF EOS file format and re-projected from Sinusoidal projection to Albers Equal Area Conic projection. The pseudo-colored images represent fraction of photosynthetic active radiation (left) and leaf area index (right).
5 Description of Analytical and Computational Problems Given the heterogeneity of input data in terms of their type (point, vector and raster), file formats, geographic projections, data quality, spatial and temporal resolutions and so on, one has to address a gamut of problems related to finding the appropriate software functionality that might be scattered, managing large size data sets, allocating an adequate computational resources to perform analyses, recording all processing steps, and interpreting the final results to arrive to our better understanding of algal biomass bloom in Illinois streams. We briefly describe a few of the analytical, computational and process management challenges related to algal biomass prediction according to Figure 1. The analytical challenges include (1) missing values in the water quality point measurements, (2) variable quality of remote sensing data due to cloud coverage during acquisition, (3) optimal parameter selection for feature extraction (e.g., spatial neighborhood considered for slope calculation), data integration (e.g., spatial resolution and geographic projection of integrated data) and model building (e.g., number of clusters, depth of decision tree), (4) optimal selection of input variables for modeling that includes considering variable transformation and scaling issues due to dynamic range variations, and (5) interpretation and understanding of input-output relationships from models, and their visualization in model and spatio-temporal domains. The computational and process management challenges involve (1) accessing and retrieving remotely located data, (2) linking fragments of codes (functionality needed is usually dispersed among multiple software packages), (3) assigning sufficient computational resources, (4) preserving data and process provenance information to be able to reconstruct the process in the future and (5) providing mechanisms for sharing and learning from the past analyses. Approaches to Multiple Problems In this work, we approached many of the aforementioned problems by building a user interactive meta-workflow environment [2] with incorporated analytical functionalities from heterogeneous software packages needed to perform the algal biomass prediction in Illinois streams. The software packages included Im2Learn, GeoLearn, D2K, ArcGIS and MS Excel spread sheet. As illustrated at the bottom of Figure 1, a user interacts with data, software tools and computational resources using browsers and executes computations by utilizing the underlying meta-workflow engines (see Figure 5). The meta-workflow system addresses the computational and process management challenges. It provides feedback to a user about the execution, provenance information and any recommendation that are mined from the provenance information. The analytical challenges have been approached in the following way. The problem of missing values in the water quality point data was resolved by filtering data and creating subsets of data with fewer variables. Other approaches will be considered in the future. The problem of variable quality of remote sensing data due to cloud coverage during acquisition was addressed by designing a tool that builds a mask image with valid pixels according to the NASA quality information. It is up to a user to choose and evaluate multiple choices of quality criteria as needed. The problem of optimal parameter selection for feature extraction, data integration and model building was approached by either using standards (e.g., the default spatial neighborhood size for slope computation used in ArcGIS) or integrating software with user-driven parameter selection and engaging cross validation techniques [4]. We intended to always give the option of
6 choosing parameters to a user since a user is viewed as the expert with tacit knowledge. The next problem of optimal selection of input variables (e.g., variable transformation and scaling) has not been addressed in our current work. We have only experimented with scaling all variables to the same dynamic range as it is required by many supervised data-driven modeling techniques (e.g., support vector machine model). The application of log transformation to some of the water quality variables was explored in an independent study of Markus et al [8]. Finally, the problem of interpretation and understanding of input-output relationships from models was approached by a thorough analysis of input variable relevance assignment by Feng and Bajcsy [5]. According to a general definition of variable relevance [1], an input variable is relevant to predicting an output variable if modifying it affects the result. We developed relevance assignment algorithms from regression tree, support vector machine and k-nearest neighbor models and incorporated them into the algal biomass analysis flow.
Figure 5: The user interface to the meta-workflow environment called CyberIntegrator. The three upper panes represent browsers of data (left), software tools (middle) and computational resources (right). A user selects a triplet (data, tool, resource) and executes the computation by clicking on the button “Execute”. The bottom pane provides system information, for example as shown, a graphical representation of all executed steps. EXAMPLES OF ALGAL BIOMASS ANALYSES In this section, we illustrate some of the results obtained using the developed technologies at NCSA. The input water quality point measurements are loaded from a MS Excel spread sheet and the columns with latitude and longitude coordinates of water stations are extracted. We performed the quality control (QA) step with remote sensing raster files using GeoLearn and computed slope, curvature, aspect, flow direction, flow accumulation and compound topographic index (CTI) from a digital elevation map using Im2Learn. The remote sensing variables and elevation derived
7 variables are integrated and added to the table with input water quality point measurements using Im2Learn and ArcGIS capabilities. Then, unsupervised techniques such as clustering (see Figure 6) and Naïve Bayes (see Figure 7), are applied to the tabular data and the results are visually interpreted using D2K and Im2Learn capabilities. Finally, decision tree modeling technique (see Figure 8) and input variable relevance assignment algorithm are utilized to predict algal biomass and understand the impact of input variables on the prediction by linking D2K and Im2Learn functionalities.
Figure 6: K-Means Clustering of Algal Biomass Variable - Geographic locations of all water quality stations with the cluster membership to high (left), medium (middle) and low (right) Chl-A variable. The points are overlaid with watershed boundaries.
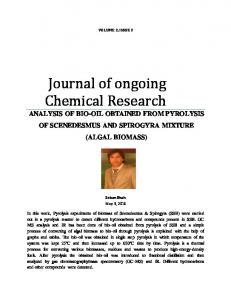
Figure 7: Naïve Bayes Modeling – Pie-chart visualization of probability of Chl-A (high, medium, low) conditioned by input variables listed under the label “ATTRIBUTES”. Selection of particular input variable bins denoted with a box in the middle pane leads to a pie chart on the right side that shows 87.99% probability of Chl-A being labeled as high, 6.53% as medium and 5.48% as low.
8
Figure 8: Decision Tree Modeling – Visualization of a decision tree model of Chl-A as a function of multiple input variables. The main viewing area presents a sub-tree shown in the left upper corner with each node described by the split decision and the tree leaves characterized by the number of Chl-A samples classified as high, medium or low. REFERENCES [1] Avrim L. B. and P. Langley. “Selection of Relevant Features and Examples in Machine Learning.” Artificial Intelligence 97, (1997) Elsevier Science. [2] Bajcsy P., R. Kooper, L. Marini, B. Minsker and J. Myers, “A Meta-Workflow Cyberinfrastructure System Designed for Environmental Observatories,” Tech. Rep.: NCSA Cyberenvironments Division, ISDA01-2005, (Dec. 30, 2005). [3] Bourassa, N., and A. Cattaneo. Control of Periphyton Biomass in Laurentian Streams (Quebec). J. N. Am. Benthol. Soc. Vol. 17, NO 4 (1998) pp. 420-429. [4] Duda, R., P. Hart and D. Stork, Pattern Classification, Second Edition, Wiley-Interscience, (2001). [5] Feng W-W, and P. Bajcsy, “Relevance Assignment to Geospatial Variables from Multiple Learning Methods,” Second Int. Conf. on Space Mission Challenges For Information Technology (SMC-IT 2006), Pasadena, CA, (July 17-20, 2006). [6] Kumar P., J. Alameda, P. Bajcsy, M. Folk and M. Markus, “Hydroinformatics: Data Integrative Approaches in Computation, Analysis, and Modeling,” CRC Press LLC, Oct., (2006), 534p. [7] Lin, L-S., M. Markus, and A. Russell. A Stream Classification System Based on Susceptibility to Algal Growth in Support of Nutrient Standard Development, Water Research (under review). [8] Markus, M., L-S. Lin, and A. Russell. Development of Streams Classification System for Nutrient Criteria in Illinois, Illinois State Water Survey Contract Report 2005-02, (2005). [9] Munn, M.D., L.L. Osborne, and M.J. Wiley. Factors Influencing Periphyton Growth in Agricultural Streams of Central Illinois. Hydrobiol. 174, (1989), pp.89-97.