Chapter 5
Visualization and User Interaction Methods for Multiscale Biomedical Data Ricardo Manuel Millán Vaquero, Jan Rzepecki, Karl-Ingo Friese and Franz-Erich Wolter
5.1 Introduction Biological processes in the human body interact continuously in order to sustain physiological function. A complete study of a phenomenon in human physiology requires merging data from several measurements, not only from different domains of knowledge (chemistry, biology, physics, and medicine) but also across different spatiotemporal scales. As an example, a musculoskeletal disease of the human knee affecting the motion (behavior scale), can be seen on a CT or MRI scan (organic scale) and has its cause on cellular or even molecular level. To simulate the related processes, different temporal scales have to be taken into account as well. Those time scales range from seconds on the behavioral level to microseconds on the cellular scale. However, merging of data alone is not enough to obtain valuable knowledge. Visualization that generates images from these measurements is necessary to help scientists understanding complex relations between modalities and spatiotemporal scales. Multiscale visualization deals with the question: “How can visualization help in extracting information from several scales that cannot be attained or understood by traditional techniques?” More specifically, multiscale visualization will also support extracting information that cannot be obtained or understood from evaluating data from a single scale alone or even from different scales without having the flexibility R. M. Millán Vaquero (B) · J. Rzepecki · K.-I. Friese · F.-E. Wolter Welfenlab, Division of Computer Graphics, Leibniz Universität Hannover, Welfengarten 1, 30167 Hanover, Germany e-mail:
[email protected] J. Rzepecki e-mail:
[email protected] K.-I. Friese e-mail:
[email protected] F.-E. Wolter e-mail:
[email protected] N. Magnenat-Thalmann et al. (eds.), 3D Multiscale Physiological Human, DOI: 10.1007/978-1-4471-6275-9_5, © Springer-Verlag London 2014
107
108
R. M. Millán Vaquero et al.
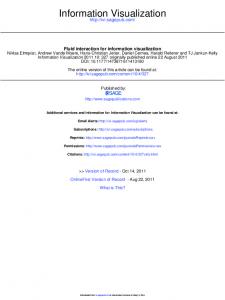
Fig. 5.1 Multimodal and multiscalar requirements in the visualization of biomedical data
to match and compare the data according to criteria defined by the scientist using the system. Visualization is the primary channel through which biomedical data is communicated. In this work, interaction is a way to control the flow of this channel. It allows the user to decide in real-time on visualization contents that are to be presented. The user queries for data through interaction methods, and receives semantic meaningful results through visualization. Thus, visualization combined with and controlled by user interaction constitutes in the given context the complete tool for biomedical data exploration. The next section discusses the complexity of biomedical data and the requirements of a multiscale environment. The third section proposes current lines of work to design an efficient scientist-centric visualization tool. Current multiscale visualization techniques and the foundation of the Human Computer Interaction (HCI) field are described in the fourth section. Finally, an overview of strategies and lines of work on multiscale visualization and interaction with biomedical data is given in the last section.
5.2 Visualization of Biomedical Data The presentation of image data has become more challenging due to the increasing complexity of biomedical datasets. Here it is necessary to integrate all data from different modalities in the same reference system for a specific domain of knowledge (multimodal requirement). Furthermore, it is also necessary to consider the merging of several domains across scales (multiscalar requirement). Both of the aforementioned requirements are crucial in the biomedical environment as illustrated in Fig. 5.1. The complexity of data is due to the following factors: • Variety of sources: Biomedical data can be acquired by a broad range of modalities, e.g. CT, MRI, motion capturing or microscopy. Even sources of the same modality might not share a common standard. Currently, no standardization of formats in microscopy imaging exists. This leads to a loss of metadata during format conversion, or problems by organizing images from time-lapse experiments [1].
5 Visualization and User Interaction Methods for Multiscale Biomedical Data
109
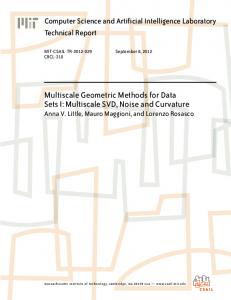
Fig. 5.2 Example of a knee joint multiscale dataset: (a) Cross-section of knee CT scan, (b) microCT slice of cartilage tissue, (c) 3D reconstruction of micro-CT scan of cartilage tissue, (d) histological image of cartilage, (e) schematic of extracellular components of cartilage tissue, (f) JMol visualization of aggrecan particle [7]. Images (b, d) and dataset (c) courtesy of 3B’s Research Group. Dataset (a) courtesy of OsiriX Project [8]
• High-dimensional image data: Images carry more information in the form of additional dimensions (beside x- and y-resolution): e.g. time, space and channels. For instance, multispectral imaging (acquisition of spectrally resolved information at each pixel of an imaged scene) has become widely offered by microscopy manufacturers [2]. • Amount of data: Massive datasets from large scale experiments are difficult to manage due to the memory limitations. Even though the amount of available memory is increasing and out-of-core techniques have been developed [3], data memory requirements increase due to a more detailed data collection. This creates another challenge: representing datasets in a user intuitive manner is more difficult in relation to the increasing amount of data. 3D reconstruction and projection techniques are important when dealing with high-dimensional image data. This is illustrated in an example of tomographic mineralogical data analysis [4]. The software used (YaDiV [5]) allowed the experts from mineralogy to understand the geometric spatial structure intuitively, which was not observed in the respective 2D slice images used before. This investigation method can also be applied in the context of biomedical multiscale visualization, where reconstruction of micro-CT data of cartilage clearly exhibits complicated spatial tissue structures (Fig. 5.2c). The multimodal requirement is born by this variety of data properties: multiple imaging sources provide vast amounts of data with heterogeneous dimensionality that should be merged. This requirement is needed to help physicians and scientists of the same domain to interpret this wide range of collected data [6].
110
R. M. Millán Vaquero et al.
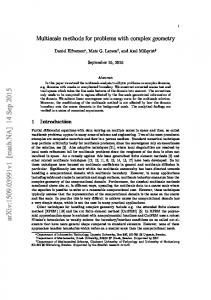
For example, the extraction of information from both the hard and the soft tissues, acquired with different imaging modalities (CT and MRI), is essential in an anatomical study. It can be used to obtain information in many musculoskeletal clinical applications [9]. On the other hand, the multiscalar requirement, i.e. mixing information between scales, is needed because systems and pathologies in the human body are often hierarchical. Events on the cellular scale propagate upwards to the tissue or organ levels (Fig. 5.3). In some cases, a complete evaluation of medical risks can only be obtained if data from different scales is available [10]. For example, musculoskeletal diseases depend on several factors from multiple scales. For a complete study, information sources from different scales have to be considered. Specifically, studies of cartilage [11] have shown the impact of extracellular matrix (molecular) components on macroscale elements. The degradation of their nanoscale structure greatly influences the behavior of the tissue. This causes degeneration with age, injury, or diseases such as osteoarthritis. Sources of information range from cross-sectional histology at the cellular level, to body motion captures at the behavior scale, with additional data on the tissue and organ level in between (Fig. 5.2). Research projects as of [12–14] prove that the integration of multiscale data can lead to deeper understanding with practical consequences. Another example is the study of the cardiovascular system. In [17], it is shown that the multiscale conception of the human blood circulation system, from molecular to organ level, can enhance the understanding of diseases, such as vascular atherogenesis. Until today no major advances have been made in multiscale biomedical visualization, except in the domains of genomics and proteomics [18]. Hence, many authors called for efforts to create a multidisciplinary work in an integrated visualization [19, 20] of biological data: “the revolution in biological data visualization hasn’t started yet” [21].
5.3 Visualization Helps Understanding Science Scientific visualization [22] presents numerous types of data that are inherently spatial in a visual form. It typically aims to represent data based on physical measurements e.g. obtained via acoustic waves (sonography) or often via electromagnetic waves including e.g. digital X-ray - and CT-imaging as well as light microscopy. Electronic microscopy uses electron beams to illuminate a specimen producing a magnified image. Most of the aforementioned imaging techniques already use sophisticated mathematical computations evaluating the respective physical measurements in an initial processing step needed (to prepare further steps) for presenting an appropriate visualization of the respective spatial data. Those computations may include methods from signal processing such as Hilbert transform for sonography imaging or Radon transform for CT-imaging [23, 24]. Further processing steps may use more mathematical methods e.g. for segmentation of CT-volume data separating
5 Visualization and User Interaction Methods for Multiscale Biomedical Data
111
Fig. 5.3 Different grades of osteoarthritis disease obtained using (a) microscopic imaging [15] (b) MRI imaging [16], (Fig. 5.3a reprinted from Osteoarthritis and cartilage, vol. 13, no. 11, Kleemann, R. U. et al., Altered cartilage mechanics and histology in knee osteoarthritis: relation to clinical assessment (ICRS Grade), pp. 958–963, 2005, Copyright © 2005 OsteoArthritis Research Society International, with permission from Elsevier.) (Fig. 5.3b reprinted from Arthritis & Rheumatism, vol. 52, no. 11, Loeuille, D. et al. Macroscopic and microscopic features of synovial membrane inflammation in the osteoarthritic knee: correlating magnetic resonance imaging findings with disease severity, pp. 3492–3501, Copyright © 2005, American College of Rheumatology, with permission from Wiley Online Library.)
and indicating different biological structures. The initial computational evaluation of physical measurements for visualization of small scale molecular data [25] as well as the theoretical concepts and subsequent additional computations needed for processing the respective data may be even more complicated than they were in case of the preceding large scale visualization problems. The molecular visualization will result in visualizing certain structural aspects of molecules being consistent with our current scientific physico-chemical model of the respective molecular and atomic structures. One might still claim that the latter small scale visualization is
112
R. M. Millán Vaquero et al.
still attempting to present inherently spatial physico-chemical data in visual form. However the visualization obtained in this context reflects quite abstract model based information supposed to (indirectly) present some data and some properties of the respective molecules. One particular example of this is the visualization in Fig. 5.2f showing an artificial 3D-illustration of molecules illustrating e.g. the different atoms involved and their bondings. One might go one step further, and could consider information visualization presenting (abstract semantic) data that is purposely not inherently of spatial origin, but is rather using a spatial representation of information (e.g. via trees or graphs) taking advantage of human’s visual perception capable to see and understand a lot of information at once. Indeed the field named information visualization [26] is referring to this aforementioned type of visualization. The abstract nature of the latter information data requires the selection of an appropriate spatial representation and also the transformation of the information data into that spatial representation. Only after that transformation into a spatial presentation being graphically intuitively accessible it is possible to get benefit from this data as a means to amplify cognition. Research in visualization is complex by itself, because it can be approached from different points of view. Many algorithms, techniques, and interactions have been explored and improved, but fundamental theories are insufficient [27, 28]. Many innovative biomedical tools provide visualization that integrates data from multiple sources, and even can interoperate with other tools or be embedded into web pages. An overview of examples has been presented in [29]. Although huge developments in visualization research have been done, only limited attention has been given to methodologies that provide understanding to users, because current approaches are not user-centric. Visualization depends on several aspects, such as the properties of the data, human physiological factors or physical characteristics of the display device. Furthermore, the use of visualization for understanding science should not make a distinction between scientific and information visualization [30, 31]. Figure 5.2f is a clear example where visualization is based both on physical measurements and abstract structure of molecule. Effective visual abstractions based on information visualization can help the representation of complex data in large-scale biomedical systems. Thus, certain current lines of work have paid more attention to all these aspects than creating new techniques or algorithms. The design of a biomedical visualization tool should take into account the user experience (see Sect. 5.3.1) and the scientific meaning (see Sect. 5.3.2) as required. The features summarized in this section eliminate the gap between the visualization research community and the scientist as a user of a visualization system.
5.3.1 Improving the User Experience Taking User Experience (UX) into account is an established procedure in the design of any man-machine-interface. These interfaces are not designed by the will of the
5 Visualization and User Interaction Methods for Multiscale Biomedical Data
113
programmer (or company), but based on user feedback, e.g. if the user calls a certain feature of the software very frequently, it will get a hotkey. Although UX could be applied universally to every visualization system, these features are gaining more importance in the scientific visualization context [27]. They consist of the following aspects:
Perception Factors Users are part of the visualization process. Thus, human factors should be strongly considered in order to improve the visualization design. A faithful representation is not the only goal. Visualization can go beyond incorporating different features that human perception can decode; it might take advantages of the mechanisms in the human visual system. • Use of color: Considerations of color theory (distance, linear separation, categories) can help choosing colors that facilitate understanding [32, 33]. As an example, red color can help to bring the user attention to an important feature, e.g. abnormalities in a biomedical scan. • Texture: The use of perceptual texture elements also known as pexels, characterized by color, density, height, orientation or randomness can help users in shape perception [33]. • Pre-attentive processing: A limited group of visual features can be processed unconsciously by obtaining information from the visualization without the need for focused attention, independent of the number of data elements and the display size [32]. Other relevant aspects are shape, size, contour, sharpness and the use of 3D primitives [34]. However, these features together are not always favorable: a combination in a specific application should be evaluated.
Innovative and Standardized Representations Visualizing new types of data or supporting new analysis tasks accelerates the appearance of innovative representations. The problem for the users is the lack of standards in representations. Walter et al. proposed both innovative and standardized representations [1]. Perception of information not only depends on how the visualization is designed, but also on the viewer’s understanding of the given symbol system, e.g. hard tissues are represented with white color, soft tissues black. This results in two aspects: • educating viewers may improve their data understanding (helping them to gain new insights) [35] and • the usability could be enhanced by the adoption of standards in representation.
114
R. M. Millán Vaquero et al.
Frequent Evaluation During the Design Process An important instrument for UX is user study [33]. These studies require a good experimental design, which is often difficult to achieve. A flawed experimental design (or wrong execution) may lead to results that are not helpful or—even worse—lead to wrong conclusions. Working closely with users is the best way to develop a visualization tool. Thus, it is important that experts from the field (here: biomedical science) should participate in the studies. Is the visualization really giving the user the information he needs, e.g. at a certain simulation step? Or is it distracting him with too many aspects? In order to provide concrete usability to the visualization, a frequent evaluation has to be done during the design cycle, e.g. by testing isolated and specific usability hypotheses [34].
5.3.2 Bringing Scientific Meaning to Visualization Visualization can be a powerful tool in the understanding of data and its context. In this chapter we will distinguish between scientists in general (“users”), who work on a specific topic and visual researchers, who research data visualization and closely work together with the general scientists. Scientists and visualization researchers try to give meaning to visual data and to gain systematic insights into many domains [1]. For this purpose, researchers of scientific visualization need to create field-centric tools focused on the scientific process of data analysis [27, 36].
Visualization Suitability for Data Analysis Scientists make connections between the quantitative image description and its (biomedical) meaning. For this purpose, they need to focus on identifying meaningful features and on exploring potential relationships [1]. Visualization systems are suitable tools for exploratory data analysis. The visualization must be highly linked to the type of information, and show relevant image-based data in an intuitive manner, satisfying the scientists’ inquiries. Visualization software tools for analyzing data can be difficult to learn due to the complexity of data and task. To simplify the learning process visualization tools should focus on the following features: • Integration: Merging of tools in the same program as long as it is useful. Elimination of unnecessary navigation reduces manual interaction times, however increasing application complexity too much can lead to user confusion. • Interoperability: Complete integration in the same software is almost impossible. If a data format is not supported, it should at least be possible to process or convert
5 Visualization and User Interaction Methods for Multiscale Biomedical Data
115
it with an external program, as described in [13]. Thus, interoperability requires clear software protocols and the support of common data formats. • Navigation aids: In a complex (multiscale) visualization, it is easy to lose track of the current (spatiotemporal) position and context. Navigation aids like an overview map, colored floating labels or a zone tracker can help to keep track of the zone (or scale) the user is currently exploring [37]. The starting screen of such a system should enable the navigation across all the structures. Most progress has been made in the field thanks to the incorporation of software usability principles. However, the achievement of these improvements has been a slow process; working on usability enhancements is less rewarding in science than inventing new ideas and approaches [21].
Challenges in Representing Small Structures Biological data gathered on nanoscale level is often large in size and resolution. Additionally, it usually does not have a naturally understandable representation. Visualization of these structures creates interpretations of the measurements, which are not comparable with the physical object, as in the case with larger scale images. A set of different techniques involving volume rendering, isocontouring and dynamic mesh reduction should be used as a guide for visualizing and navigating these data-intensive structures [38]. In some cases images acquired on small scale level are blurred or have low-contrast. Representing this data requires a computationally sophisticated postprocessing step to enhance image quality and extract structures in the segmentation process.
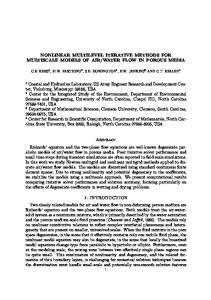
Realistic Representations Additional data that improves the image quality in terms of visual experience can drastically increase understanding. Enhancing the quality of images is an ongoing research subject [1, 39]. For the purpose of prediction, customization of models should be available in order to be patient-specific [40]. Medical images should be visualized together with the representation of different structures by using specific techniques. For instance, texture based volume rendering can be used to give the user an overall impression of the measured data. Surface rendering as a method of providing extra-information for structures of interest (see also [41]) can support the spatial scene understanding (Fig. 5.4).
Use of the Scientific Method During the Design Process In the real world, tool designers have limited sources of information about the application being designed. User opinions are rarely taken into consideration and technique
116
R. M. Millán Vaquero et al.
Fig. 5.4 Segment visualization in YaDiV [5], showing intracranial air after brain surgery
improvements are often not evaluated. During the design process, visualization researchers should use the scientific method (phenomena observation, hypothesis formulation, results prediction and evaluation) to prevent creating a toolset that is detached from the biomedical meaning [27].
Evaluation of Visualization Tool Design Considering visualization as a technology, evaluation and validation are vital in order to provide effectiveness and efficiency. Wijk explains in [28] an economic model of visualization. The cost associated with using a visualization system depends on the user and the initial development. The user cost is related to the learning time required to use the new tool, to convert the user data to the system’s format and to interpret the presented results. The high price of the initial development costs (i.e. to have a novel idea and to develop it) is the major factor. The researcher’s process that tries to provide a visualization tool to a scientist in order to help him in the understanding of complex data is described in [28]. The state of the art review and the development of a new idea is not enough to achieve success. Thus, it is crucial to prepare a study on advantages and limitations before starting to work on a new visualization method. Wijk also states that “visualization is not good by definition” [28]. Designers should avoid visualizing information that could be extracted by automated analysis of data, and do not require direct human interpretation. Reusing existing visualization software can also be a viable solution.
5.4 Multiscale Visualization and Interaction Multiscale visualization is necessary due to the division of science into domains, each investigating the nature on a specific spatiotemporal scale and working with its own type of data. This specialization can even prevent scientific progress if phenomena
5 Visualization and User Interaction Methods for Multiscale Biomedical Data
117
Fig. 5.5 Integrated visualization environment proposed by [21] (Reprinted by permission from Macmillan Publishers Ltd: Nature Methods, vol. 7, O’Donoghue, S. I. et al.: Visualizing biological data—now and in the future, S2–S4, Copyright © 2010 Nature America, Inc. Images courtesy of ClearScience (drawing), iStockPhoto (lung X-ray), University of Kansas Medical Center, Department of Anatomy and Cell Biology (lung histology), Digizyme and Cell Signaling Technology (pathway). Protein structure and sequence alignment made using SRS 3D [43]. Chromosome image from UCSC Genome Browser [44], Nucleic Acids Res., vol. 38, Rhead, B. et al.: The UCSC Genome Browser database: update 2010, D613–D619, 2010, by permission of Oxford University Press
are analyzed in strongly separated scales. This fact is considered the “tyranny of the scales” [8]. The observation and quantification of natural processes occurring at multiple scales is not possible without a multi-scalar framework, resulting from a multi-disciplinary conception among scientists and visualization researchers [42]. The main challenge for multiscale visualization of biomedical data is: how to display simultaneously multiple visual features that map to very different spacetime regions? [27]. Detailed and global content information are usually distributed at different scale levels, and also small scales should have visibility in large scales (Fig. 5.5). Requests for biomedical multiscale modeling and visualization have been made during the last decade. Additionally, the level of integration of multi-disciplinary and multiscale research has been increasing in the last years, as discussed later in this section. However, according to Gehlenborg, “Truly integrated visualization of systems biology data across the entire range of possible data types is still very much in its infancy” [45]. Lorensen [20] emphasized the need to form alliances with the fields of application of visualization. An understanding of each scale is required, but the importance lies in coupling scales in a multiscale user interface. This interplay will provide a more complete meaningful analysis and lead to solutions that will provide scientists with new knowledge that would have not been understood without a proper multiscale visualization.
118
R. M. Millán Vaquero et al.
In this context, different interaction strategies can solve problems normally associated with visualization in a more efficient manner. Prominent examples are VR interaction strategies, e.g. augmented reality, navigation devices or haptic interfaces.
5.4.1 Multiscale Visualization This section discusses multiscale visualization. It presents the design process, important techniques and recent realizations.
Multiscale Design Process The current multiscale design process consists of choosing the appropriate techniques to create a multiscale system, depending on the following factors [18, 46]: • Type of data and their features: formats, dimensionality and amount. • Visualization style: e.g. isosurfaces, volume rendering, vector field, tensor field visualization, … [47]. • Nature of multiscale: Considerations to be taken into account are based on the relations between the different types of data, as the order of magnitude or the relation between space and time scale. If the data does not have time-space continuity, a smooth transition is required. The presence of these gaps between different scales is one of the major challenges in the design process. • Style of interaction: navigation, augmented reality, haptic and gesture interaction (see Sect. 5.5.2).
Multiscale Techniques Current multiscale techniques can be categorized by their function [18]. The most relevant of these techniques are: • Out-of-core visualization: This collection of techniques handles datasets that are larger than the available memory [3]. General external-memory techniques can be divided in two groups: batched computations and on-line techniques. The first group involves data streaming into internal memory. Later the data is processed in multiple passes. In the second group, also based on batched computations, the data is pre-processed according to possible queries and results are stored in a specific structure that facilitates the access. • Level of detail (LoD): The representation complexity of an object in the scene depends on its relevance (e.g. position, camera speed or user focus). As datasets grow in size and complexity, the importance of LoD techniques is increasing [48]. • Call-outs and lensing: These two techniques allow simultaneous view of detailed and global content. Call-outs (Fig. 5.6a) are enlarged sub-regions that link to a
5 Visualization and User Interaction Methods for Multiscale Biomedical Data
119
Fig. 5.6 Example of multiscale visualization techniques applied to a histological image of fibrocartilaginous tissue (a) call-out technique, (b) lensing technique. Images courtesy of 3B’s Research Group
point of the parent image. Movable lenses can magnify small-scale objects or show different features from other scales (Fig. 5.6b). • Methods for large-scale: When objects are very small compared to their distance from the origin of the reference system, the resolution of the object geometry can be lower than the numerical precision of the computer. This problem is often called ill-conditioning. In medical datasets, registering the positions of small objects with respect to their local parents can solve this issue. Another alternative, used in astrophysics, is the use of power scaled coordinates, which can represent positions of distant objects in a uniform mode [18]. • Time-varying data visualization: When using time-varying data, the insertion of the time dimension introduces new requirements, e.g. the correlation between temporal sampling frequency and spatial scales [46].
Examples of Multiscale Visualization Among the biomedical visualization tools that currently exist (examples can be found in [45, 49]), fully interactive and multimodal visualizations were rarely achieved in concrete practical research. Genomics, proteomics and information visualization
120
R. M. Millán Vaquero et al.
domains have dealt more with the multiscale problem in depth. Biodigital Human [50] and Zygote Body [51] are clear examples of how web-visualization for a general audience has improved. Recent projects enable collaborative investigation of the human body as a single complex system. Some of them are being developed under the framework of the Virtual Physiological Human (VPH) [52], including the Multiscale Spatiotemporal Visualisation (MSV) Project [53]. The MSV Project aims to cover the lack of specific interactive visualization paradigms for biomedical multiscale data. By using the LoD approach with placeholders [12], it allows for example navigation across CT scans at different scales. This project and others use open-source systems and libraries for image processing and visualization for rapid development of medical imaging applications, such as the Visualization Tool Kit (VTK) [54]. They constitute the basis of many advanced tools [55] and are suitable in a multi-scalar environment. Another example is the Multimod Application Framework (MAF) [13], which supports the combination of biomedical time-varying data from several sources, allowing for instance an effective analysis of human motion [56]. In short, development of data fusion and multimodal visualization demonstrates how these approaches can solve concrete multidisciplinary biomedical problems. Thus, research groups and current projects highlight this need in order to solve their challenges (e.g. [14]), and try to explore new approaches [42].
5.4.2 Human Computer Interaction (HCI) HCI is a known concept that has its roots in the pre-computer era, when it was better known as Man-Machine Interaction (MMI). Recent development of different technologies has blurred the border between HCI reality and fiction [57]. This section briefly discusses the basics of the field of HCI, its definitions and terminology and categorizes different approaches.
Definitions and Terminology Two different aspects of HCI need to be named. Functionality defines all abilities of a system that HCI should provide access to. Different realizations of user interfaces can result in different ranges of functionality. This variation is referred to as usability. Every designer should keep the fragile balance between functionality and usability at equilibrium [58]. Categories A first approach to categorize HCI is based on activities performed by the user:
5 Visualization and User Interaction Methods for Multiscale Biomedical Data
121
• Physical: It constitutes all interactions involving direct use of senses and muscle actions [57]. • Cognitive: It includes all mental capabilities of the user connected with understanding, learning and reasoning [59]. The cognitive aspect is also emphasized in a more direct manner in Brain Computer Interfaces (BCIs) where the interface senses the user’s cognitive state of the brain (via EEG) [60]. • Affective: The second class of mental capabilities focuses on the emotional state, e.g. if the user is tired or angry. Sensing this allows the system to react on emotions and to create emotional feedback [61]. Cognitive and affective activity approaches are still relatively new fields in HCI. This overview focuses more on the physical interaction, which can be divided in three subcategories, related to human senses [62]: • Vision: Many input devices rely on human vision, as for example, pointing devices: mice, trackballs, graphic tablets and touch screens. Also commonly used visual output devices are screens and printers. • Audition: This category includes all means that involve hearing, human speech and audio signalization. • Touch: Although keyboards and buttons could be classified here, this category focuses more on all force passing interfaces. This includes sending sensations to human skin and muscles and receiving force feedback from the user. It is important to note that even for the simplest interfaces, this categorization can be vague. Since humans process information from the environment using different senses in parallel, it is difficult to distinguish between meaningful and meaningless stimuli. For example, keyboard keys have glyphs, which allow selecting keys visually, but they have also a force threshold that permits to sense the state by touching.
Recent Trends in HCI Although HCI and MMI have a long research tradition, only recent technological advancements allowed the implementation of techniques that were already proposed in the 1960s, like Augmented Reality (AR) [63]. This advancement enabled testing of new ideas in practical trials, giving rise to further investigation. New research trends that have become prominent in the past years are: Intelligent HCI, Adaptive HCI, Ubiquitous Computing and Ambient Intelligence [64, 65]. Intelligent HCI refers to all techniques that are intelligent in the sense of preprocessing data received from the user. Hence, simple interfaces become complex systems, enhancing the received data into a complete stream of information. Adaptive HCI refers to the adaptiveness of interfaces to become better suited to a certain user. An example of this is the T9 system [66] used in cell phones, allowing input of alphanumeric text with just a single press of the digit keys for each alphanumerical sign. It uses a form of intelligence, i.e. algorithms that process key sequences, comparing them with statistical models of languages and providing missing information. The T9 example is also useful to explain the concept of adaptiveness, because
122
R. M. Millán Vaquero et al.
the T9 interface can adapt to the user’s behavior by means of a custom dictionary where all exceptions are stored. The principle behind ubiquitous computing and ambient intelligence is to form a network of computers and interfaces that surround the user, sharing input and output of individual machines and creating a synergy of interactions [64]. In the HCI context, each channel of communication between human and machine is called a modality. This concept allows separating interfaces as unimodal and multimodal ones. Multimodal interfaces are becoming an increasingly prominent field of research [67]. However, multimodal realizations are only a combination of multiple unimodal systems. For the purpose of this overview it is enough to describe in detail only the building blocks, i.e. unimodal systems. More insight into multimodal systems is given in the context of multiscale interaction in the following sections.
Examples of Unimodal Systems in HCI Prominent examples for visual systems are algorithms that detect human faces on digitized images [68]. Starting with the simple detection, these methods soon evolved to analyze facial expressions. Improvements in computational power and resolution of images enabled full body movement tracking with markers [69] and without markers [70]. This progress allowed implementing gesture recognition systems [71]. Another interesting technique is gaze detection and eye tracking, which is commonly used as a form of communication for disabled people [72]. Audio systems have been growing in popularity since robust cloud based voice recognition systems have been introduced [73]. However, traditional desktop voice recognition systems are also starting to offer ways to recognize the speaker, based on a pre-learned database of voices [74]. Another approach to audio systems is the extraction of the emotional state of the speaker (laugh, cry, sigh) from audio signals in addition to the word content [75]. Sensor systems are commonly used. Keyboard, mouse, joystick are most prominent examples of sensor systems [62]. Pen based input grew popular for some time, as a highly natural means of communication, but because the implementation was unreliable and expensive, the idea of Tablet PC computing never became mainstream. With the renaissance of tablets, manufactured as light and mobile devices, it is expected that the pen-based input will become as important as touch-based interaction like keyboard and mouse [76]. Haptic and pressure interactions are valuable for robotics and medicine. These sensors allow robots to sense the environment as humans do, to enable telepresence application [77]. Biomedical approaches consider the utilization of sensor systems during microsurgeries. The use of the robotic interface could help translating senses of surgeon from a small movement scale to familiar macro surgery scale [78].
5 Visualization and User Interaction Methods for Multiscale Biomedical Data
123
Fig. 5.7 Superimposing of knee joint multiscale dataset (a). Features from diverse scales have a specific importance at the current point of view (b)
5.5 Potential Solutions for Biomedical Multiscale Visualization and Interaction In this section we present an overview of strategies on multiscale visualization and interaction for biomedical data. Especially the multiscale aspect requires novel approaches for graphical user interfaces (GUIs).
5.5.1 Multiscale Visualization The introduction of the strategies described below and the use of concepts coming from other disciplines are meant to improve the quality of current visualization systems, such as the tools presented in the Sect. 5.4.1 (Examples of Multiscale Visualization).
Strategies for Biomedical Multiscale Navigation The multiscale techniques described in Sect. 5.4.1 (Multiscale Techniques) have to be combined with several considerations in order to provide the scientist with a suitable multiscale environment. For this aim, we propose several system requirements for supporting multiscale navigation. Need for representing complex biological systems with interacting scales The development of new visualization models for data representation is required in order to provide an integrated framework that can be used to navigate across several scales. This framework should create spatial correlations in 3D structures to visualize multiple properties at the same time and in a compact way, facilitating the alignment of features from different scales (Fig. 5.7). The presentation of data must be adequate for the working environment, which is strongly related to the professionals using the tool (medical doctors, biologists, bioengineers, etc.). Selecting the optimal point of view and providing habitual software
124
R. M. Millán Vaquero et al.
tools can help them to focus on extracting valuable knowledge from the measurements. Consistent interaction The multi-scalar environment should lead to a modification of standard visualization navigation tools [79], for example, by reusing them at different navigation levels. Possible features are: • Incorporation of GUI into the visualization scene A standard GUI, composed of the 3D model and an interface based on (classic) windows and dialog boxes to configure the viewport, does not facilitate the transition between scales. The interface can be immersive or hybrid. – In the immersive case, the 3D model is the interface, where all actions and commands used to locate datasets (and metadata) require the user only to navigate to the right position in the virtual model. – Hybrid GUI provides features known from immersive 3D visualization such as a high degree of interactivity with the 3D model. However, it still provides access to standard desktop-based GUI widgets. • Automatic modification of navigation parameters Navigation and viewing parameters should be optimized to provide a seamless transition between two scales and reduce manual user inputs. Perception considerations Facilitating the perception of multiscale visualization is very relevant. Attentiveness should be aided by avoiding occlusions and through visual cues on the objects of interest (e.g. highlighted, always visible, conservation of focal point, …). 3D location awareness can be solved by navigation facilities (e.g. “here-you-are”, navigation mediator maps, landmarks, flexible viewpoint lists, and destination lists [80]). For instance, when click-and-zoom interaction is implemented, the involved movement should be slow enough in order to ensure that the user keeps the information of spatial position [81], but without any unnecessary delay (“as fast as suitable”). An initial virtual tour (e.g. from macroscale to microscale) presenting all these navigation facilities can rapidly improve the viewer’s perception. Influence of Other Disciplines The adoption of concepts coming from other disciplines and fields is necessary in order to increase the scientific meaning (see Sect. 5.3.2) and to create new ways to understand (multiscale) biomedical data. Knowledge Formalization Visualization researchers should consider the use of knowledge formalization principles to store meta-information efficiently along the data [19]. Ontology can be used to
5 Visualization and User Interaction Methods for Multiscale Biomedical Data
125
Fig. 5.8 Proposal of semantic visualization with ontology integration, represented with an information visualization view. This can be considered as another scale because information is presented in a different kind of abstraction. Images courtesy of 3B’s Research Group (histological images of meniscus and cartilage micro-CT dataset), OsiriX Project (knee CT dataset) [10], and LBB-MHH (gait motion analysis)
organize biomedical data into semantically connected pieces of information. Clear examples of that are tools for visually exploring biological networks as VisANT [82], which works with Gene Ontology [83]. The annotation of knowledge associated to the data, either ontology-driven or keyword-based, can provide a semantically meaningful visualization and interaction (see Fig. 5.8). The use of ontology concepts and relations could provide means for a rapid retrieval of interesting relations during the interaction with the system [84], for instance, allowing direct transition between parts that have similar meaning or have been stored in the same dataset, but their spatial position is different. In addition, the presentation of the content could be enhanced by view setup according to the stored user profile. This user profile knowledge would be based on analysis of ontology user queries and usage patterns [85]. Representation of uncertainty The representation of uncertainty and errors in 3D diagrams should have the same importance as in normal 2D scientific diagrams [41] because it is crucial for understanding the correctness of the visualization. There are several sources of uncertainty during the representation process: acquisition, model, transformation (i.e. rescaling, rotating) and visualization. Among others, the following methods can be used to present uncertainty: use of displacement glyphs, arrows or patterns, blurring (note the use of human psycho-physical abilities), and the combination of isosurfaces and
126
R. M. Millán Vaquero et al.
volume rendering methods. The representation of uncertainty can be an opportunity for the integration of scientific and information visualization [27]. Visual analytics The environments proposed should also provide tools to assist scientists to assimilate the resulting knowledge. Although data management and data mining are not covered in this chapter, they are also important in visual analytics, a multidisciplinary field that includes also visualization, HCI and perception concepts [85].
5.5.2 Multiscale Interaction This section describes different software and hardware techniques that could be applied in the multiscale context.
Navigation Since the dawn of the graphical interface era, the computer mouse has been the most popular pointing device. Pointing and clicking are common interaction patterns. They form a ground base for other interactions that can be used in a multiscale context [46]: • Click-and-zoom is used when sub-scale data is too small to be resolved on the display screen and it is marked by a token (labels, landmarks, etc.). The aim of the click is to magnify the target. The occlusion of tokens inside larger objects is a common problem. • The technique push-out avoids occlusion when the camera is inside an object and a path zooming out to the larger scale is constructed: a system can search the nearest open hole, generating a curved path that the camera will follow [79]. • Click-and-fly interactions move the visualization through the scene and do not necessarily imply a change of scale. • Look-and-fly allows the user to freely change the direction of zooming if the mouse cursor is moved during this process from the screen center to another position [79]. Traditional navigation, however, can be inefficient in environments of massive three-dimensional data. The introduction of 3D Computer Aided Design (CAD) required the development of 3D navigator devices that offer 6-DOF (degree of freedom) view control inside a virtual space. Using 6-DOF devices together with a standard pointing device could satisfy the input requirements. In this scenario, the 3D navigator would provide a position in space and a heading direction, giving an intersection plane of the screen where the view is cast on. The mouse pointer would then navigate through the simplified 2D content of the screen plane.
5 Visualization and User Interaction Methods for Multiscale Biomedical Data
127
Fig. 5.9 Example of augmented reality interaction. The user is wearing a VR helmet and is interacting with VR content with a reference image of reality
As humans tend to solve two dimensional problems more quickly than three dimensional ones [86], it is worth simplifying the model of navigation by limiting the number of dimensions where it is applicable. A good example of dimension reduction is a geographic coordinate system. Every position on a three dimensional planet is limited to a point on a surface, described by two angles [87]. While considering this, it should be kept in mind that temporal data introduce time as another dimension.
Augmented Reality Generating a convincing reconstruction of the world is difficult to achieve. Another approach tries to enhance live video images with abstract data visualization, the so called augmented reality [88]. In the multiscale context, the augmented reality approach could improve understanding of visualization and solve 3D navigation issues. Humans have natural awareness of their position and are able to navigate in space. The user can freely approach objects and examine them from different angles. Therefore, viewing multiscale content overlaid on real objects could be most natural in terms of navigation and interaction. Of course, the realization of such interaction is non-trivial. Benefits, however, outweigh potential problems, e.g. transformation of pre-registered datasets to fit the current pose of the subject. Augmented reality can be realized with different tools like: • using a tablet device to compute a virtual “image frame”, showing the live recorded background combined with visualization, • using a wearable head mounted translucent display, e.g. Google Glass [89] or
128
R. M. Millán Vaquero et al.
Fig. 5.10 Welfenlab virtual reality room with a Haption INCATM 6D device
• a VR helmet (Fig. 5.9) with an additional camera source for the reference image of reality [63]. Different interfaces allow different scenarios of interaction. However, a common use scenario for all of the described technologies is e.g. a slate perspective. In this scenario the augmented reality display is a “window” to view data overlaid on a real-time image of a subject.
Haptic Interaction As noted in Sect. 5.4.2, touch and haptic interfaces play significant roles in medical applications. An example of a haptic environment is presented in Fig. 5.10. The ability to give haptic feedback, while preparing pre-operational planning, is crucial for achieving success in medical procedures e.g. assembling fragments of fractured bones. Vlasov et al. describe different approaches for haptic rendering [90–92]. As many diagnostic procedures involve touch examination, creating a synergy between touch and access to digitally recreated multiscale content can be invaluable as a new diagnostic modality.
Gesture Interaction As it has already been mentioned, much of multiscale medical content has rich diagnostic meaning and can be used for pre-operational planning. Therefore, creating a strategy for utilizing gesture interaction for a sterile surgery room should be considered as important. This kind of interaction should not only be limited to navigation but could also allow interactive modification and processing of data. Beside hand gestures, facial expressions can play an important role in multiscale environments. As an example, visual systems detecting an eye wink can help in reducing user tasks [93].
5 Visualization and User Interaction Methods for Multiscale Biomedical Data
129
5.6 Conclusions The creation of an integrated multiscale visualization framework is only possible when the conception is changed: the system should be user- and field-centric. Human perception considerations and tight cooperation between study domains and visualization researchers should become the gold standard. In addition, new concepts in this field, e.g. statistical parameters and the utilization of ontologies, can consolidate experimental data. All these efforts should serve a single purpose: to improve understanding. In the recent years, interaction strategies underwent a revolution. Technologies that were previously considered too expensive have become widely available. This allows interaction with biomedical data with new (low cost) interfaces, ameliorating the user experience. Multiscale visualization and interaction are challenging disciplines of research. These areas are constantly evolving and expanding to other fields. Due to a multitude of expertise required, creating a good multiscale design is a demanding task. Future progress in this field will depend on the utilization of current trends and further expansion in user experience and ontological/semantic directions. Acknowledgments This work was supported by the framework of the EU Marie Curie Project MultiScaleHuman (FP7-PEOPLE-2011-ITN, Grant agreement no.: 289897).
References 1. Walter, T., et al. (2010). Visualization of image data from cells to organisms. Nature Methods, 7, S26–S41. 2. Levenson, R. M., & Mansfield, J. R. (2006). Multispectral imaging in biology and medicine: Slices of life. Cytometry Part A, 69A(8), 748–758. 3. Chiang, Y. J., et al. (2003). Out-of-core algorithms for scientific visualization and computer graphics. IEEE Visualization, 22(1), 35–48. 4. Friese, K.-I., et al. (2013). Analysis of tomographic mineralogical data using YaDiV–Overview and practical case study. Computers and Geosciences, 56, 92–103. 5. Friese, K. I., et al. (2011). YaDiV–an open platform for 3D visualization and 3D segmentation of medical data. The Visual Computer, 27(2), 129–139. 6. Auer, M., et al. (2007). Development of multiscale biological image data analysis: Review of 2006 international workshop on multiscale biological imaging, data mining and informatics, Santa Barbara, USA (BII06). BMC Cell Biology, 8(1), S1. 7. Jmol: an open-source Java viewer for chemical structures in 3D, http://www.jmol.org/ 8. OsiriX Imaging Software, DICOM sample image sets, http://www.osirix-viewer.com/datasets/ 9. Fishman, E. K., & Kuszyk, B. (2001). 3D imaging: Musculoskeletal applications. Critical Reviews in Diagnostic Imaging, 42(1), 59–100. 10. Oden, J. T. et al. (2006). Simulation-based engineering science: Revolutionizing engineering science through simulation, http://www.nsf.gov/pubs/reports/sbes_final_report.pdf 11. Han, L., et al. (2011). Nanomechanics of the cartilage extracellular matrix. Annual Review of Materials Research, 41, 133. 12. Testi, D. et al. (2012). New interactive visualisation of multiscale biomedical data. ACM SIGGRAPH 2012 Posters, (pp. 76:1–76:1), ACM, New York.
130
R. M. Millán Vaquero et al.
13. Viceconti, M., et al. (2007). Multimod Data Manager: A tool for data fusion. Computer Methods and Programs in Biomedicine, 87(2), 148–159. 14. MultiScaleHuman Project (2012). MultiScaleHuman Project, http://multiscalehuman.miralab. ch/ 15. Kleemann, R. U., et al. (2005). Altered cartilage mechanics and histology in knee osteoarthritis: Relation to clinical assessment (ICRS Grade). Osteoarthritis Cartilage, 13(11), 958–963. 16. Loeuille, D., et al. (2005). Macroscopic and microscopic features of synovial membrane inflammation in the osteoarthritic knee: Correlating magnetic resonance imaging findings with disease severity. Arthritis and Rheumatism, 52(11), 3492–3501. 17. Liu, W. K., et al. (2006). Immersed finite element method and its applications to biological systems. Computer Methods in Applied Mechanics and Engineering, 195(13–16), 1722–1749. 18. Mcfarlane, N. J. B. et al. (2012). A survey and classification of visualisation in multiscale biomedical applications. Information Visualisation (IV), 2012 16th International Conference on. pp. 561–566. 19. Chen, J., et al. (2005). Grand challenges for multimodal bio-medical systems. IEEE Circuits and Systems Magazine, 5(2), 46–52. 20. Lorensen, B. (2004). On the death of visualization. Proceedings of the NIH/NSF Fall 2004 Workshop on Visualization Research Challenges. 21. O’Donoghue, S. I., et al. (2010). Visualizing biological data–now and in the future. Nature Methods, 7, S2–S4. 22. Nielson, G. M., et al. (Eds.). (1997). Scientific visualization, overviews, methodologies, and techniques. Washington: IEEE Computer Society. 23. Huang, N. E., & Shen, S. S. P. (2005). Hilbert-Huang Transform and Its Applications. World Scientific, 5, 1–15. 24. Helgason, S. (1999). The Radon transform, Springer. 25. Leach, A. R. (2001). Molecular modelling: Principles and applications. Harlow: Pearson Education. 26. Card, S. K., et al. (1999). Readings in information visualization: Using vision to think. San Francisco, CA: Morgan Kaufmann. 27. Johnson, C. (2004). Top scientific visualization research problems. IEEE Computer Graphics and Applications, 24(4), 13–17. 28. Van Wijk, J. J. (2005). The value of visualization. Proceedings of the 16th Conference IEEE Visualization (VIS 05), pp. 79–86. 29. Evanko, D. (2010). Supplement on visualizing biological data. Nature Methods, 7, S1–S1. 30. Rhyne, T.-M. (2003). Does the difference between information and scientific visualization really matter? IEEE Computer Graphics and Applications, 23(3), 6–8. 31. Rhyne, T. M. et al. (2003). Information and scientific visualization: Separate but equal or happy together at last. Proceedings of the 14th IEEE Visualization, p. 115. 32. Healey, C. G., & Enns, J. T. (1998). On the use of perceptual cues & Data mining for effective visualization of scientific datasets. In Proceedings Graphics, Interface, pp. 177–184. 33. Kosara, R., et al. (2003). Thoughts on user studies: Why, how, and when. IEEE Computer Graphics and Applications, 23(4), 20–25. 34. Tory, M., & Moller, T. (2004). Human factors in visualization research. IEEE Transactions on Visualization and Computer Graphics, 10(1), 72–84. 35. Damle, A. (2002). Explain me visually: Exploring information design through multimedia. Information visualisation, 2002. Proceedings of the Sixth International Conference on, pp. 265–267. 36. Springmeyer, R. R., et al. (1992). A characterization of the scientific data analysis process. Proceedings of the 3rd Conference on Visualization’92, pp. 235–242. 37. Ibrahim, N., & Noor, N. F. M. (2004). Navigation technique in 3D information visualisation. Proceedings IEEE Region 10 Conference TENCON 2004, pp. 379–382. 38. Bajaj, C., et al. (2003). Volumetric feature extraction and visualization of tomographic molecular imaging. Journal of Structural Biology, 144(1–2), 132–143.
5 Visualization and User Interaction Methods for Multiscale Biomedical Data
131
39. Yu, Z., & Bajaj, C. (2004). A fast and adaptive method for image contrast enhancement. Proceedings of 2004 IEEE International Conference on Image Processing (ICIP’04). Vol., 2, 1001–1004. 40. Bajaj, C., & Goswami, S. (2009). Modeling cardiovascular anatomy from patient-specific imaging. In J. M. R. S. Tavares & R. M. N. Jorge (Eds.), Advances in computational vision and medical image processing (pp. 1–28). Netherlands: Springer. 41. Johnson, C. R., & Sanderson, A. R. (2003). A next step: Visualizing errors and uncertainty. IEEE Computer Graphics and Applications, 23(5), 6–10. 42. Westerhoff, H. (2012). White paper: VPH, Molecular Systems Biology (MSB), and their ITFoM, http://www.itfom.eu/images/article_PDFs/white_paper_vph_msb_itfom_2012.pdf 43. O’Donoghue, S. I., et al. (2004). The SRS 3D module: Integrating structures, sequences and features. Bioinformatics, 20(15), 2476–2478. 44. Rhead, B., et al. (2010). The UCSC Genome Browser database: Update 2010. Nucleic Acids Research, 38(1), D613–D619. 45. Gehlenborg, N., et al. (2010). Visualization of omics data for systems biology. Nature Methods, 7, S56–S68. 46. McFarlane, N., et al. (2012). Report on best practice, Multiscale Spatio-temporal Visualisation Project. 47. Hansen, C. D., & Johnson, C. R. (2005). Visualization handbook. San Diego: Academic Press. 48. Luebke, D., et al. (2002). Level of detail for 3D graphics. San Francisco: Morgan Kaufmann. 49. Staadt, O. G., et al. (2007). Interactive processing and visualization of image data for biomedical and life science applications. BMC Cell Biology, 8(1), S10. 50. Biodigital Human (2012). Biodigital Human, https://www.biodigitalhuman.com/ 51. Zygote Body (2012). Zygote Body http://www.zygotebody.com/ 52. Hunter, P., et al. (2010). A vision and strategy for the virtual physiological human in 2010 and beyond. Philosophical Transactions of The Royal Society: A Mathematical Physical and Engineering Sciences, 368(1920), 2595–2614. 53. Testi, D., et al. (2011). Interactive visualization of multiscale biomedical data: An integrated approach. Proceedings of the 1st IEEE Symposium on Biological Data Visualization (BioVis), pp. 3–4. 54. Visualization Toolkit (2012). Visualization Toolkit, http://www.vtk.org/ 55. Caban, J. J., et al. (2007). Rapid development of medical imaging tools with open-source libraries. Journal of Digital Imaging, 20(Suppl 1), 83–93. 56. Leardini, A., et al. (2005). Advanced multimodal visualisation of clinical gait and fluoroscopy analyses in the assessment of total knee replacement. Computer Methods and Programs in Biomedicine, 79(3), 227–240. 57. Karray, F., et al. (2008). Human-Computer Interaction: Overview on state of the art. International Journal on Smart Sensing and Intelligent Systems, 1(1), 137–159. 58. McNamara, N., & Kirakowski, J. (2006). Functionality, usability, and user experience: Three areas of concern. Interactions., 13(6), 26–28. 59. St Amant, R., & Riedl, M. O. (2001). A perception/action substrate for cognitive modeling in HCI. International Journal of Human-Computer Studies, 55(1), 15–39. 60. Cutrell, E., & Tan, D. (2008). BCI for passive input in HCI. Proceedings of CHI. 61. Picard, R. W. (1999). Affective computing for HCI. Proceedings of HCI International (8th International Conference on Human-Computer Interaction): Ergonomics and User Interfaces, pp. 829–833. 62. Myers, B. A. (1998). A brief history of human-computer interaction technology. Interactions, 5(2), 44–54. 63. Sutherland, I. E. (1968). A head-mounted three dimensional display. Proceedings of Fall Joint Computer Conf., pp. 757–764, Washington: Thompson Books. 64. Friedewald, M., & Raabe, O. (2011). Ubiquitous computing: An overview of technology impacts. Telematics Informatics, 28(2), 55–65. 65. Maybury, M. (1998). Intelligent user interfaces: an introduction. Proceedings of the 4th International Conference on Intelligent User interfaces, pp. 3–4.
132
R. M. Millán Vaquero et al.
66. How, Y., & Kan. M. Y. (2005). Optimizing predictive text entry for short message service on mobile phones. Proceedings of HCII. 67. Jaimes, A., & Sebe, N. (2007). Multimodal human-computer interaction: A survey. Computer Vision and Image Understanding, 108(1–2), 116–134. 68. Hjelmås, E., & Low, B. K. (2001). Face detection: A survey. Computer Vision and Image Understanding, 83(3), 236–274. 69. Herda, L., et al. (2000). Skeleton-based motion capture for robust reconstruction of human motion. In Proceedings of Computer Animation, 2000, 77–83. 70. Lange, B., et al. (2011). Markerless full body tracking: Depth-sensing technology within virtual environments. Simulation and Education Conference (I/ITSEC) : The Interservice/Industry Training. 71. Mitra, S., & Acharya, T. (2007). Gesture recognition: A survey. IEEE Transactions on Systems, Man and Cybernetics, Part C: Applications and Reviews, 37(3), 311–324. 72. Jacob, R. J. K., & Karn, K. S. (2003). Eye tracking in human-computer interaction and usability research: Ready to deliver the promises. Mind, 2(3), 4. 73. Bennett, I. M., et al. (2003). Distributed realtime speech recognition system. 74. Zwyssig, E., et al. (2012). Determining the number of speakers in a meeting using microphone array features. 2012 IEEE International Conference on Acoustics Speech and, Signal Processing (ICASSP), (pp. 4765–4768). 75. Vogt, T., et al. (2008). EmoVoice–a framework for online recognition of emotions from voice. In E. André (Ed.), Perception in multimodal dialogue systems (pp. 188–199). Berlin Heidelberg: Springer. 76. Hume, S. (2001). Pen-based computing. Applied Clinical Trials, 10(7), 32. 77. Ueberle, M., et al. (2009). Haptic feedback systems for virtual reality and telepresence applications. Feedback, 56, 97. 78. Okamura, A. M. (2009). Haptic feedback in robot-assisted minimally invasive surgery. Current Opinion in Urology, 19(1), 102. 79. McCrae, J., et al. (2009). Multiscale 3D navigation. Proceedings of the 2009 Symposium on Interactive 3D Graphics and Games, p. 714. 80. Darken, R. P., & Peterson, B. (2002). Spatial orientation, wayfinding, and representation (pp. 493–518). Handbook of Virtual Environments, Mahwah NJ : Lawrence Erlbaum Associates. 81. McFarlane, N. J. B., et al. (2008). 3D Multiscale visualisation for medical datasets. BioMedical Visualization, 2008. MEDIVIS’08. Fifth International Conference. pp. 47–52. 82. Hu, Z., et al. (2009). VisANT 3.5: multi-scale network visualization, analysis and inference based on the gene ontology. Nucleic Acids Research, 37(suppl 2), W115–W121. 83. Gene Ontology Project (2012). Gene Ontology Project, http://www.geneontology.org 84. Catalano, C. E., et al. (2011). Semantics and 3D media: Current issues and perspectives. Computers and Graphics, 35(4), 869–877. 85. Keim, D., et al. (2008). Visual analytics: Definition, process, and challenges. In A. Kerren (Ed.), Information Visualization (pp. 154–175). Berlin Heidelberg: Springer. 86. Bowman, D. A., et al. (2008). 3D user interfaces: New directions and perspectives. IEEE Computer Graphics and Applications, 28(6), 20–36. 87. Hanson, A. J., & Wernert, E. A. (1997). Constrained 3D navigation with 2D controllers. Proceedings of Visualization ’97, pp. 175–182. 88. Azuma, R. T. (1997). A survey of augmented reality. Presence: Teleoperators and Virtual Environments, 6(4), 355–385. 89. Hodson, H. (2012). Wearable gadgets enhance symbiosis of man and machine. New Scientist, 216(2886), 22. 90. Vlasov, R., et al. (2013). Haptic rendering of volume data with collision detection guarantee using path finding. In Transactions on Computational Science XVIII (pp. 212–231). Berlin Heidelberg: Springer. 91. Vlasov, R., et al. (2012). Haptic rendering of volume data with collision determination guarantee using ray casting and implicit surface representation. 2012 International Conference on Cyberworlds (CW), pp. 91–98.
5 Visualization and User Interaction Methods for Multiscale Biomedical Data
133
92. Vlasov, R., et al. (2012). Ray casting for collision detection in haptic rendering of volume data. Proceedings of the ACM SIGGRAPH Symposium on Interactive 3D Graphics and Games. (pp. 215–215), New York: ACM. 93. Abásolo, M. J., & Della, J. M. (2007). Magallanes: 3d navigation for everybody. Proceedings of the 5th international conference on Computer graphics and interactive techniques in Australia and Southeast, Asia. pp. 135–142.