15-16 September 2011, BULGARIA
273 Proceedings of the International Conference on Information Technologies (InfoTech-2011) 15-16 September 2011, Bulgaria
VISUALIZATION AS DECISION SUPPORT SYSTEM TECHNOLOGY IN THE LOCAL GOVERNMENT SERVICES Snezana Savoska, Violeta Manevska Faculty of administration and management information systems e-mails:
[email protected],
[email protected] R. of Macedonia Abstract: Urban planning and building is a very important task for the Department for communal arrangement in the Local Municipality. Many of these sectors possess transactional information system where the data of all one-stop-shop systems in the local Municipalities systems are saved. This data is an excellent base for Data Warehouse creation which is necessary for support of Decision making processes for managers and analytical staff of government institution that make decisions. But, the data must be prepare data for effective visualization. It is obvious, “One picture is worth a thousand words”. Key words: Decision making; Visualization; Data Warehouse; Local Government services
1. INTRODUCTION Every day’s urban planning and building is an important task for the Department for urban planning, communal arrangement and environment (UPCAE) of the Local government (LG). Day’s operations are stored in the operational information systems, called Transactional information systems (TIS). Many of these sectors possess TIS with data from one-stop-shop system and other IS in the LG. The data in the LG departments’ databases is analytical and obtained from different sources. Analytical data are saved in the TIS and shows every day’s operations of data input and acquisition of data in the automated processes. As such, in the Communal arrangement part, there is data for the citizen’s demands for building, their plans for building of working or living space and other necessary data. These
274
PROCEEDINGS of the International Conference InfoTech-2011
data include information about urban zone, type of building space, size of inbuilt space, the paid amount for communal arrangement and other data. These sources can be an excellent base for creation of Data Warehouse (DW), a repository or huge store of data which is a decision making support tool for managers and analytical staff of the LG. However, in the beginning, it is necessary to create an organizational or department’s DW and visualization tools. It is obvious that “One picture is worth a thousand words”. Using visual data representations, the managers can make more effective decisions on each level of hierarchy. Every level of management has some specifics. Top-level managers want to see strategic information, based on the predictions. The managers of the tactical level want to see mixed internal historical information. Operational managers need information from the present, usually for operation control. In this paper, we propose a new functionality of the existing data to obtain effective visual representation of information. The data is taken from LG transactional information systems (TIS) from a period of four years and integrated in a Data Warehouse. The main idea is integration of all isolated islands of data in LG. For example, data from Department of UPCAE in the city are chronologically integrated, extracted, cleaned and then loaded in the DW. This means that IT experts must create specific structure of data repository, where data will be loaded from transactional databases and integrated for this purpose. First of all, data must be taken from data sources, recoded with unique organizational cods, cleansed from noisy data, included additional data for each record and transformed for the purpose of DW. Then can be loaded in the DW. From the DW, managers can bring reports and visual data representations in their desktops. These visualizations give some aspects of how to plan future infrastructure. This information is needed because only with analyses, managers can see the need of improvement in particular sectors and make plans for suitable adjustments. When the managers analyze aggregated data, they also can see analytical data from databases with drill-down property. This is the way to gain analytical data from aggregated data with click on the specific data. Usually they use these methods to find some anomalies. This method is called Management by exceptions. Because the visualization process in high performance demanding, the effective data visualization means obtaining data in acceptable time period. 2. PROBLEM DEFINITION LG manager’s information systems focus on the following main aims: 1. Bringing aggregated data from transactional data bases by defined procedures and properties. 2. Analysis of the fiscal system - public finances - citizen’s taxes payment and control of the spending of that money. 3. Managing employee’s time.
15-16 September 2011, BULGARIA
275
4. Control of finished project - analysis of different dimensions of the projects. This means resources and time analysis, especially results of the projects. 5. Creating of budget and plan; controlling the planned activities realization. But, in practice, the data is very complex. The data is dispersed in the different servers, in TIS, web pages or some content management systems in or out of the organization. The databases are non-consistent, have different values and codes for different entities and usually it is hard to integrate them. Because the data integration is the main condition for obtaining quality data for decision making, it is important to gain a source of integrated data for managers. The manager’s time is the most expensive in the organizations, but in spite of this, the managers and their teams spend a lot of time on gaining information from data in non-automated or semi-automated manner. The number of staff for data preparation also increases. This means that the value and price of information increases all the time. As the organization grows bigger, the amount of information increases exponentially and usually becomes impossible to gain information in time, without sophisticated informational support. The manager’s decision making process is essential for company’s positioning in the environment as well as avoiding loss of capital, staff or material – all of which mean damage for the organization. For the Administrative managers, it means the citizen’s satisfaction as user of administrative services and more resources for future services. 3. HOW THE PROBLEM CAN BE SOLVED The idea of gaining quick visual information for decision makers is not new. But, it became popular with the increase of the number of data, acquired with sensors or some other manner, such as card readers or measurement instruments. The stored digital data gives another opportunity for analysis. Computers can be of help for this purpose. But, data must be first stored in the specific way – centralized in huge memory repository, created especially for data analysis. These repositories are data warehouses and have specific data structure suitable for manager’s data analysis, adhoc reporting and data visualization. The DW has to meet some conditions: First of all, it must integrate data from the different administration’s departments from LG. There has to be an organizational data dictionary for all data in the administration’s units which will share information. The data dictionary must define all entities, relationships, attributes and methods. In other worlds, all relevant data first must be defined, all sources must be discovered, recoded, and transformed. Then, all data must be loaded in the data warehouse – a new organizational source of knowledge. The metadata for DW must be defined as well as the source databases metadata, the target metadata for manager’s usage and how the source data can be extracted, transformed and loaded in the target DW repository.
276
PROCEEDINGS of the International Conference InfoTech-2011
The models and techniques for effective data aggregation must be defined in the data dictionary and help files. This is necessary because the managers have to know the algorithms for their calculations, in order to use them. In other words, some complex mechanism for bringing all necessary information on the manager’s desktops must be created. There has to be some effective, user-friendly humancomputer interface for gaining effective information from data. 4. THE OFFERED SOLUTION AND THE NEEDED ACTIONS Information Visualization today offers a wide range of techniques and approaches that can be used to visualize and analyze business data (Tegarden 1999). When we analyze the main aims, mentioned in the previous part, the drown conclusion lead to the concept of using visualization with creation DW for the administration of the LG. It is not only electronic physical data repository, but also an “organizational brain”. And all of this is like fine music, but we must know that to prepare these repositories is not an easy task – this is an extremely difficult project. A little bit of history: The concept of data warehousing was defined in 1992 by Inmon and Kimbell (Inmon, 2002, Brandstätter, 2007) and it demands sophisticated conditions for its implementation. The first demand point is existence of a needed level of organizational culture in the target organization. The second demand point is strong organizational manager’s will and decision for DW implementation, as well as good manager’s and staff’s training for mining of DW and it’s role in the organization. In other words, the DW creation demands a strong project’s sponsor. Also, there must be some satisfied data accuracy in the transactional databases. All of these prerequisites must be satisfied if we are thinking about DW creation. But, to start this project, there must be a wide front of organizational cohesion (readiness of all organizational members for DW implementation), staff’s dedication and readiness to accept the changes. The staff’s motivation for DW creation is important. However, this motivation can be achieved just as the staff’s vision for gained achievements of the project implementation. Also the managers must be present in all phases in DW implementation, because they will be planners of its future usage; they must define the dynamics and data delivery to their desktops. Usually, the first phase of analysis process is top-down analysis of the organizational demands. In this phase, all data demands must be strongly defined and put in the desk. The second phase is transactional information system’s analysis, in which the sources data for DW will be defined. Also, the transformation and metadata of the sources and targets have to be defined. These two phases of analysis must be compared and some conclusions have to be gained about organizational readiness of DW implementation. Sometimes, there must be a conclusion drawn, that it is better to create sectional data repository, called data marts, instead of organizational DW. The reason for this is the lack of organizational readiness for DW implementation.
15-16 September 2011, BULGARIA
277
When this phase is finished, the planning and implementation of organizational DW is ready to start. First, the bases have to be de-normalized. Then, some triggers, queries and preparation for usage have to be done. Further, the training must be organized soon as is possible. In the end, the managers and analyst must be trained for end-user’s tools using. In case of creating organizational DW for LG in some city in the R. of Macedonia, we began with bottom-up analysis. This refers to analysis of present (“it is”) information systems (IS). The visual representation of parts of IS in the LG are shown in the Figure 1. There are many information systems in the LG that look like islands. They are not connected, produced by different vendors and programmers in different times, servers and donors. Many of them are created from EU projects, but are not completely implemented. There is not holistic “picture” of data in LG.
Fig.1 Visual representation of “it is” LG IS
Data produced in the supervision sector is not stored in any database; it is stored in Word or Excel documents. Also, data for illegal building, building field status, problems with objects and locations is stored in word and excel documents in the personal computers or servers and are not available for other sectors in LG. The finance sector has its own information systems (islands) with final documents in the LG, for budgeting, public investments, taxes, employee’s payments and all costs for LG. But, this data is separated in different IS, without unique cods and can’t provide a good data analysis reports. The annual plans of the sectors are places in the forms in word or excel documents on the personal computers or database servers. The reports for plan’s realization are also created in a Word or Excel document and are not prepared in proper form for data analysis. All of these forms demand detailed data study and preparation, data coding and modeling for obtaining proper data forms for data analysis. The general sector possesses TIS for archiving, web content management (Annual report 2007, Prilep, RM), and information system for schools, cultural and social services, as well as office of legislative services. The valuable data for DW
278
PROCEEDINGS of the International Conference InfoTech-2011
from these sectors must be analyzed, prepared as coded data and added to entry screens in their TIS. Because of the low level of data preparation in this sector, all these data will be solved in third phase. In this moment, the data from the general sector in the DW will be empty. The data from department of UPCAE are stored in partitioned part of information systems. We have data from communal arrangement sector for 4 years. There are 603 records in flat table in the DW for building permissions with many attributes. All of these records have their own analytic data – 122 435 data records in analytical tables. The following data integration for the LG sectors is gaining data for different groups of communal investments of LG, grouped by urban zones. This is important for planning the infrastructure object building and gaining control over them, depending on the urban zone where an investment must be done. This will provide quantitative and transparent analysis of the spending of the budget, depending on the location of the investment (urban zone), project number or vendor (builder). The citizens will have good and transparent information. The level of preparation of this data, cods and document’s types weren’t sufficient for data warehouse and can’t integrate without detail study and preparation. For these reasons, they will be solved in another phase of the project. The supervision sector must prepare its information as coded information for building locations, cods of building license or communal infrastructure building number. All building controls, illegal buildings, environment, traffic or urban controls must be coded and stored in database. These propositions must be considered from the TIS administrators. In this moment we still don’t have these data and all files in the DW are empty. For gaining the complete information for creating plans and a budget of the LG, all sectors in the LG must create some predictions about fiscal plan and prepare information in the semi-automated way. This means that the sector’s managers have to spend their own time and the time of the staff to prepare desired information for detail and main budget plan. The data is prepared and post to the main planner which prepares the budget plan for next fiscal year. If the managers have the right information and the desired visual representation, they will spend less time for data analysis and planning and will make a right decision for communal building and all other information desired for creating department’s plans. Because the organizational data dictionary was not yet created, first off all, we proposed creation of organizational data dictionary for all organizational entities, relationships and attributes. We collected them from existing data codes, some of them were recoded, some accepted and some of them are added because of nonexistence. In this phase, we created organizational help files, placed in the LG’s web site. Data of all dimensions has to be coded and put in the organizational data dictionary. Also, all DW metadata and used models have to be defined and stored in
15-16 September 2011, BULGARIA
279
the DW repository. Some examples of this are coding of urban zones, streets, locations of streets, project’s codes, budget code, and more. The second phase contained making some proposition for couple transactional information systems improvements. Usually this kind of improvements mean enrichment of entry data screens with some other data, such as project coding, code of belonging data, budget and account number and others.
Fig. 2 DW for Department of UPCAE, and it’s main format
When this analysis is done, the analyst must create Data flow diagrams and Entity relationship diagrams for the LG. This way, the complexity in the data will be understood with decomposition of DFD diagrams. Next step is DW planning and creating dimensional data model of tables. The main data format for the DW, prepared in the first phase from UPCAE department is shown on figure 2. 5. DATA VISUALIZATION FOR EFECTIVE DATA ANALYSIS One of the used techniques for visual data analysis is OLAP cubes (Online analytical processes) from DW and Excel pivot tables as end-user tools for data extracting, filtering and visualizing (SQL Server Architecture, msn.com). In this technique, the managers can use Management by exception and Management by perception models. The managers also can use more sophisticated tools for data visualization, such as EIS and ESS systems, Matlab, XmdvTools, Tableau, Cognos, VizIt for multidimensional data analysis. However they need more time for preparation from IT stuff and also more time for manager’s training for using these tools. When we talk about analysis of multidimensional data, there are many techniques which can be used for multidimensional data visualization. For this purpose, we used the technique of parallel coordinates. This technique provides analysis in many dimensions, placed on the plane as parallel axis of the Y-axes. We
280
PROCEEDINGS of the International Conference InfoTech-2011
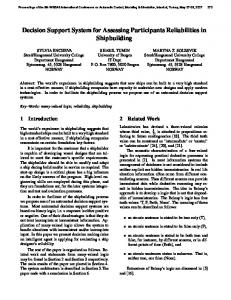
can place as many axes as we have analyzed in the screen. This means that one line represents one data record of the flat data table. When we analyze the correlation between data, we can see that there is a positive or negative relationship between them. If the lines are parallel or near parallel, the correlation is positive, but when the lines intersect, we can see a negative data correlation (figures 3 - MathWorks, 2009). Colors on figure 3 show groups by urban zones. The left and right sides show the quantity of building living and working space, respectively. The managers can see the concentration of building interest in location and also can see some anomalies in the data, such as building in a non-existing urban zone. With drill-down properties they can analyze all anomalies (management by exception) and can make conclusions about them.
Fig. 3 Visual data representation for manager’s report for building living and working space in 4 years in the city, group by urban zone
Fig. 4 XmdvTools tool – LG data for communal arrangement – 6 data axes for relevant data for managers and distortion of axes
Another tool for effective visual analysis is XmdvTool, which can enable different multidimensional visualization techniques as parallel coordinates (Shneiderman, Brandstätter, 2007), dimensional stacking, glyphs or pixel oriented
15-16 September 2011, BULGARIA
281
display. The visual representation of the same data is presented in the figure 4. For gaining property visual analysis, the data from the DW must be prepared in the specific manner, by IT programmers. But, when the data is prepared, the managers can interact with this data with methods such as select and zoom, brush and distort. This means that they will have a tool for creating some predictive models for future. An example for this model is the “what-if” analysis for some decision making problems with visualization tools. Although the complexity and the need for data preparation, these tools provide many advantages for managers. They can provide analysis in many dimension and measures in the same screen and in the same time, with interaction possibility. This method of using predictive tools for decision making can be very effective for the LG managers, because of understanding future trends or citizen’s needs. With the DW implementation, they will have possibility to analyze much more parameters and measures. They will also often prevent bad decisions. This data can be published or used in reports. Business intelligence tool which is used for this purpose is Tableau software tools (TABLEAU Training). These tools have easy-to-use interface and data can be prepared of one of the needed databases. Some example of data visualization from the previous datasets, prepared with Tableau software tool are shown on the figure 5. The concept of CASE software tool has many advantages and leads to automated processes of data updating and usage of additional software tools for data visualization.
Fig. 5 Tableau software tool, BI visualization and data analysis
The correlation between building taxes and investments according to urban zones is an important thing to be noticed in order for the managers to decide in which zone to invest (present communal arrangement of streets, sewage, water supply or street power and illumination). The gained data will be placed in the separated axes on parallel coordinate representation and then the managers can see the correlation between money paid for each urban zone and investments in that zone. This will be an excellent decision making tool for planning future investment in a city’s urban zone. It will be a tool for manager’s quick data understanding and
282
PROCEEDINGS of the International Conference InfoTech-2011
also for bringing the facts beside the decision. For this purpose, we recommend to enrich the TIS entry screens with data about cost center, urban zone and code of project for all data entry in the finance department. The visualization will compare the amount of money paid and spent for communal arrangement in each urban zone.
6. CONCLUSION The concept of data visualization from organizational data warehouse is the most desirable solution for helping manager’s decision making process. This is a very intensive concept which demands high organizational readiness and employee’s motivation for DW creation. This concept, combined with tools for data visualization, brings many advantages for managers and analytical staff. For this purpose, an example of creation of a part of DW is shown above: we show DW with data of the UPSAE department. Much of the needed data is absent, but from this case study, it is obvious that this method brings needed information in a short time. Data obtained in this short time, in the visual format in one screen, has to be a good base for the decision making processes. This would mean expert’s decisions, instead political decisions, less traumatic process, less spent time for data analysis, possibility of group decision making and protection of managers from political pressure and attacks from the government officials. These facts would be the most desirable community impacts, because they would provide transparent view of real data, presented in a convenient way for decision support. REFERENCES Brandstätter A., “Visualization of Online Sales Databases - Parallel Coordinated Hierarchies”, University Wien, 2007 Inmon W.H., Building the Data Warehouse, Fourth edition, Wiley Publishing. Inc., 2005 Matlab, The MathWorks Inc., Matlab, the language of technical computing, 2003 Opstina Prilep. Annual report 2007. 2009. www.prilep.gov.mk SQL Server Architecture, SQL Server 2000 Data Warehouse and OLAP Components, 2009, www.microsoft.com Turban E., McLean E., Wetherbe J., “Information Technology for Management – transforming business in the digital economy”, John Wiley&Sons TABLEAU Training, 2009, www.tableausoftware.com Tegarden D., “Business information visualization”, CAIS, 1999 UNESCO. Sustainable Urbanization. 2009, http://www.unesco.org/en/esd/