Visualization-based Tracking System Using Mobile Device Phuoc Vinh Tran*, Trung Vinh Tran*, and Hong Thi Nguyen* * University of Information Technology, Lintrung, Thuduc, Hochiminh City, Vietnam *
[email protected], *
[email protected], **
[email protected] *
Abstract. Services monitoring freight vehicle on route have been responding an increasing number of demands of goods owners. This chapter proposes a visualization-based tracking system using mobile device to enable users to keep track of the status of their freights ubiquitously in real time by viewing comprehensive graphs on mobile devices. The system comprises a moving device implemented on vehicle, a mobile device serving as owner’s controller, data transmission line, and map service. Data of location and conditions of vehicle from moving device are transmitted to mobile device to display as graphs. Based on space-time cube, we developed a cube to visualize location and freight weight, where location changes over time and goods weight at locations and over time. A software of diverse display modes was implemented to convert collected data into visual graphs to facilitate users’ comprehension on the location of vehicle and the status of their goods in real time. Keywords: mobile device, visualization, space-time cube, tracking system, visualization-based tracking system
1 Introduction Innovations in information and communication technology (ICT) have resulted in sophisticated information systems referred to as telematics systems to support freight transportation since the mid-80s [1,2]. Telematics systems have been adopted to improve tracking and monitoring the vehicles and freights [3]. These systems provide freight owners with valuable information regarding locations and conditions of both the vehicles and freights in a real-time manner [2]. Such information helps the owners to effectively handle daily operation of distribution centers, freight forwarding, long
Phuoc Vinh Tran is Associate Professor in Informatics, Vice Rector of the University as well as Dean of the Department of Information Science and Engineering at the University of Information Technology (UIT) in Vietnam. His interests include real-time spatial information system, multivariate data visualization, real-time geo-visualization, GIS for administration, access control in government GISystems, real-time GIS for disaster and climate change.
haul freight transport, loading and unloading planning, and route scheduling [2]. The benefit of telematics systems is, therefore, the avoidance of transportation risks including accident, theft and change in quality of goods that are of high value, perishable, time-dependent, or hazardous [4,5]. A telematics system often composes of a vehicle system and a communication system. Data about the vehicles and freights are transmitted from the vehicle systems over a telecommunication network (e.g. a cellular network) to the communication systems where the data are processed by a computational application (e.g. a geographic information system -- GIS) [6,3]. Thanks to its capability of spatially and temporally integrating, managing, and analyzing a large amount of data collected from the vehicle systems, GIS for transportation (GIS-T) has been adopted and implemented in the communication systems for a variety of transportation purposes including administration, planning, design, and operation at both public and private organizations since 1960s [7,8]. Traditionally, these GIS-T applications use computational analysis approach for data analysis [6]. However, this approach may be ineffective in cases that require human knowledge for pattern recognition, imagination, association, and analytical reasoning due to the multitude of spatial data [9]. To go over this limitation, the geovisualization approach has been suggested. This geovisualization approach provides an interactive and dynamic visual environment, in which humans (i.e. freight owners) and computers can work in synergy to analyze data about the vehicles and freights in a real-time manner. In this chapter, we proposed a visualization-based tracking system. Unlike conventional tracking systems, this proposed system used mobile devices (e.g. smartphones) for geovisualization applications. This system, therefore, not only respected knowledge of freight owners in exploring and analyzing vehicle and freight data but also helped them to keep track of their vehicle and freights ubiquitously in a real-time manner. The rest of the paper is organized as follows. The next section presents the overall system architecture. In the third section, we briefly discuss our experiences when testing the system. A broader discussion is presented in the fourth session. This paper is ended in the fifth section where we not only summarize our study but also propose our future expansion for this system.
2 System Architecture The overall architecture of the proposed visualization-based tracking system is presented in Fig. 1. Technically, the system was designed to have four components: a set of moving devices, a telecommunication network, a map service, and a set of mobile devices (Fig. 1). While the moving devices were implemented on vehicles, the mobile devices (e.g. smartphones) were used by freight owners. Data about the vehicle positions (i.e. latitude and longitude) and conditions (e.g. fuel and weight) generated by the moving devices were sent to the mobile devices through a telecommunication network (e.g. the General Packet Radio Service – GPRS – network). The position and condition data were collected by the GPS (Global Positioning System) receivers and sensors. The frequency of these collection
processes was determined by the timer. The map service provided a set of base maps (e.g. administrative boundaries and physiography) forming a spatio-temporal context for the geovisualization processes occurring at the mobile devices.
Mobile Device
Moving Device
SMS Receiver Telecommunication Network
GPS and sensors
Database SMS sender
information
Data Transceiver
Data Transceiver
Visualization Software
control
knowledge Viewing Comprehension
Timer
control
Map Service
SMS Receiver
SMS Sender
Timing
Fig 1. Overall architecture of the proposed visualization-based tracking system using mobile device
2.1 Database Table 1. Attribute table of the database
Field ID_Device Name_Device Time Longitude Latitude Fuel Weight
Data type Text Text Text Real Real Real Real
Description Device identification string Device name Time of observation (YYYY-MM-DD-hh-mm-ss) Longitude of a vehicle location Latitude of a vehicle location Percentage of vehicle fuel (0-100%) at a location Percentage of vehicle weight (0-100%) at a location
In this system, the relational database management system SQLite was used to manage the data. This most widely deployed SQL database engine supported the SQL-92 standard for query and also provided several libraries for Android development [10]. In this study, a table with seven fields was created as presented in
Table 1. Data in this system included the vehicle positions and conditions observed at various time points. It should be noted that at a specific time point, the vehicle position was unique. However, as the time goes on, the vehicle location might change as the vehicle moved. Additionally, as far as the vehicle became moving, its conditions might change as well due to internal (e.g. vehicle engine condition) or external (e.g. weather condition) factors. 2.2 Visualization software
2.2.1 Visualization frameworks The visualization software for the mobile devices in this study was developed to utilize three visualization frameworks: (1) the space-time cube [11], (2) the spacefeature cube [12], and the simplified-space-time-feature cube [12]. The space-time cube (Fig. 2a) represented one or multiple space-time paths connecting multiple space-time points representing positions of a vehicle at various time points [13]. The base of the cube was used to represent locations whereas its height represented the time. Therefore, the function of the space-time cube was to visualize vehicle positions by time and vice versa. However, the space-time cube did not support the visual exploration and analysis of vehicle conditions by time because the condition information was not presented in the cube. Thus, an alternative approach to the space-time cube could be to link the space-time cube with multiple documents (e.g. charts and/or tables) [13]. However, this approach was not selected for this proposed system because viewing multiple documents at the same time on a mobile device with small screen would be impossible. Rather, for the purpose of visualizing vehicle conditions, the spacefeature cube (Fig. 2b) was used. Similarly to the space-time cube, the base of the space-feature cube was used to represent locations. However, the height of the space-feature cube represented thematic attributes (e.g. vehicle weight) [12]. The issue with the space-feature cube was that it was not helpful to visualize durations of vehicle states (e.g. run or stop). For instance, according to Fig. 2b, the vehicle stopped at position P 1 and its weight decreased from Wa to Wb and then increased from Wb to Wc. Deciding whether this stop was a regular loading/unloading or an irregular stop due to a risk (e.g. accident or theft) would require information about the stop duration. To go over this issue, the simplified-space-time-feature cube was introduced. The simplified-space-time-feature cube (Fig. 2c) was similar to the space-feature cube in which its height represented a thematic attribute. However, the Y-axis of the simplified-space-time-feature cube represented the time. Vehicle positions were shown on the X-axis and were simplified as representative points whose coordinates were not real as they were in the space-time cube. For instance, point P 0 at the origin of the X-axis in Fig. 2c was the departing location. P 1 was determined based on its network distance from point P0. The simplified-space-time-feature cube helped to reveal the stopping time at P1 of the vehicle in the above example (Fig. 2c).
(a)
(b)
©
(c) Fig. 2. Visualization frameworks. (a) The space-time cube, (b) the space-feature cube, (c) the simplified-space-time-feature cube. Please see text for detailed discussion.
Tran and Nguyen [12] suggested that the Time axis should have only been visualized when the vehicle was in stop state. For instance, the Time axis in Fig. 2(c) was visualized at P1 because the vehicle stopped at location P 1 between time t1 and t3. This flexibility in visualizing the Time axis ensured that the simplified-space-timefeature cube provided a simple view for the freight owners to better track of their vehicle/goods positions but at the same time ensured that the owners were able to identify significant changes in their vehicle/goods conditions when the vehicles stopped. 2.2.2 Software development
The visualization software was developed on the Android platform using a variety of tools including Java Development Kit and Android Software Development Kit. Additionally, Google Maps Android API (Application Program Interface) and OpenGL API were also used to handle GIS data. In addition to the available functions of a mobile device such as zooming, moving, rotating, our software provided several filtering methods (Table 2). Table 2. Filtering methods provided by the visualization software
Filtering method Object
Study area
Current area Study time
Current time Attribute
View all
User activity When the user touches the function box Object on screen, a list of objects is shown. Then user may select one or some objects to display. Note that the screen of a mobile device may be crowded if too many objects are shown at the same time. After zooming the map to a convenient scale, the user may touch the function box Study Area on screen to draw a rectangle defining a study area within which the data will be shown. The user may touch the function box Current Area on screen to see the selected objects. After zooming the map to a convenient scale, the user may touch the function box of Study Time on screen and mark an interval on the time axis for which the data will be visualized on screen. The user may touch the function box Current Area on screen to see the selected objects at the current time. After selecting an object for tracking, the user may touch the function box Attribute on screen to open the list of attributes. Then, the user may select one or more attributes to be visualized on screen. The user may touch the function box View All on screen to visualize the attributes of all objects. Note that the screen of a mobile device may be crowded in this case due to too many objects.
3 System Implementation The proposed visualization-based tracking system described in the previous section was implemented for testing purpose. The goal of the test was to assess the performance of the system architecture as well as the visualization software running on popular smartphones. Two testing approaches were conducted. In the first testing approach, the system was installed on a truck running for a distance of about 300 km from Rạch Giá (Kiên Giang province, Vietnam) to Ho Chi Minh City (Vietnam). In this test, two smartphones (Acer E210 and HTC Desire HD) were used as moving
devices. With Wi-Fi and GPS embedded, these smartphones were able to record and send their positions to the mobile device, which was also a smartphone (Sony Xperia Acro S) through the SMS/GPRS network. Due to the impossibility of installing sensors on the testing truck, data about vehicle conditions (e.g. fuel and weight) were taken from a simulation (Table 3). Table 3. Data table of the testing trip Time (t)
Longitude (x)
Latitude (y)
Fuel (b)
15:30:26 15:32:56 15:34:27 15:47:57 16:05:27 16:45:56 16:47:32 16:49:02
106.68456 106.68349 106.68150 106.68150 106.68150 106.68150 106.67569 106.67483
10.75634 10.75594 10.75512 10.75512 10.75512 10.75512 10.75397 10.75396
16:51:35
106.67316
10.75346
16:53:18
106.67095
10.75353
100.00 99.85 99.71 99.71 99.71 99.26 99.11 98.95 98.80 98.60
Note
Weight (w) 100 100 100 70 85 100 100 100 100 100
Vehicle in running mode Vehicle in stopped mode Weight reduces Weight increases Vehicle in running mode again
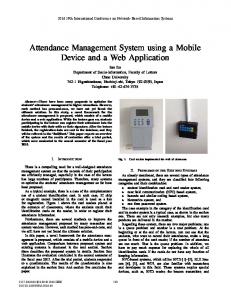
Legend: Time(T),Weight(W),Fuel(F),Speed(S),Position(P)
S5 F5
S0 F0
S1
S2
F1 F2
S4
T2 T1
T5
F3
T4
T3
W1 W0
S3
W2
W5
W3 F4 W4 P5
T0 P3 P0
P1 P2
P4
Space
Fig.3. The simplified-space-time-feature cube demonstrating the variations in positions and conditions of the testing vehicle
Data in Table 3 were saved in the SQLite database and were visualized by the Visualization software (Fig. 3 and 4). Unlike the first testing approach conducted for one vehicle, in the second testing approach, simulated data of more than ten vehicles were sent from the moving devices (i.e. Acer E210 and HTC Desire HD smartphones) to the mobile device (i.e. Sony Xperia Acro S smartphone) for processing. The tests demonstrated that all moving devices were working properly whereas the mobile device became overloaded when processing data from more than ten vehicles,
especially when the number of data records for each vehicle was large (i.e. more than a hundred).
Fig. 4. The simplified-space-time-feature cube demonstrating the variations in positions and conditions of the testing vehicle on a smart phone.
4 Discussions The proposed visualization-based tracking system is an easy-to-use and effective tool for the freight owners to keep track of their vehicles and freights. The strength of the system relies on (1) the use of the geovisualization approach to explore and analyze vehicle data and (2) the use of mobile devices (e.g. smartphones) to run the visualization software. The visualization approach provides a visual, dynamic, and interactive environment for the freight owners to analyze vehicle data. This is especially important for owners (e.g. agrifood owners) who do not have enough time and knowledge to understand, input, and run computational analysis tools. In addition, these owners often do not have fixed office but rather work closely with farmers at their farms. Thus, the owners need mobile devices (rather than desktop computers) to perform such activities as managing goods loading/unloading or scheduling routes. The drawback of using mobile devices for visualization software is its capability of processing and visualizing massive data set. However, the owners (e.g. agrifood
owners) at whom this system targets often do not need to track more than ten vehicles at the same time. In this system, Google Maps is used as a map service to provide base maps for the tracking. The benefit of using Google Maps along with open-source libraries (e.g. Java Development Kit and Android Software Development Kit) is low-cost implementation. However, the use of Google Maps may result in static and low quantity as well as quality of the base maps. For instance, at the time of writing this paper (January 2014) the newest aerial photo of Rach Gia (Kien Giang province, Vietnam) is in 2007 whereas the photo of Ho Chi Minh City is in 2013. This temporal mismatch of the base data may affect the identification as well as the understanding of land cover/use impacts on the transportation risks (e.g. accident) perhaps arising during the transportation periods [14].
5 Conclusion In this study, we proposed a visualization-based tracking system using mobile devices to help freight owners effectively keep track of their vehicles and freights as well as identify potential risks perhaps arising during transportations ubiquitously in a realtime manner. The system composed of a set of moving devices setting on the vehicles/freights, a telecommunication network, a map service, and a set of mobile devices used by freight owners. Vehicle data including positions and conditions were recorded at the moving devices and transmitted to the mobile devices through the telecommunication network. A visualization software was developed for the mobile device to visually track vehicles/freights. We introduced the use of a combination of three different visualization approaches (space-time cube, space-feature cube, and simplified-space-feature cube) to improve the system capability of visual exploration and analyses of the vehicle positions and conditions by time. One of our next steps is to upgrade the visualization software to include visual analytics. In fact, it has been recommended that computational analysis methods (e.g. generalization) need to be used in combination with visualization when massive data sets need to be explored and analyzed [9,15,16]. In addition, we also want to expand the map service to use not only Google Maps but also other local services so that the base data are more recent and detailed.
References 1. Giannopoulos, G.A.: The application of information and communication technologies in transport. European Journal of Operational Research 152:302-320 (2004) 2. Marentakis, C.A.: Telematics for Efficient Transportation and Distribution of Agrifood Products. In: Bourlakis M, Vlachos I, Zeimpekis V (eds) Intelligent Agrifood Chains and Networks. Wiley-Blackwell, pp 87-108 (2011) 3. Santa, J., Zamora-Izquierdo, M.A., Jara, A.J., Gómez-Skarmeta, A.F.: Telematic platform for integral management of agricultural/perishable goods in terrestrial logistics. Computers and Electronics in Agriculture 80 (0):31-40. (2012). doi:http://dx.doi.org/10.1016/j.compag.2011.10.010
4. Siror, J.K., Sheng, H., Dong, W., Wu, J.: Application of RFID Technology to Curb Diversion of Transit Goods in Kenya. In: INC, IMS and IDC, NCM '09. Fifth International Joint Conference on, 25-27 Aug. 2009. pp 1532-1539. (2009). doi:10.1109/ncm.2009.84 5. Ruiz-Garcia, L., Barreiro, P., Rodríguez-Bermejo, J., Robla, J.I.: Review. Monitoring the intermodal, refrigerated transport of fruit using sensor networks. Spanish Journal of Agricultural Research 5 (2):142-156 (2007) 6. Goel, A.: Fleet Telematics: Real-time management and planning of commercial vehicle operations, vol 40. Operations Research/Computer Science Interfaces. Springer US (2008) 7. Kim, T., Choi, K.: GIS for Transportation. In: Kresse W, Danko DM (eds) Springer Handbook of Geographic Information. Springer Berlin Heidelberg, pp 503-521. (2012) doi:10.1007/978-3-540-72680-7_26 8. Goodchild, M.: GIS and transportation: Status and challenges. GeoInformatica 4 (2):127139. (2000). doi:10.1023/a:1009867905167 9. Andrienko, N., Andrienko, G.: Designing visual analytics methods for massive collections of movement data. Cartographica: The International Journal for Geographic Information and Geovisualization 42 (2):117-138. (2007) doi:10.3138/carto.42.2.117 10. SQLite (2013) About SQLite. http://www.sqlite.org/about.html. Accessed 1/3/2013 11. Hägerstraand, T.: What about people in regional science? Papers in regional science 24 (1):7-24. (1970) doi:10.1111/j.1435-5597.1970.tb01464.x 12. Tran, P.V., Nguyen, H.T.: Visualization cube for tracking moving object. Paper presented at the Computer Science and Information Technology, Information and Electronics Engineering, Bangkok, Thailand (2011) 13. Kraak, M.J.: The space-time cube revisited from a geovisualization perspective. Paper presented at the 21st International Cartographic Conference (ICC), Durban, South Africa, 10 - 16 August. (2003) 14. Kim, K., Brunner, I.M., Yamashita, E.Y.: Influence of land use, population, employment, and economic activity on accidents. Transportation Research Record: Journal of the Transportation Research Board 1953:56-64 (2006) 15. Kraak, M.J.: Geovisualization and Visual Analytics. Cartographica: The International Journal for Geographic Information and Geovisualization 42 (2):115-116. doi:10.3138/carto.42.2.115 (2007) 16. Andrienko, N., Andrienko, G.: Spatial generalization and aggregation of massive movement data. IEEE Transactions on Visualization and Computer Graphics 17 (2):205219 (2011)