(2010) link visual analytics with SOMs for different spatio-temporal data representations from multiple perspectives. An alternative approach for visualizing ...
Visualization of Crime Trajectories with Self-Organizing Maps: A Case Study on Evaluating the Impact of Hurricanes on SpatioTemporal Crime Hotspots Julian Hagenauer1, Marco Helbich1, Michael Leitner2 1
2
GIScience, Department of Geography, Heidelberg University, Germany
Department of Geography and Anthropology Louisiana State University, USA
Keywords: Data exploration, Geovisualization, Spatio-temporal modeling Abstract The exploration of the spatial relationships between crime incidents, the socioeconomic characteristics of neighborhoods, as well as physical and structural compositions of the urban landscape is an ongoing research issue in Geographic Information (GI) Science. Spatial data mining tools improve the ability to gain knowledge from geographic data and help to understand spatio-temporal processes that contribute to the presence or absence of criminal offenses. However, most of the currently available tools focus either on the spatial, the temporal, or a combination of both aspects. But crime has a spatial and temporal component in a multidimensional attribute space. Therefore, it is reasonable to combine all these aspects within one analytical framework. This paper presents such a methodology to explore crime patterns and their spatial and temporal behavior within their socio-economic and environmental neighborhoods. The framework consists of three complementary techniques: A spatio-temporal scan statistic to detect crime hotspots, a growing selforganizing map (SOM) to analyze attribute properties of the neighborhoods, and a mapping of crime hotspot trajectories onto different SOM visualizations. The case study uses burglary locations from Houston, Texas, from August to October 2005. 1 Background Today's information era requires efficient computational algorithms and visual analytical approaches to analyze huge amounts of digital data in an appropriate manner (Keim et al. 2008, Miller and Han 2009, Andrienko et al. 2010). This is also true for criminological analysis. Today, classical mapping approaches, as for example, discussed in Chainey and Ratcliffe (2005), are only partially applicable. The multidimensionality of current datasets needs more sophisticated methods to cope with space, time, and its related attribute information. For instance, kernel density estimation, a popular interpolation and hotspot technique, deals only with the spatial context of crime locations, while temporal and attribute dimensions are not considered. Thus, it is necessary to develop new toolboxes or incorporate methods from other disciplines into criminological analysis. Spatial data mining tools can be used to improve the ability to gain knowledge from geographic data and to understand the underlying spatio-temporal processes that contribute to the presence or absence of criminal offenses. Only a limited number of studies have so far dealt with these issues. Recent examples include the use of geovisualization approaches (e.g., isosurfaces) to explore space-time crime patterns (Brunsdon et al. 2006). However, the suitability to crime analysis remains unclear. Another example to visually analyze spatio-temporal crime patterns is a web-based geovisualization tool referred to as GeoVISTA CrimeViz (Roth et al. 2010). Additionally, Nakaya and Yano (2010) present a three-dimensional mapping approach within a space-time cube. The authors combine space-time variants of kernel density estimations and scan statistics, which allows a simultaneous mapping of the geographical extent and the duration of crime hotspots. All above studies have in common that they focus either on the spatial, the temporal, or a
combination of both aspects. Nevertheless, crime is subject to spatial as well as temporal changes and is affected by its environment. It is reasonable to combine all aspects of crime within one methodological framework. Among the few studies, Andrienko et al. (2010) employ an integrative approach, combining SOMs with a set of interactive visualization tools. The usefulness and discovery power is demonstrated by a time series of different crime attributes for US states. The purpose of this paper is a presentation of a methodological framework to explore crime patterns and their spatial and temporal behavior within its socio-economic and environmental context. The framework comprises of the following complementary techniques, including the spatio-temporal scan statistic to detect crime hotspots as well as a growing SOM to analyze attribute properties of the neighborhoods. Trajectories hotspot mapping onto the SOM relates both techniques. In this study, burglary locations from Houston during the height of the 2005 Hurricane season (August to October 2005), are applied to these techniques. Recent research has shown that natural disasters, like hurricanes, have a substantial impact on crime and its spatial distribution (e.g., Leitner and Helbich 2011, Leitner et al. 2011). Thus, academics seek to explore the spatial relationships between crime incidents, the socioeconomic characteristics of neighborhoods, as well as physical and structural compositions of the urban landscape. Previous analysis has shown that the landfall of Hurricane Rita (September 2005), in contrast to Hurricane Katrina (August 2005), resulted in a dramatic short-time increase in burglaries and small decrease in other crime types (Leitner and Helbich 2009). The authors attribute this stark increase to the mandatory evacuation order that was issued before the landfall of Hurricane Rita (a mandatory evacuation order was not issued before Hurricane Katrina) and to a different spatio-temporal response of different crime types to hurricanes. From a spatial point of view, crime increases occurred primarily in neighborhoods with high percentages of African Americans and Hispanics, foremost located in the eastern parts of the Houston metropolis. Leitner and Helbich (2009) put forth explanations that individuals, who did not follow the evacuation order, may have committed those excess burglaries. Clearly, Leitner and Helbich's (2009) study is limited insofar as multivariate demographic and socio-economic classifications of the neighborhoods are not taken into account to explain spatio-temporal changes in crime patterns. Therefore, the following research objectives will be addressed in this paper: Is the proposed methodological framework appropriate for crime analysis and mapping? What are similarities and differences among burglary hotspots when comparing Hurricanes Katrina and Rita? Do differently characterized neighborhoods affect crime hotspots over time differently? Do trajectories exhibit a cyclical pattern or sudden changes in its movements? Do both hurricanes show a (dis)similar spatio-temporal pattern of hotspot movements? 2 Study Site and Data The focus of this research is on the US metropolitan area of Houston, TX. Houston has been hit by many hurricanes in the past, such as Hurricanes Katrina and Rita in 2005. To analyze their impact on crime, crime data were obtained from the Houston Police Department for the months of August, September, and October 2005. The data set covered several weeks before, during, and after the landfall of both Hurricane Katrina (August 29th) and Hurricane Rita (September 24th). After geo-coding crime locations using the TIGER (Topologically Integrated Geographic Encoding and Referencing system) street network, more than 25,000 offenses that occurred during the three-months time period were available for further analysis. These crime locations can be subdivided into several offense types, like burglaries, auto theft, and aggravated assault. A temporal analysis of the total number of different offense types (Leitner and Helbich 2009) indicates that most of them remain relatively stable throughout the study period. Burglaries are an interesting exception, showing a significant increase in total numbers during Hurricane Rita. Therefore, this study focuses on the spatio-temporal distribution of these 6,730 burglary locations. In addition, this study applies several socio-economic and environmental variables to characterize different neighborhood types within Houston. It is well-known that US-cities are often affected by, for instance, economic or ethnical segregation processes. Preliminary studies based on regression analysis (Leitner and Helbich 2011) have already shown that the variables depicted in Table 1 are essential and significant driving forces for these economic and ethnical segregation processes. This paper thus focuses on these four variables (Table 1) to characterize neighborhoods based on census tract levels. Overall, the
study site consists of 408 census tracts. Table 1: Socio-economic and environmental variables for neighborhood characterization (Source: US Census) Description % of African Americans (2000) % of Hispanics (2000) % persons below the poverty level (1999) Euclidean distance to the nearest police (sub)station (in meters)
Min. 1st Quantile 0.00 2.83 0.00 10.89 0.00 8.15 99
1,563
Median 10.57 27.91 18.30 2,343
Mean 3st Quantile 25.56 38.72 35.05 54.16 18.84 26.55
Max. 98.26 97.16 70.40
2,739
9,822
3,564
3 Methods 3.1 Spatio-temporal Scan Statistic The scan statistic (Kulldorff 1997; Kulldorff et al. 1998) is a fairly new method for the detection and evaluation of spatio-temporal hotspots. Nevertheless, it is rarely used in crime analysis (e.g., Leitner and Helbich 2011). In this research a spatio-temporal hotspot is regarded as a spatial and temporal bounded group of cases of sufficient size and concentration to be unlikely to have happened by chance alone. This is crucial because in this research no information was available about the percentages of residents that did not evacuate despite the mandatory evacuation order issued ahead of Hurricane Rita for the different neighborhoods in Houston. This study thus uses burglary counts instead of burglary rates, since no information about the at-risk population (residents that did not evacuate) was available. The spatio-temporal scan statistic uses the crime locations and their time stamps as input data. The scan window is a cylinder with the base area representing the spatial dimension and the height the temporal dimension. During the analysis, the cylinder moves from one crime location to the next and continuously changes the radius of the base area and its height. This results in a large number of differently-sized overlapping cylinders, for which the observed number of crimes is compared with the expected number of crimes using a spatio-temporal permutation model. The number of expected crime locations is estimated with a Poisson distribution. A spatio-temporal hotspot is identified by a cylinder that includes a significantly larger number of observed crime locations than would be expected by chance for a certain time period, alone. Monte Carlo simulation determines the statistical significance of each hotspot. An advantage of this method is that results can be mapped and that hotspots can be located onto the SOM, which is briefly discussed below. 3.2 Self-Organizing Maps 3.2.1 Standard Algorithm and the Growing Grid Extension The SOM, proposed by Kohonen (2001), is an unsupervised learning neural network. It provides a nonlinear mapping from a high-dimensional input space to a lower-dimensional, often two-dimensional, output space. In the process of mapping, the topology of the input space is mostly preserved. Input vectors that are close to each other in the input space are mapped to units that are close to each other in the output space. SOMs can be used for analysis and visualization (Vesanto, 1999), vector quantization, and clustering (Vesanto, 2000). In the context of GIScience, SOMs are primarily employed for spatial pattern analysis (e.g., Agarwal and Skupin 2008). The SOM consists of an arbitrary number of units, which are connected to adjacent units by a neighborhood relation. These relations define the topology of the map, usually in GIS applications a twodimensional grid. Each unit is represented by a prototype vector of the same dimension as the input space. During each learning step, an input pattern is selected randomly from the set of input vectors and the unit with the smallest Euclidean distance to the input vector on the map, also called the best matching unit (BMU), is found. The BMU and the units within a certain surrounding neighborhood on the map are moved towards the presented input vector. The magnitude of movement depends on their distance to the BMU on the map. The neighborhood size and the adaption strength decrease monotonically during the
training phase. Thus, the learning process is gradually shifting from an initial rough phase, where the units on the map are coarsely arranged, to a fine-tuning phase, where only small changes to the map are permitted. A drawback of the standard SOM algorithm, which is mostly used in a GIS context (e.g., Skupin and Hagelman 2005), is the subjective choice of appropriate model parameters in advance and the a-priori specification of the map dimension. Therefore, Fritzke (1995) proposed the growing grid (GG) model, which is applied in this research. It extends the SOM by introducing a dynamic map structure. Usually the GG training starts with a very small two-dimensional map. During the training process the unit that represents most of the input data is chosen and a row or column is inserted between this unit and its most distant neighbor. The prototype vectors of the new units are interpolated from their neighbors which increases the density of prototype vectors in this area of the map. Consequently, input data will be distributed more equally in that area. The growth of the map is repeated until a stopping criterion is reached, e.g. the map has grown to a predefined maximum size. 3.2.2 Visualizing Temporal Changes with Self-Organizing Maps A SOM provides a static mapping of an input space onto a grid that can be easily visualized to gain information about the input data (Vesanto, 2000). In the geographic domain, most data have a spatial as well as temporal component. Especially the temporal context is often neglected in visualization. A pragmatic solution is to create a separate SOM-visualization for each time stamp. For instance, Andrienko et al. (2010) link visual analytics with SOMs for different spatio-temporal data representations from multiple perspectives. An alternative approach for visualizing temporal patterns is the use of trajectories in combination with SOMs (Skupin and Hagelman 2005). A trajectory is a path in the SOM, representing different states of an object and its temporal development.
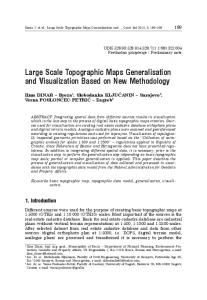
4 Results 4.1 Spatial Scan Statistics In this research the time period from August until October 2005 was studied. The number of burglaries per week (approximately 450) shows little fluctuation across the three months time period. One notable exception is the week between September 18 and 24, when the number of burglaries increased almost three-fold (1185 cases) compared to the normal weekly average. The scan statistic was used to identify spatio-temporal burglary hotspots. For the entire time period the scan statistic found several spatio-temporal hotspots. Four of these hotspots (Table 2) showed a significance level of p < 0.05. All levels of significance are based on 999 Monte Carlo simulations. Most of the hotspots lasted just one day. Hurricane Katrina which hit Houston on August 29 2005 did not have any impact on hotspot creation. None of the identified hotspot corresponds to the landfall of Hurricane Katrina. In contrast, one highly significant hotspot (p < 0.001) is detected during September 21 until 27, which corresponds to the landfall of Hurricane Rita. In other words, Hurricane Rita and its associated mandatory evacuation led to a significant increase in burglaries. When compared to all other hotspots, the hotspot associated with Hurricane Rita also has a large spatial extent and includes a total of 357 burglaries cases. A detailed summary of the four hotspots with p < 0.05 is given in Table 2. For the subsequent analysis only these four significant hotspots are further investigated. The hotspot sizes vary between 4 and 357 burglary locations (Table 2). In a first step, the mean center (average of all x- and y-coordinates) of all burglary locations for each hotspot is calculated. Subsequently, the census tracts that include a mean center are mapped as a trajectory onto the SOM. Figure 1 visualizes the mean centers of each of the four hotspots. It is noteworthy, that the calculated hotspots represent discrete phenomena in time. Thus, the trajectory does not imply a continuous movement of a hotspot, but instead it maps the sequential emergence of underlying phenomena. Therefore, the concept of a trajectory is adapted and the arcs are not drawn. The first hotspot appears in the west of the metropolitan area and the following two hotspots occur eastward. The fourth hotspot is located adjacent to the second one in the center of the city.
Table 2: Results from spatio-temporal scan statistic Number of hotspot 1 2 3 4
Hotspot begin 25.08.2005 09.09.2005 21.09.2005 10.10.2005
Hotspot end 25.08.2005 09.09.2005 27.09.2005 10.10.2005
Hotspot center x 1430080 1441487 1453910 1441430
Hotspot Number pcenter y of cases value 848937 4 0.048 850182 6 0.019 855455 357 0.001 850310 5 0.008
Figure 1: Mean centers of burglary hotspots ordered temporarily. 4.2 Growing SOM and Trajectory mapping To analyze the emergence of crime hotspots in attribute space and to get deeper insights into the demographic and socio-economic conditions characterizing the study area, a GG was trained. As stated in Section 2, a pre-selection of attributes was conducted (see Table 1). The GG was allowed to grow, until it exceeded 500 neurons. The resulting map consists of a grid with 25 columns and 21 rows. Because a trained GG is identical to a standard SOM, we will not further distinguish between the two. For analysis it is convenient to visualize the SOM (Versanto, 1999). In this study two visualization methods are considered, including the unified distance matrix (U-matrix; Ultsch, 1993) and Component Planes (CP). The U-matrix visualizes the difference of neighboring units within the map. Clusters become visible by distinct outlines of their cluster boundaries. Thus, the U-matrix shows both the present cluster structure and the quality of the clustering. Figure 2 presents the U-matrix of the trained SOM. Clearly, the SOM failed to outline distinct clusters. Nevertheless, a certain level of homogeneity can be observed at the right boundary of the U-matrix. Detailed inspection of these units shows that these dark blue cells are characterized by low percentages of African Americans as well as Hispanic populations and a small percentage of people living below the poverty level.
Figure 2: U-matrix of the neighborhood characteristics and the mapped crime hotspot trajectory. Red colors correspond to large distances between neighborhood characteristics, blue to short distances. A CP is a projection of a single component (i.e., neighborhood characteristic) on the map. If all component planes are drawn, the whole information about the map is revealed. By inspecting a CP and relating it to other CPs of the SOM, information about the SOM structure can be gained. In this research four CPs, one for each input dimension, are used (Figure 3). A comparison between the CPs shows that poverty primarily correlates with the percentage of African Americans and Hispanics. However, the most impoverished neighborhoods are mostly occupied by African Americans. The CP representing the distance to the next police (sub) station seems to be uncorrelated to the other three CPs.
Figure 3: Component planes characterizing Houston’s neighborhoods with hotspot Trajectory. % African Americans (top left); % Hispanics (top right); % population below poverty level (bottom left); and distance to the nearest police (sub) station (bottom right). Red color corresponds to high values, blue color to low values. Based on the results of the scan statistic and the SOM, a trajectory can be projected onto the SOM. Thus, the trajectory represents the sequential emergence of crime hotspots in respect to the attributive change of Houston’s neighborhoods. The trajectory starts at August 25, four days before Hurricane Katrina (August 29h) made landfall and ends at October 10, several weeks after Hurricane Rita (September 24th) made landfall. The time periods and locations of the trajectory are presented in Table 2 above. Hurricane Rita happened in the period of hotspot 3, while the time of the landfall of Hurricane Katrina is not directly reflected by any hotspot. The trajectory clearly depicts a notable pattern. First, it is noticeable that the trajectory depicts a close repetition of characteristics at the second and fourth hotspot. These two hotspots are also geographically adjacent. Secondly, the first and last hotspots are very distinct, hence these two hotspots have emerged in substantially different attribute spaces. The trajectory combined with the U-Matrix (Figure 2) reveals, that the hotspots 2 and 4 are located in areas that are characterized by a low poverty rate and low percentages of African American as well as Hispanic populations. The hotspots 1 and 3 are located in regions that are heterogeneous in terms of neighborhood characteristics, thus a clear trend is difficult to be gained from this representation. The crime hotspot trajectory drawn on the CP (Figure 3) for the percentage of African Americans provides no evidence for a significant pattern. During the time periods two, three, and four the hotspots are located in neighborhoods with a low percentage of African American population. Only the first hotspot resides within a neighborhood with a somewhat larger African Americans percentage. A significant pattern is notable for the trajectory projected onto the CP for the percentage of Hispanics. While the second and fourth crime hotspots are located in regions with a low percentage of Hispanic population, the third hotspot is located in a neighborhood that shows a rather high percentage of Hispanic population. Because at time period of hotspot 3 Hurricane Rita made its landfall, it can be assumed that the hurricane and the mandatory evacuation of Houston’s population are important causes for the creation of this distinct hotspot location. This observation supports the results of Leitner and Helbich (2011), who discovered a significant burglary increase in neighborhoods with high percentages of African Americans and Hispanics during Rita’s landfall. The percentage of people living below the poverty level is high in neighborhoods with high percentages of African Americans or Hispanics. Thus, it is not surprising that the hotspot created during Hurricane Rita is located in a region with a high percentage of people living below the poverty level. In contrast, the other three hotspots are located in areas with a lower percentage of people living below the poverty level. Finally, distance to the nearest police station has no affect, whatsoever on hotspot locations and hence the trajectory.
5 Conclusions and Future Work This research proposed a methodological and analytical framework that included the scan statistic, SOMs, and attribute-time paths (trajectories) to explore crime patterns. This research accounts for the crime patterns’ temporal and spatial dimensions in addition to their multivariate socio-economic and demographic classifications of their neighborhoods. Each of this framework’s components provides distinct capabilities for the analysis of different aspects of burglary locations and the factors responsible for those locations. The scan statistic enables the user to detect spatio-temporal hotspots, while SOMs and trajectories are useful for analyzing multivariate patterns. The combination of these techniques into a single framework enables synergistic effects, permitting even more powerful analysis by simultaneously exploring space, time, and the corresponding attribute space, thus gain a better understanding of spatial and temporal processes. The usefulness of the presented framework was demonstrated by applying it to the analysis of burglaries in Houston before, during, and after the landfall of Hurricanes Katrina and Rita in 2005. It was shown that the hotspot found during the landfall of Hurricane Rita significantly differed from hotspots from previous and later periods. In contrast to Hurricane Rita, no hotspot of burglaries was detected during the landfall of Katrina. The fact that no mandatory evacuation was issued prior to the landfall of Hurricane Katrina (in contrast to Hurricane Rita, when such an evacuation was ordered) may have affected the number and distribution of burglaries. The analysis of the SOM and the hotspot trajectory further revealed that the hotspot during Hurricane Rita emerged in neighborhoods that are considerably different from the others in terms of the ethnic composition and the percentage of population living below the poverty level. Future work must address issues related to the method and to the amount of data being used in this study. First, a model comparison between the GG algorithm and the standard SOM algorithm is needed in order to evaluate, which of the two algorithms is more accurate. However, the incorporation of other SOM variants can help to make the framework more robust to parameterization or to improve the understanding of the processes by taking special aspects of the input data, e.g. hierarchical or spatial relationships, into account. Second, future work needs to include other criminal offense types and additional socio-economic as well as demographic variables to improve the understanding of the interrelationships between hurricanes and crime. It seems promising to visualize hotspots from other crime types as trajectories and analyzing their sequential emergence in relationships to each other. Acknowledgement We would like to thank André Skupin for his constructive comments and his valuable feedback. References Agarwal, P. and Skupin, A., 2008. Self-Organising Maps: Applications in Geographic Information Science: Applications in GIScience. Wiley, West Sussex. Andrienko, G., Andrienko, N., Bremm, S., Schreck, T., von Landesberger, T., Keim, D. A. and Bak, P., 2010. Space-in-Time and Time-in-Space Self-Organizing Maps for Exploring Spatiotemporal Patterns. EuroVis 2010. pp. 913-922. Brunsdon, C., Corcoran, J. and Higgs, G., 2007. Visualising space and time in crime patterns: A comparison of methods. Computers, Environment and Urban Systems, 31(1), pp. 52–75. Chainey, S. and Ratcliffe, J. H., 2005. GIS and Crime Mapping. Wiley, Chichester. Keim, D. A., Mansmann, F., Schneidewind, J., Ziegler, H. and Thomas, J., 2008. Visual Analytics: Scope and Challenges, Visual Data Mining: Theory, Techniques and Tools for Visual Analytics. Springer, Lecture Notes In Computer Science. Fritzke, B., 1995. Growing grid - A self-organizing network with constant neighborhood range and
adaptation strength. Neural Processing Letters, 2(5), pp. 9 - 13. Kohonen, T., 2001. Self-Organizing Maps, 3. Springer, New York. Kulldorf, M., 1997. A spatial Scan Statistic. Communications in Statistics: Theory and Methods, 26, pp. 1481-1496. Kulldorff, M., Athas, W., Feuer, E., Miller, B. and Key, C., 1998. Evaluating cluster alarms: A space-time scan statistic and brain cancer in Los Alamos. American Journal of Public Health, 88, pp. 1377-1380. Leitner, M. and Helbich, M., 2009. Analyzing, modeling, and mapping the impact of Hurricanes Katrina and Rita on the spatial and temporal distribution of crime in Houston, TX. In Car, A., Griesebner, G. and Strobl, J.: Geospatial Crossroads @ GI_Forum '09. Proceedings of the Geoinformatics Forum Salzburg. Salzburg, pp. 110-119. Leitner, M., Barnett, M., Kent, J., and T. Barnett, 2011. The impact of Hurricane Katrina on reported crimes in Louisiana – A spatial and temporal analysis. In LeBeau, J. L., and Leitner M.: Spatial Methodologies for Studying Crime. Special Issue of The Professional Geographer (forthcoming May 2011). Leitner, M. and Helbich, M., 2011. The Impact of Hurricanes on Crime: A Spatio-Temporal Analysis in the City of Houston, TX. Cartography and Geographic Information Society (forthcoming April 2011). Miller, H. and Han J., 2009. Geographical Data Mining and Knowledge Discovery. Taylor & Francis, Boca Raton. Nakaya, T. and Yano, K., 2010. Visualising Crime Clusters in a Space-time Cube: An Exploratory Dataanalysis Approach Using Space-time Kernel Density Estimation and Scan Statistics. Transactions in GIS, 14(3), pp. 223-239 Roth, R. E., Ross, K. S., Finch, B. G., Luo, W. and MacEachren, A. M., 2010. A user-centered approach for designing and developing spatiotemporal crime analysis tools. In: Proceedings of GIScience 2010. Zurich, Switzerland. Skupin, A. and Hagelman, R., 2005. Visualizing Demographic Trajectories with Self-Organizing Maps. GeoInformatica, 9, pp. 159-179. Ultsch, A., 1993. Self-organizing neural networks for visualization and classification. In: Opitz, O., Lausen, B. and Klar, R. (Eds.), Information and Classification. Springer, Berlin, pp. 307-313.