1 To whom correspondence should be addressed (e-mail g.milligan!bio.gla.ac.uk). ment of TRHR-1âGFP away from the plasma membrane to low-.
529
Biochem. J. (1999) 340, 529–538 (Printed in Great Britain)
Visualization of distinct patterns of subcellular redistribution of the thyrotropin-releasing hormone receptor-1 and Gqα /G11α induced by agonist stimulation Tomas DRMOTA*, Jiri NOVOTNY*†, Gwyn W. GOULD*, Petr SVOBODA*† and Graeme MILLIGAN*1 *Molecular Pharmacology Group, Division of Biochemistry and Molecular Biology, Institute of Biomedical and Life Sciences, University of Glasgow, Glasgow G12 8QQ, Scotland, U.K., and †Institute of Physiology, Czech Academy of Sciences, Videnska 1083, Prague, Czech Republic
The rat thyrotropin-releasing hormone receptor-1 (TRHR-1) was modified by the addition of green fluorescent protein (GFP) and expressed stably in HEK293 cells. Extensive overlap of plasma membrane distribution of autofluorescent TRHR-1–GFP with that of the phosphoinositidase C-linked G-proteins Gqα\ G α, identified by indirect immunofluorescence, was monitored "" concurrently. Addition of thyrotropin-releasing hormone resulted in rapid separation of TRHR-1–GFP and Gqα\G α "" signals as the receptor was internalized. This situation persisted for more than an hour. At longer time periods a fraction of the cellular Gqα\G α was also internalized, although much of "" the Gqα\G α immunoreactivity remained associated with the "" plasma membrane. Parallel experiments, in which the cellular distribution of TRHR-1–GFP and Gqα\G α immunoreactivity "" were monitored in sucrose-gradient fractions following cell disruption, also demonstrated a rapid, agonist-induced move-
ment of TRHR-1–GFP away from the plasma membrane to lowdensity vesicular fractions. At later time points, a fraction of the cellular Gqα\G α immunoreactivity was also redistributed to "" overlapping, but non-identical, low-density-vesicle-containing fractions. Pretreatment of the cells with cytochalasin D or nocodazole prevented agonist-induced redistribution of G-protein but not TRHR-1–GFP, further indicating resolution of the mechanics of these two processes. The combination of a GFPmodified receptor and immunostaining of the G-proteins activated by that receptor allows, for the first time, concurrent analysis of the varying dynamics and bases of internalization and redistribution of two elements of the same signal-transduction cascade.
INTRODUCTION
GPCRs [18–20] which, by selectively interacting with Gq and\or G , cause activation of the phosphoinositidase, phospholipase "" Cβ1, and the hydrolysis of PtdIns(4,5)P [21–23]. # In the present work, for the first time, concurrent analysis of the dynamics and kinetics of agonist-induced cellular internalization and redistribution of both a phosphoinositidaseC-linked GPCR and the α subunit of the G-protein(s) activated by that receptor is provided. To do so, a combination of stable expression of a GFP-tagged variant of the long isoform of the rat TRH receptor-1 (TRHR-1) [18] and indirect immunofluorescence of endogenously expressed Gqα\G α using an antiserum directed "" against a C-terminal epitope, which is entirely conserved between these two G-proteins, was used [24]. In parallel, and as an alternative biochemical correlate of the visualization of cellular redistribution of these proteins, we have used an anti-G-protein antiserum and an anti-GFP antibody to probe agonist-induced alterations in the location of Gqα\G α and TRHR-1–GFP in "" membrane fractions generated by density-gradient centrifugation. As a clear temporal variation in agonist-induced internalization of the GPCR and G-proteins were observed, inhibitor strategies to resolve these processes were employed.
The cellular localization of G-protein-coupled receptors (GPCRs) and their redistribution in response to agonist treatment has been studied for a number of years [1–5]. Either antisera generated against specific peptide sequences of the proteins or the addition of an epitope tag to a GPCR cDNA, so that, after expression of the modified protein, it can be visualized by antibodies which specifically identify the tag, generally have been used in these studies. These approaches have provided a great deal of information about the dynamic nature of the cellular trafficking of GPCRs. Attachment of modified forms of the green fluorescent protein (GFP) derived from Aequorea ictoria have become widely used to examine cellular targeting and regulation of a number of intracellular proteins [6–8]. Very recently, the generation of chimeric cDNA sequences, in which the open reading frame of GFP was attached to GPCR cDNAs, has provided a novel means to examine these proteins in intact cells [9–12]. Although most emphasis has been placed on analysis of the internalization and redistribution of GPCRs, we and others have noted that sustained treatment of cells with agonists can result in alterations in both the cellular distribution and levels of expression of the G-protein(s) activated by the relevant GPCR [13–16]. Thyrotropin-releasing hormone (TRH) is a hypothalamic tripeptide intimately involved in controlling the production of thyrotropin and prolactin from the anterior pituitary [17]. TRH functions by binding to a small group of molecularly-defined
Key words : agonists, G-proteins, G-protein internalization, green fluorescent protein.
MATERIALS AND METHODS Materials All materials for tissue culture were supplied by Life Technologies Inc. (Paisley, Scotland, U.K.) or Sigma. [$H]TRH was purchased from NEN–Life Science Products. Cytochalasin D and
Abbreviations : GPCR, G-protein-coupled receptor ; GFP, green fluorescent protein ; TRH, thyrotropin-releasing hormone ; THRH-1, TRH receptor-1 ; VSV, vesicular-stomatitis virus ; VSV-TRHR-1–GFP : N-terminally VSV-tagged form of the TRHR-1–GFP fusion construct. 1 To whom correspondence should be addressed (e-mail g.milligan!bio.gla.ac.uk). # 1999 Biochemical Society
530
T. Drmota and others
nocodazole were from Sigma. Oligonucleotides were purchased from Oswel (Southampton, U.K.). Alexa4 594 goat anti-rabbit IgG was from Molecular Probes (Eugene, OR, U.S.A.). The anti-GFP antibody was from Clontech.
Expression vectors Vesicular-stomatitis virus (VSV)-TRHR-1–GFP fusion expression construct Production and subcloning of the N-terminally VSV-tagged TRHR-1–GFP fusion protein has been described in detail previously [12].
Stable transfection of HEK293 cells VTGP1 cells, which stably express TRHR-1–GFP, were prepared as described previously [12]. Levels of TRHR-1–GFP expression in membrane fractions were assessed as 1.0 pmol\mg by the specific binding of [$H]TRH.
Preparation of cells for confocal laser-scanning microscopy VTGP1 cells were plated on sterile glass coverslips 2 days before experiments were begun. After the appropriate treatment, cells were washed once with PBS buffer (1.5 mM KH PO \Na HPO , # % # % pH 7.2\137 mM NaCl\2.7 mM KCl) at room temperature and fixed for 20 min by 4 % (w\v) paraformaldehyde in PBS\5 % (w\v) sucrose, pH 7.2, at room temperature. Fixed cells were washed twice with PBS\10 mM glycine (quenching of the fixative) and permeabilized with 0.4 % (v\v) Triton X-100 in PBS\10 mM glycine for 10 min at room temperature. After permeabilization, cells were incubated with the polyclonal rabbit antiserum CQ (anti-Gqα\G α) [24] (1 : 500 dilution) in PBS\10 mM glycine\0.2 "" % (w\v) BSA for 1 h at 37 mC. The primary antibody was then washed out three times with PBS\glycine at room temperature and coverslips were incubated with the secondary antibody [Alexa4 594 goat anti-rabbit IgG (HjL) conjugate (absorption 585 nm\emission 610 nm) ; Molecular Probes] in PBS\10 mM glycine at 1 : 400 dilution for 1 h at 37 mC. Finally, coverslips were washed three times with PBS\glycine at room temperature and mounted on microscope slides in 40 % (v\v) glycerol in PBS. Incubation of fixed cells with secondary antiserum (Alexa4 594) alone did not show any fluorescent signal (results not shown). For time course experiments, VTGP1 cells were placed on ice for 10 min immediately after the indicated time of TRH treatment, and then fixed.
Confocal laser-scanning microscopy Cells were observed by using a laser-scanning confocal microscope (Zeiss Axiovert 100) using a Zeiss Plan-Apo 63i1.40 NA oil-immersion objective and an electronic zoom 3. Dual colour co-localization of VSV-TRHR-1–GFP and Gqα\G α proteins "" was performed by using two excitation\emission systems. To localize VSV-TRHR-1–GFP, the GFP was excited using a 488 nm argon\krypton laser and detected with a 515–540 nm band-pass filter. Gqα\G α proteins were identified by excitation "" of Alexa4 594 at 543 nm and detected with a long pass-band filter at 570 nm. The images were manipulated with Zeiss LSM or Metamorph software.
Cell lysis and fractionation on sucrose-density gradients VTGP1 cells were collected by low-speed centrifugation and washed in ice-cold PBS. They were then resuspended in 2 ml of ice-cold hypotonic lysis buffer (20 mM Tris\HCl, pH 7.5\3 mM MgCl \1 mM EDTA) and homogenized for 5 min on ice in a # Potter–Elvehjem (Teflon–glass) homogenizer. The resulting cell # 1999 Biochemical Society
homogenate was adjusted to a final volume of about 7.5 ml with lysis buffer and centrifuged at 600 g for 5 min to remove nuclei and cell debris. A portion (7 ml) of this homogenate, containing approx. 20 mg of protein, was layered on to the top of a discontinuous sucrose-density gradient [5 ml each of 19 %, 23 %, 27 %, 31 %, 35 % and 43 % (w\v) sucrose in 20 mM Tris\HCl, pH 7.5\3 mM MgCl \1 mM EDTA]. The gradient was # centrifuged at 27 000 rev.\min for 60 min in a Beckman SW 28 rotor at 4 mC. Seven 5-ml fractions were subsequently collected manually from the top of the gradient. The pellet was resuspended in 5 ml of lysis buffer and designated fraction 8. The fractions were stored at k80 mC until used. Distribution of protein and marker-enzyme activities in this type of sucrose-density gradient has been described in detail previously [25, 26]. The first fraction (the first 5 ml from the top of the preformed sucrose gradient) represents the soluble cytosolic fraction, the second and third fractions are enriched in lowdensity membranes (light vesicles) and fractions 6 and 7 are preferentially enriched in plasma membranes.
Electrophoresis and immunoblot analysis The proteins contained in the fractions were precipitated by incubation with 6 % (w\v) trichloroacetic acid on ice for 1 h. The precipitates were dissolved in a small volume of buffer B [1 M Tris (base)\0.5 M boric acid\0.01 M EDTA] and then solubilized in an equal volume of Laemmli buffer [50 mM Tris\HCl, pH 8.0\6 % (w\v) dithiothreitol\5 % (w\v) SDS\30 % (w\v) urea\0.005 % (w\v) Bromphenol Blue]. The Gqα\G α "" protein was resolved by standard SDS\PAGE (10 % gels). In order to resolve VSV-TRHR-1–GFP, a borate-based electrophoresis buffer system [27] was used, with modifications. Briefly, the resolving polyacrylamide gel was made with 10 % (w\v) acrylamide, 0.0625 % (w\v) bisacrylamide, 0.1 M Tris\0.1 M boric acid (pH 8.5), 0.0025 M EDTA, 0.1 % (w\v) SDS, 0.005 % (w\v) TEMED (N,N,Nh,Nh-tetramethylethylenediamine) and 0.1 % (w\v) ammonium persulphate. The stacking gel was of the same composition, except that it contained 4 % (w\v) acrylamide. The borate electrophoresis running buffer was : 0.1 M Tris\0.1 M boric acid\0.0025 M EDTA\0.1 % (w\v) SDS, pH 8.5. Standard and borate electrophoresis were run at 200 V and 150 V respectively for 1 h, using a Mini Protean II gel kit (Bio-Rad). After SDS\PAGE, proteins were electrophoretically transferred to nitrocellulose. The membrane was blocked in 3 % (w\v) fatfree milk in PBS-T buffer [PBS containing 0.1 % (v\v) Tween 20] for 1 h. After a brief wash in PBS-T buffer, the membrane was incubated at 4 mC overnight with an appropriate primary antibody diluted in PBS-T buffer containing 1 % fat-free milk. The GFP polyclonal antibody (Clontech) was used for the detection of VSV-TRHR-1–GFP and antiserum CQ for the detection of Gqα\G α. The primary antibody was then removed and the blot "" washed extensively in PBS-T buffer. Subsequent incubation with the secondary antibody (donkey anti-rabbit IgG conjugated with horseradish peroxidase ; Scottish Antibody Production Unit, Carluke, Scotland, U.K.) was for 2 h at room temperature, and after extensive washing in PBS-T buffer the blot was visualized by ECL (Amersham). In some cases, after detection of VSVTRHR-1-GFP, the membranes were stripped by incubation in 62.5 mM Tris\HCl, pH 7.5\100 mM 2-mercaptoethanol\2 % (w\v) SDS at 50 mC for 30 min and reprobed for Gqα\G α. "" Quantitative analysis of specific bands was performed by scanning with an imaging densitometer GS-670 (Bio-Rad). The relative distribution of proteins in the gradient fractions was expressed as a percentage of the total immunological signal in the whole gradient.
Thyrotropin-releasing hormone receptor-1 and Gqα/G11α internalization Drug treatments Cytochalasin D and nocodazole were dissolved as 500i concentrated stock solutions in DMSO and the final concentration was 5 µg\ml and 10 µM respectively. Cytochalasin D was added 30 min and nocodazole 60 min before TRH treatment.
RESULTS We have recently stably expressed, in HEK293 cells, a construct in which a VSV-epitope tag was engineered on to the N-terminus
Figure 1
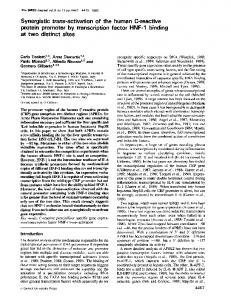
Detection of Gqα/G11α in membranes of clone VTGP1 cells
Membranes of clone VTGP1 cells (lanes 1 and 4, 2 µg ; lanes 2 and 5, 4.5 µg ; lanes 3 and 6, 9 µg) were resolved by SDS/PAGE [10 % (w/v) acrylamide] and immunoblotted with antiserum CQ (1 : 5000 dilution) (lanes 1–3). In lanes 4–6, antiserum CQ was preincubated before use with a decapeptide QLNLKEYNLV (25 µg/ml) representing the C-terminus of both Gqα and G11α.
Figure 2
531
of a fusion protein between the long isoform of the rat TRHR1 and a thermostabilized variant of GFP from A. ictoria to generate clone VTGP1 [12]. In the present work, these cells have been used to co-visualize the dynamics of the agonistmediated redistribution of VSV-TRHR-1–GFP and the phosphoinositidase-C-activating G-proteins, Gqα\G α. "" Immunoblotting membranes of clone VTGP1 cells with the Gqα\G α antiserum CQ [24] identified an apparently single "" polypeptide of approx. 43 kDa. Immunostaining of Gqα\G α in "" membranes was abolished by preincubation with the immunogenic peptide used to generate antiserum CQ (Figure 1). We have previously demonstrated that HEK293 cells co-express Gqα and G α and that these proteins can be resolved by electrophoresis "" in urea-containing gels [25]. However, when expressed in HEK293 cells, the TRHR-1 activates these two G-proteins, of highly similar sequence, equally [23] and therefore no attempt was made to resolve them in the present studies. Immunostaining of paraformaldehyde-fixed clone VTGP1 cells with antiserum CQ followed by an Alexa4 594-labelled goat anti-rabbit IgG secondary antiserum allowed detection of the cellular location of Gqα\G α by imaging in the ‘ red ’ channel of "" the confocal microscope. Signal corresponding to these G-proteins was noticeably concentrated at the plasma membrane and the distribution was essentially homogenous. However, clear
Analysis of agonist-induced redistribution of VSV-TRHR-1–GFP and Gqα/G11α in clone VTGP1 cells
Cells of clone VTGP1 were untreated (a–c) or treated with TRH (1 µM for 5 h) before fixation (d–f). Indirect immunofluorescence confocal microscopy was used to detect the distribution of Gqα/G11α (red), and the intrinsic fluorescence of GFP was used to detect the presence of VSV-TRHR-1–GFP (green). A combination of these signals (yellow) detected the overlap of distribution of the GPCR and G-proteins. # 1999 Biochemical Society
532
Figure 3
T. Drmota and others
Kinetics of internalization of VSV-TRHR-1–GFP and Gqα/G11α in clone VTGP1 cells
Clone VTGP1 cells were untreated (a) or treated with TRH (1 µM) for 1 min (b), 5 min (c), 1 h (d), 3 h (e) or 5 h (f). The cells were fixed and the location of VSV-TRHR-1–GFP (green), Gqα/G11α (red) and their overlap (yellow) was examined as described in the legend to Figure 2.
# 1999 Biochemical Society
Thyrotropin-releasing hormone receptor-1 and Gqα/G11α internalization
Figure 4 Redistribution of VSV-TRHR-1–GFP monitored in sucrose-density gradients Clone VTGP1 cells were untreated [upper panel, (a) ; lower panel, ) or treated with TRH (1 µM) for 30 min (upper panel, (b) ; lower panel, $) or for 5 h (upper panel, (c) ; lower panel, 4). After disruption of the cells the homogenates were centrifuged through sucrose-density gradients. Equal volumes of eight fractions of the gradients were precipitated and resolved by borate/SDS/PAGE. Following transfer to nitrocellulose an anti-GFP antibody was used to identify VSV-TRHR-1–GFP (upper panels). The immunoblots were scanned and the distribution of VSVTRHR-1–GFP was recorded with 100 % representing the total immunostaining for VSV-TRHR1–GFP over the entire gradient (lower panel). Three further sucrose-density gradient experiments were performed and the key quantitative data were pooled and are presented in Table 1.
Table 1 TRH-induced redistribution of VSV-TRHR-1–GFP and Gqα/G11α in selected sucrose-density gradient fractions The percentage of VSV-TRHR-1–GFP (receptor) or Gqα/G11α (G-protein) in specific sucrosedensity gradients fractions (100 % l total immunostaining of the relevant protein over the entire gradient) is displayed. Data represent meanspS.E.M. derived from four separate gradients. Representative examples of the gradient profiles used to construct Table 1 are shown in Figures 4 and 5. Fraction TRH incubation (h) 1 Receptor 0 0.5 5 G-protein 0 0.5 5
2.1p0.7 1.7p1.1 1.2p0.3 1.0p0.8 2.0p0.6 4.8p0.9*
* Significant difference from control, P
2
3
6
7
8.2p2.0 9.9p5.8 11.4p3.0 10.5p1.2 11.8p2.5 15.4p0.8*
7.2p2.6 13.7p1.8* 14.6p1.9* 10.4p1.3 11.7p1.3 13.3p0.3
23.6p1.7 18.7p5.3 18.2p1.6* 19.7p0.8 17.6p1.1 16.6p0.5
31.1p5.6 26.3p4.0 22.6p2.2* 20.1p2.1 20.4p1.0 16.7p1.0
0.05.
Figure 5
533
Redistribution of Gqα/G11α monitored in sucrose-density gradients
Clone VTGP1 cells were untreated [upper panel, (a) ; lower panel, ] or treated with TRH (1 µM) for 30 min [upper panel, (b) ; lower panel, $] or 5 h [upper panel, (c) ; lower panel, 4]. Following disruption of the cells the homogenates were centrifuged through sucrosedensity gradients. Equal volumes of eight graduent fractions were precipitated and resolved by borate/SDS/PAGE. After transfer to nitrocellulose, antiserum CQ was used to identify Gqα/G11α. (upper panels). The immunoblots were then scanned and the distribution of Gqα/G11α was recorded, with 100 % representing the total immunostaining for Gqα/G11α over the entire gradient (lower panel). Three further experiments were performed on separate sucrose-density gradients and key quantitative data were pooled and are presented in Table 1.
evidence of staining at intracellular locations was also obtained (Figure 2c). All positive staining was abolished following preincubation of the antiserum with the immunogenic peptide (results not shown). Visualization of the location of VSV-TRHR1–GFP was obtained by concurrently imaging the same cells in the ‘ green ’ channel of the confocal microscope. Again, the location of VSV-TRHR-1–GFP was clearly concentrated at the plasma membrane and staining appeared essentially homogenous (Figure 2b). A degree of intracellular signal from VSV-TRHR1–GFP could also be observed. Co-localization of Gqα\G α and "" VSV-TRHR-1–GFP at the plasma membrane was confirmed by merging the signals, which resulted in clear overlap and a ‘ yellow ’ signal (Figure 2a). Although a degree of overlap of intracellular signals was noted, excess intracellular G-protein, which did not appear to overlap with VSV-TRHR-1-GFP, was also observed. Incubation of the cells with TRH (1 µM for 5 h) before fixation resulted in the internalization of a significant amount of the plasma-membrane-delineated complement of VSV-TRHR-1–GFP (Figure 2e). After this treatment, the pattern of Gqα\G α staining was more complex and, although "" much of the G-protein remained at the plasma membrane, clear internalization of a fraction of its immunoreactivity was also # 1999 Biochemical Society
534
T. Drmota and others
observed (Figure 2f). Merging of the signals suggested that fractions of the internalized G-protein and VSV-TRHR-1–GFP were in overlapping or closely apposed locations. However, much of the G-protein remained at the plasma membrane and there was little evidence from these studies for a maintained overlap between the remaining plasma membrane VSV-TRHR1–GFP and G-protein (Figure 2d). Clone VTGP1 cells were exposed to TRH (1 µM) for various times and then fixed, immunostained for Gqα\G α, and pro"" cessed for confocal microscopy to allow concurrent examination of the kinetics of VSV-TRHR-1–GFP and G-protein redistribution and internalization. Within 1 min of treatment with TRH, the plasma membrane-located VSV-TRHR-1–GFP and Gqα\G α began to separate from one another as shown by the "" appearance of punctate, plasma-membrane-delineated foci of ‘ green ’ VSV-TRHR-1–GFP on a background of ‘ red ’ G-protein (Figure 3b). Within 5 min, as shown by the now very distinct separation of the ‘ red ’ and ‘ green ’ colour signals, the VSVTRHR-1–GFP could be seen to be internalizing into punctate vesicles, whereas the G-protein remained at the plasma membrane (Figure 3c). At time periods of up to 1 h the separation of VSVTRHR-1–GFP and Gqα\G α initially became more pronounced "" and then remained distinctive (Figure 3d). However, by 3 h after the addition of TRH, although the cells maintained a healthy population of plasma membrane Gqα\G α, internalization of a "" fraction of the G-protein and its overlap with the previously internalized VSV-TRHR-1–GFP was clearly seen as a ‘ yellow ’ intracellular pattern of staining (Figure 3e). This was maintained over the longest time period (5 h) examined (Figure 3f). As internalization of VSV-TRHR-1–GFP in response to TRH was a rapid process it was monitored directly in intact clone VTGP1 cells. Following the addition of TRH (1 µM), 90 images were taken over a period of 20 min and compiled into a movie sequence to allow examination of the kinetics and dynamics of receptor internalization (see http:\\www.BiochemJ.org\bj\340\ bj3400529add.htm). To provide biochemical correlates for the biological examination of the cells described above, homogenates of VTGP1 cells were subjected to centrifugation through sucrose-density gradients. Protein-containing fractions were resolved by SDS\ PAGE and, because an anti-VSV-tag antibody failed to produce a strong immunological signal (results not shown), the gels were immunoblotted with an anti-GFP antibody to detect the location of TRHR-1–GFP. Standard SDS\PAGE resulted in the bulk of the anti-GFP antibody-reactive protein failing to enter the resolving gel efficiently and thus being concentrated at the interface of stacking and resolving gels (results not shown). To overcome this, a gel system based on borate buffers, which has been reported previously to be suitable for analysis of glycoproteins [27] was used. The anti-GFP antibody allowed identification of a strong, diffuse band with a moleculer mass of approx. 85 kDa. VSV-TRHR-1–GFP was widely distributed in the sucrose-density gradient with the highest levels centered on fractions 6 and 7 (Figure 4), which have been shown previously to be enriched with plasma-membrane markers, such as Na+\K+ ATPase and adenylate cyclase [25,26]. Analysis of a series of immunoblots indicated that 50–60 % of the total cellular levels of VSV-TRHR-1–GFP were present in these fractions, and approx. 20 % was in the light-vesicle-containing fractions, represented by fractions 2, 3 and 4 (Figure 4, lower panel, and Table 1). Addition of TRH resulted in redistribution of the profile of VSV-TRHR1–GFP immunoreactivity. Within 30 min a clear decrease in the proportion of gradient VSV-TRHR-1–GFP was detected in fractions 6 and 7 with corresponding increases in VSV-TRHR1–GFP immunoreactivity in lighter density fractions of the # 1999 Biochemical Society
Figure 6 The effects of cycloheximide on VSV-TRHR-1–GFP immunoreactivity and redistribution in response to TRH Clone VTGP1 cells were pretreated with cycloheximide (100 µM for 30 min) before addition of vehicle (upper panel) or TRH (1 µM) (lower panel) for 5 h. Cells were harvested, homogenized and applied to sucrose-density gradients. Following gel-electrophoresis and transfer to nitrocellulose the samples were immunoblotted using anti-GFP antibody.
gradient concentrated in fractions 3 and 4 (Figure 4, Table 1). Greater periods of exposure to TRH (up to 5 h) did not further modify the relative contributions of the individual density fractions to the total cellular VSV-TRHR-1–GFP immunoreactivity profile. Unexpectedly, however, a consistent marked increase in total gradient immunoreactivity corresponding to VSV-TRHR-1–GFP was observed with time of exposure to TRH over a large number of independent experiments (Figure 4, upper panel). No significant level of immunodetectable VSVTRHR-1–GFP was present in the cytosolic fraction (fraction 1) either before or after TRH treatment. Immunoblotting of the same sucrose-density gradient fractions for the presence of Gqα\G α displayed an even more widespread "" distribution over the gradient for untreated cells. Immunoreactivity in fractions 6 and 7 contributed approx. 40 % of the total gradient G-protein (Figure 5 and Table 1). After the addition of TRH for 30 min, no change in the distribution of Gqα\G α immunoreactivity was observed. However, after treat"" ment of the cells for 5 h with TRH, a trend towards a reduction in Gqα\G α immunoreactivity in the plasma-membrane"" enriched sucrose-density gradient fractions was coupled with a clear (Figure 5) and statistically significant (Table 1) increase in the light-vesicle containing fractions, particularly in fraction 2. Unlike the VSV-TRHR-1–GFP, there was a small, but clearly detectable, fraction of cytoplasmic Gqα\G α and levels in this "" fraction were increased substantially following sustained TRH treatment. (Figure 5 and Table 1). However, unlike the VSVTRHR-1–GFP immunoreactivity, total levels of G-protein immunoreactivity were essentially unaltered by treatment with TRH for up to 5 h (Figure 5). To examine further the enhanced immunological signal corresponding to VSV-TRHR-1–GFP following TRH treatment, similar experiments were performed in the presence of the proteinsynthesis inhibitor cycloheximide. This treatment prevented the overall upregulation of VSV-TRHR-1–GFP immunoreactivity observed in response to TRH but did not interfere with the ability of the agonist to modify the location of VSV-TRHR1–GFP in the sucrose-density gradient fractions (Figure 6). Agonist-induced internalization of both VSV-TRHR-1–GFP and Gqα\G α were also observed by confocal microscopy of "" cycloheximide-pretreated clone VTGP1 cells (results not shown).
Thyrotropin-releasing hormone receptor-1 and Gqα/G11α internalization
535
Figure 8 Internalization of VSV-TRHR-1–GFP and Gqα/G11α in clone VTGP1 cells : the effects of nocodazole Sucrose-density gradients similar to those described in the legends to Figures 4 and 5 were used to resolve membrane fractions of clone VTGP1 cells, which were pretreated with nocodazole (10 µM for 60 min) and then subsequently treated with (4) or without ( ) TRH (1 µM) for 5 h. Immunoblots to detect either VSV-TRHR-1–GFP (upper panel) or Gqα/G11α (lower panel) were performed and quantified as described in Figures 4 and 5. Data represent the meansprange from two separate sucrose-density gradients.
Figure 7 Internalization of VSV-TRHR-1–GFP and Gqα/G11α in clone VTGP1 cells : the effects of cytochalasin D (A) Sucrose-density gradients similar to those described in Figures 4 and 5 were used to resolve membrane fractions of clone VTGP1 cells, which had been pretreated with cytochalasin D (5 µg/ml for 30 min) and then subsequently treated with (4) or without ( ) TRH (1 µM) for 5 h. Immunoblots to detect either VSV-TRHR-1–GFP (upper panel) or Gqα/G11α (lower panel) were performed and quantified as described in Figures 4 and 5. Data represent the meansprange from two separate sucrose-density gradients. (B) Clone VTGP1 cells were pretreated with cytochalasin D (5 µg/ml for 30 min) and then subsequently treated with TRH (1 µM) for 5 h. Cells were fixed and immunostained for Gqα/G11α and imaged by confocal microscopy. (a) Distribution of VSV-TRHR-1–GFP. (b) Distribution of Gqα/G11α.
Cytochalasin D functions as an inhibitor of cytoskeletal actin microfilament organization. Pretreatment of VTGP1 cells with cytochalasin D (5 µg\ml) for 30 min resulted in a reduction in the percentage of total cellular Gqα\G α immunoreactivity "" present in fractions 6 and 7. However, after 5 h pretreatment, the cellular distribution of Gqα\G α was unchanged. In contrast, "" the basic cellular distribution profile of VSV-TRHR-1–GFP was unaffected by pretreatment with cytochalasin D and TRH treatment still resulted in a marked shift of the GPCR from
the plasma-membrane-enriched fractions to the lower density end of the gradient (Figure 7A). Confocal microscopy provided supporting evidence. Treatment with cytochalasin D allowed essentially normal internalization of VSV-TRHR-1–GFP but little or no internalization of Gqα\G α (Figure 7B). "" The microtubule inhibitor nocodazole was also used to study potential differences in the mechanisms of agonist-induced redistribution of VSV-TRHR-1–GFP and Gqα\G α. Compared "" with untreated cells, simple preincubation with nocodazole resulted in a sharpening of the distribution pattern of VSVTRHR-1-GFP, and approx. 50 % of the total cellular levels were concentrated in fraction 7 of the sucrose-density gradient. However, treatment with TRH for 5 h still resulted in a marked shift of the receptor population to the light-vesicle fractions (Figure 8). Confocal imaging of similarly treated cells again clearly confirmed internalization of VSV-TRHR-1–GFP into punctate vesicles (Figure 9). In contrast, up to 5 h treatment with TRH produced little or no variation in the Gqα\G α distribution "" pattern following pretreatment of the cells with nocodazole (Figures 8 and 9). When signals from VSV-TRHR-1–GFP and Gqα\G α, after TRH treatment of nocodazole-incubated clone "" VGPT1 cells, were merged, it was again apparent that a substantially greater degree of internalization of TRHR-1 than G-protein had occurred ; there was obvious ‘ green ’ staining of punctate intracellular vesicles, which seemed to penetrate more deeply into the cells than the intracellular staining of the # 1999 Biochemical Society
536
T. Drmota and others two sets of proteins were resolved rather than overlapping. As described previously for VSV-TRHR-1–GFP [12], nocodazole treatment restricted the intracellular redistribution of the receptor to vesicle fractions which remained in relatively close apposition to the plasma membrane (Figure 9).
DISCUSSION
Figure 9 Internalization of VSV-TRHR-1–GFP and Gqα/G11α in clone VTGP1 cells : confocal analysis of the effects of nocodazole Clone VTGP1 cells were pretreated with nocodazole (10 µM for 60 min) and subsequently treated with TRH (1 µM) for 5 h. Cells were fixed and imaged as described in the legends of Figures 2 and 3 to identify VSV-TRHR-1–GFP (B), Gqα/G11α (C) and their potential overlap (A).
G-proteins (Figure 9). More effective internalization of VSVTRHR-1–GFP under these conditions was, moreover, apparent from the development of a clear corona of Gqα\G α still located "" at the plasma membrane, and most of the cellular signals of the # 1999 Biochemical Society
Although considerable effort has been devoted to studies on the cellular distribution of GPCRs and their redistribution following exposure of cells to agonist ligands, less emphasis has been focused on the possible redistribution of other elements of signal transduction cascades. At least for the α subunits of members of the family of heterotrimeric G-proteins, this is not a reflection that redistribution has not been observed. Studies on regulation of cellular G-protein populations tend to fall into two broad classes. In the first of these, rapid translocation of G-protein from the plasma membrane to the cytoplasm has been recorded. The bulk of studies on this phenomenon have focused on the α subunit of Gs. For example, early studies on agonist-activation of the β -adrenoceptor expressed endogenously by S49 lymphoma # cells recorded a bulk transfer of Gsα into the soluble fraction. This cytoplasmic location was maintained for a significant period [13]. Furthermore, as incubation of these cells with hypertonic sucrose, which is well established to interfere with agonistinduced internalization of the β -adrenoceptor [28–30], did not # prevent β -adrenoceptor agonist-mediated transfer of Gsα to the # cytosol, then the processes of rapid cellular GPCR and G-protein redistribution appeared to be disconnected [28]. In contrast to these relatively short-term studies, long-term incubation of cells with agonists at GPCRs can result in a redistribution within membrane-delineated domains, and\or a downregulation of levels of the G-protein α subunit activated by the receptor [31]. Again, early studies demonstrated this, principally for Gsα. Sustained treatment of NG108-15 cells, which express an IP prostanoid receptor endogenously, with prostaglandin E1 resulted in downregulation of Gsα, whereas levels of other G-proteins were unaffected [14]. Recently, an immunocytochemical approach was used to observe dramatic, if rather slow, redistribution of the G-protein G α from the plasma "" membrane to punctate intracellular locations after addition of agonist to HEK293 cells stably transfected to express high levels of both the long isoform of the rat TRHR-1 and G α [32]. "" The capacity to modify GPCR cDNAs so that GFP is attached in-frame to the C-terminal tail of the expressed protein has recently provided a new opportunity to visualize their cellular location and the trafficking of these proteins in intact cells and in real time [9–12]. We recently stably expressed rat VSV-TRHR1–GFP in HEK293 cells and studied its internalization in response to agonist treatment [12]. Internalization was rapid, proceeded via a mechanism which was blocked by hypertonic sucrose, and within a short time the GPCR-GFP construct was present in a population of punctate vesicles which overlapped with or were in close apposition to the early endosomes, as shown by co-localization with Texas Red transferrin [12]. In the present study, the VSV-TRHR-1-GFP-expressing HEK293 cells were used to explore the steady-state cellular distribution of VSV-TRHR-1–GFP and Gqα\G α concurrently, "" and to examine aspects of their spatio-temporal redistribution in response to agonist. By using a combination of the autofluorescence of VSV-TRHR-1–GFP and indirect immunofluorescence of Gqα\G α, in concert with biochemical analyses "" based on immunochemical detection of the cellular membrane proteins resolved by sucrose-density centrifugation, we have obtained a detailed, and at least semi-quantitative, understanding
Thyrotropin-releasing hormone receptor-1 and Gqα/G11α internalization of these two processes in cells which do not overexpress the relevant G-proteins. Confocal analysis of sections of clone VTGP1 cells indicated that, although the plasma membrane was richly endowed with these G-proteins, cellular distribution was more widespread (see Figure 2). Importantly, immunoblotting studies on membrane fractions from sucrose-density gradients confirmed a widespread particulate distribution of the G-proteins. Moreover, although the cytoplamic content was only 1 % of the total cellular content, this could also be monitored (see Figure 4). Short times (30 min) of exposure to TRH did not alter the cellular distribution of the G-proteins, but longer treatment (5 h) resulted in an increase of 50 % in the percentage of total cell Gqα\G α, which was now present in the light-vesicle "" fractions, and an increase from 1 % to 4 % in the cytoplasm. These studies are easily quantified but suffer from the need to disrupt the cells before analysis. Encouragingly, a clear and slow movement of Gqα\G α to intracellular vesicles was also recorded "" in response to TRH treatment when immunofluorescence experiments were analysed by confocal microscopy. Although visually dramatic, these studies should be considered in a purely qualitative fashion, particularly when merging of signals was used to examine potential overlap of distributions with other proteins. Although the TRHR-1–GFP construct had been specifically modified with an N-terminal VSV-epitope tag to allow immunological detection, immunoblotting studies with the relevant antibody did not provide a strong signal (results not shown). However, the availability of an antibody to GFP did allow appropriate detection of the receptor construct in the sucrosedensity gradient samples. Movement of VSV-TRHR-1–GFP between the plasma-membrane-enriched fractions and the lightvesicle fractions was now observed in response to TRH with a rapid time course. Maximal effects were observed within 30 min. Again, these results were entirely in accord with those from confocal microscopy, both in fixed cells, as used in the present study, and in intact cells [12]. Importantly, the ability to strip and reprobe immunoblots of the same fractions allowed us to show that, whereas the intracellular vesicle populations containing VSV-TRHR-1–GFP and Gqα\G α may overlap, as suggested "" by the merging of confocal images, they may not be identical, with the G-protein internalized in response to agonist generally migrating in somewhat lighter vesicles than the GPCR. As a means of exploring whether GPCR and G-protein internalization might be mediated by similar processes, despite their time courses being very different, we adopted a number of strategies. It has been reported previously that internalization of VSV-TRHR-1–GFP is prevented by sucrose concentrations which effectively interfere with the formation of clathrin-coated vesicles. Sucrose treatment appeared to have some non-specific effects on G-protein distribution but this was not pursued further [12]. Interestingly, although nocodazole treatment of cells allowed internalization of VSV-TRHR-1–GFP, the cellular location of the internalized receptors remained in relatively close apposition to the plasma membrane. By contrast, internalization and redistribution of Gqα\G α was completely prevented by this "" treatment. Again, data from analysis of sucrose-density gradient fractions and confocal microscopy were entirely in agreement. Although flattening the overall gradient profile of both receptor and G-protein, treatment of the cells with cytochalasin D produced a situation in which the receptor but not the G-protein could be internalized in response to agonist. These data indicate clearly that the processes responsible for redistribution of the two signalling proteins can be resolved. In addition, these observations indicate an important role for the intact cytoskeleton in the processes of internalization of G-proteins, as suggested by previous studies [33,34].
537
Although analysis of the products of the sucrose-density gradient and confocal images produced qualitatively similar and mutually supportive data this is more difficult to extend to a quantitative basis. A number of confocal images suggested that virtually the entire VSV-TRHR-1–GFP population could be internalized in response to agonist, with little remaining at the plasma membrane. This was less apparent in the sucrose-gradient studies. However, it must be remembered that membrane fractionation procedures simply enrich various fractions rather than purify them, and also that the cell numbers required for confocalimage analysis were much less than the number needed for gradient analysis and were grown on glass coverslips, whereas those for gradient analysis were from a batch culture. A surprising observation during these studies was the marked increase in immunoreactivity corresponding to VSV-TRHR1–GFP following sustained treatment of clone VTGP1 cells with TRH (see Figure 5). Although this upregulation was blocked by preincubation with cycloheximide (see Figure 6), it is difficult to provide a clear explanation for these observations, as expression of the construct is driven via the cytomegalovirus-derived promoter of the expression vector rather than the natural promoter of the GPCR. However, cycloheximide treatment did not prevent agonist-induced internalization of either the receptor or G-protein, demonstrating that these processes do not require de noo production of an unidentified protein(s). Given the slow time scale of G-protein internalization, this had hitherto been a possibility. Overall, despite concerns regarding the quantitative basis of the dual imaging approach employed in the present study, a combination of cell biological and biochemical analyses has provided definitive new evidence that, while both GPCRs and G-proteins can be internalized and redistributed in cells in response to agonist activation of the receptor, the time scales and processes responsible are very distinct. We anticipate that the use of such dual-imaging strategies will grow but suggest that strong supportive biochemical analysis is required in parallel to produce quantitatively relevant data. These studies were supported by the Biotechnology and Biosciences Research Council and the Wellcome Trust.
REFERENCES 1 2 3 4 5 6 7 8 9 10
11 12 13 14
von Zastrow, M. and Kobilka, B. K. (1992) J. Biol. Chem. 267, 3530–3538 Ashworth, R., Yu, R., Nelson, E. J., Dermer, S., Gershengorn, M. C. and Hinkle, P. M. (1995) Proc. Natl. Acad. Sci. U.S.A. 92, 512–516 Pippig, S., Andexinger, S. and Lohse, M. J. (1995) Mol. Pharmacol. 47, 666–676 Koenig, J. A. and Edwardson, J. M. (1997) Trends Pharmacol. Sci. 18, 276–287 Yu, R. and Hinkle, P. M. (1998) Mol. Endocrinol. 12, 737–749 Rizzuto, R., Brini, M., Pizzo, P., Murgia, M. and Pozzan, T. (1995) Curr. Biol. 5, 635–642 Girotti, M. and Banting, G. (1996) J. Cell Sci. 109, 2915–2926 Htun, H., Barsony, J., Renyi, I., Gould, D. L. and Hager, G. L. (1996) Proc. Natl. Acad. Sci. U.S.A. 93, 4845–4850 Barak, L. S., Ferguson, S. S., Zhang, J., Martenson, C., Meyer, T. and Caron, M. G. (1997) Mol. Pharmacol. 51, 177–184 Tarasova, N. I., Stauber, R. H., Choi, J. K., Hudson, E. A., Czerwinski, G., Miller, J. L., Pavlakis, G. N., Michejda, C. J. and Wank, S. A. (1997) J. Biol. Chem. 272, 14817–14824 Kallal, L., Gagnon, A. W., Penn, R. B. and Benovic, J. L. (1998) J. Biol. Chem. 273, 322–328 Drmota, T., Gould, G. W. and Milligan, G. (1998) J. Biol. Chem. 273, 24000–24008 Ransnas, L. A., Svoboda, P., Jasper, J. R. and Insel, P. A. (1989) Proc. Natl. Acad. Sci. U.S.A. 86, 7900–7903 McKenzie, F. R. and Milligan, G. (1990) J. Biol. Chem. 265, 17084–17093 # 1999 Biochemical Society
538
T. Drmota and others
15 Shah, B. H., MacEwan, D. J. and Milligan, G. (1995) Proc. Natl. Acad. Sci. U.S.A. 92, 1886–1890 16 Wise, A., Lee, T. W., MacEwan, D. J. and Milligan, G. (1995) J. Biol. Chem. 270, 17196–17203 17 Gershengorn, M. C. and Osman, R. (1996) Physiol. Rev. 76, 175–191 18 Sellar, R. E., Taylor, P. L., Lamb, R. F., Zabavnik, J., Anderson, L. and Eidne, K. A. (1993) J. Mol. Endocrinol. 10, 199–206 19 Itadani, H., Nakamura, T., Itoh, J., Iwaasa, H., Kanatani, A., Borkowski, J., Ihara, M. and Ohta, M. (1998) Biochem. Biophys. Res. Commun. 250, 68–71 20 Cao, J., O’Donnell, D., Vu, H., Payza, K., Pou, C., Godbout, C., Jakob, A., Pelletier, M., Lembo, P., Ahmad, S. and Walker, P. (1998) J. Biol. Chem. 273, 32281– 32287 21 Aragay, A. M., Katz, A. and Simon, M. I. (1992) J. Biol. Chem. 267, 24983–24988 22 Hsieh, K. P. and Martin, T. F. (1992) Mol. Endocrinol. 6, 1673–1681 23 Kim, G. D., Carr, I. C., Anderson, L. A., Zabavnik, J., Eidne, K. A. and Milligan, G. (1994) J. Biol. Chem. 269, 19933–19940 24 Mitchell, F. M., Buckley, N. J. and Milligan, G. (1993) Biochem. J. 293, 495–499 Received 28 January 1999/8 March 1999 ; accepted 24 March 1999
# 1999 Biochemical Society
25 Svoboda, P., Kim, G. D., Grassie, M. A., Eidne, K. A. and Milligan, G. (1996) Mol. Pharmacol. 49, 646–655 26 Svoboda, P., Kvapil, P., Insel, P. A. and Ransnas, L. A. (1992) Eur. J. Biochem. 208, 693–698 27 Poduslo, J. F. (1981) Anal. Biochem. 114, 131–139 28 Wedegaertner, P. B., Bourne, H. R. and von Zastrow, M. (1996) Mol. Biol. Cell 7, 1225–1233 29 Ferguson, S. S., Zhang, J., Barak, L. S. and Caron, M. G. (1998) Adv. Pharmacol. 42, 420–424 30 Lefkowitz, R. J. (1998) J. Biol. Chem. 273, 18677–18680 31 Milligan, G. (1993) Trends Pharmacol. Sci. 14, 413–418 32 Drmota, T., Novotny, J., Kim, G. D., Eidne, K. A., Milligan, G. and Svoboda, P. (1998) J. Biol. Chem. 273, 21699–21707 33 Bomsel, M., Parton, R., Kuznetsov, S. A., Schroer, T. A. and Gruenberg, J. (1990) Cell 62, 719–731 34 Ibarrondo, J., Joubert, D., Dufour, M. N., Cohen-Solal, A., Homgurger, V., Jard, S. and Guillon, G. (1995) Proc. Natl. Acad. Sci. U.S.A. 92, 8413–8417