Domain Visualization Using VxInsight® for Science and Technology Management This is a preprint of an article accepted for publication in Journal of the American Society for Information Science and Technology (JASIST) © 2001 John Wiley & Sons, Inc.
Kevin W. Boyack, Brian N. Wylie, and George S. Davidson 1 Sandia National Laboratories* , P.O. Box 5800, Albuquerque, NM 87185. E-mail:
[email protected]
We present the application of our knowledge visualization tool, VxInsight®, to enable domain analysis for science and technology management within the enterprise. Data mining from sources of bibliographic information is used to define subsets of information relevant to a technology domain. Relationships between the individual objects (e.g. articles) are identified using citations, descriptive terms, or textual similarities. Objects are then clustered using a forcedirected placement algorithm to produce a terrain view of the many thousands of objects. A variety of features which allow exploration and manipulation of the landscapes and which give detail-on-demand, enable quick and powerful analysis of the resulting landscapes. Examples of domain analyses used in S&T management at Sandia are given.
Introduction Management of science and technology (S&T) has long been a labor-intensive process, relying extensively on the accumulated knowledge of those within the enterprise. Activities such as technology planning, roadmapping, and the identification of promising or potentially disruptive technologies have been time-consuming, and have relied on incomplete information and expert opinion. In addition, the risks associated with poorly managing technology investments have never been greater. Fortunately, with the increasing availability of information sources, computing power, advanced visualization techniques, and the emergence of practices such as domain analysis (Hjorland & Albrechtsen 1995), S&T management can be done much more rapidly and with increasing robustness than in the past. Effective practices must become an integral part of the S&T sponsor’s business operations, but at the same time the knowledge of subject matter experts must continue to play a crucial role (Losiewicz, Oard & Kostoff, 2000). The fields of bibliometrics and citation analysis have been used to inform S&T management over the years. Much of the work in these fields has been aimed at developing and evaluating techniques, using domains well known to the authors, for example the domain of
information science in White and McCain (1998). While these studies have elaborated on knowledge communities, structure of domains, and trends within those domains, few studies have sought to answer detailed questions of a competitive nature – questions such as “Who are my competitors in this domain?” “What is their technology?” “Will their technology disrupt my business?” “Should I partner? … and if so, with whom?” This is perhaps not surprising in that the results of such studies would contain proprietary information that a sponsor would not want to make public. Detailed questions such as these about one’s competition are critical to robust S&T management. Yet, they seem to have been largely ignored by practitioners of information science, and left to market researchers who too often make little use of the scientific literature and its wealth of competitive information. At Sandia National Laboratories, we are making use of domain visualization as input to the S&T management process for many of our technologies. While some of this work has been done from an academic viewpoint, the majority of our studies are done to provide concrete answers to specific questions in a narrow technology domain, and thus guide our S&T investment, development, and partnering strategies in those domains. We perform these detailed domain analyses using our knowledge visualization tool, VxInsight® (Davidson et al. 1998; Beck et al. 1999), which transforms information such as documents, patents, or even genomic data into an intuitive visual format that is easy to interpret and that allows natural navigation and query. VxInsight presents information as a landscape, a familiar representation that we are adept at interpreting and that allows very large data sets to be represented. The landscape representation conveys significant information about the implicit structure of the data, providing context for the analyst’s exploration and queries of the database.
* Sandia is a multiprogram laboratory operated by Sandia Corporation, a Lockheed Martin Company, for the United States Department of Energy under Contract DE-AC04-94AL85000.
clustering methods for producing maps include hierarchical clustering, k-means algorithms, multidimensional scaling, principal components analysis, and self-organizing maps. Historically, the standard mapping output has been a circle plot where each cluster is represented by a circle sized to represent the number of documents. Links between circles provide relationship information including the strength of the link. Traditionally, map outputs have been paper-based and only resolve structure at a few discrete levels. However, in recent years, several systems have been reported that use a computer display and allow some navigation of the map space.
In this paper, we provide a review of related work and tools, a description of the VxInsight tool and its functionality, and then report on features of specific domain analyses used for competitive intelligence purposes at Sandia. The paper concludes with a summary of lessons learned and thoughts on the future of S&T management. Related Work Science Mapping Studies Various efforts to map the structure of science have been undertaken over the years. Science mapping studies are typically focused at either the macro or micro level. At a macro-level such studies seek to determine the basic structural units of science and their interrelationships (Bassecoulard & Zitt, 1999; Nederhof & van Wijk, 1997). Some macro level studies also allow exploration of the finescale structure underlying the global networks (Small, 1999). However, the majority of science mapping studies are performed at the discipline or domain level (Leydesdorff, 1994; Spasser, 1997; Noyons & van Raan, 1998; McCain, 1998; White & McCain, 1998), and seek to inform science policy and technical decision makers. Studies at both levels probe the dynamic nature of science and the implications of the changes. Alternate approaches with more applied goals (such as S&T management) include textual data mining (Losiewicz, Oard & Kostoff, 2000) and database tomography methods (Kostoff, Eberhart & Toothman 1999), and are usually applied at the discipline level. A variety of databases and methods have been used for these studies. Primary among databases are the Science Citation Indexes (SCI and Social SCI) from the Institute for Scientific Information (ISI), which have gained widespread acceptance for bibliometric studies. Science and technology maps are most often based on computed similarities between journal articles using citation analysis (Small, 1999), or co-occurrence or co-classification using keywords, topics, or classification schemes (Nederhof & van Wijk, 1997; Noyons & van Raan, 1998; Spasser, 1997). Studies to identify intellectual or social networks are performed using author co-citation analysis (White & McCain, 1998; Chen, Paul & O’Keefe, 2001) or on the basis of co-authorship (Newman, 2001). Macro-level maps can be based on journal inter-citation patterns (Bassecoulard & Zitt, 1999; Leydesdorff, 1994; McCain, 1998). Citation and classification based techniques have been used recently to map technology domains based on US patents (Boyack et al., 2000). Latent semantic analysis (Landauer, Foltz & Laham, 1998; Borner, 2000), a memory-intensive text-based process, has also become more prominent as computing resources have increased. Once relationships between objects (articles, terms, authors, etc.) have been defined and a similarity matrix (based on co-citation or co-occurrence, etc.) has been computed, algorithms are used to cluster the data. Common
Visualization Techniques SENTINEL (Fox et al., 1999) is a Harris Corporation package that combines a retrieval engine using n-grams and context vectors for effective query with a visualization system called VisualEyes. The visualization tool allows the user to interact with document clusters in a threedimensional space. Chen (1999) uses a VRML 2.0 viewer in conjunction with Generalized Similarity Analysis to display authors (as spheres) and the corresponding Pathfinder linkage network which has been calculated from an author co-citation analysis. Chen, Paul and O’Keefe (2001) expand this work to provide citation rates as multicolored bars rising out of each sphere in their maps. The CAVE environment at Indiana University is used by Börner (2000) to interface with documents in a virtual library. Documents are clustered using latent semantic analysis. Varying shapes, colors, and labels are used to identify features of each document. Document details are available on demand through a hypertext link. Self-organizing maps have been used in many venues, including the organization of document spaces (Honkela et al, 1998). These maps are used to position documents, and then display them in a two-dimensional contour-map-like display in which color represents density. Peak labels can be generated automatically, and some limited navigational and retrieval capabilities are often provided. Two packages that are more similar to Sandia’s VxInsight are SCI-Map developed by ISI (Small, 1999), and the SPIRE suite of tools that originated at Pacific Northwest National Laboratory (Hetzler et al., 1998; Wise, 1999). SCI-Map uses a hierarchically nested set of maps to display the document space at varying levels of detail. This nesting of maps allows movement between levels. Each map is similar to the traditional circle plot, where the size of the circle can indicate the density of documents contained in the circle, or some measure of importance. Relationships at each discrete level are indicated by links between circles. Like VxInsight, SPIRE maps objects to a twodimensional plane so that related objects are near each other, and provides tools to interact with the data. SPIRE has two visualization approaches. In the Galaxies view, documents are displayed as a scatter plot. This interface allows drilling down to smaller sections of the scatter plot, 2
STEP 1
STEP 2
STEP 3
STEP 4
STEP 5
Figure 1. The process of moving similar items close together and simultaneously pushing dissimilar objects away.
and provides some summarization tools. In the Themescape view, a high-level terrain display, similar to that in VxInsight, is used. Themescape visualizes specific themes as mountains and valleys, where the height of a mountain represents the strength of the theme in the document set.
We compute Dx,y as a density field to which each node contributes. The density field is constructed as the sum of the energy footprints from each node, where the energy footprint is a function of 1/r2 from the node location. Having each node contribute an energy footprint to the density field requires O(N) time. Having each node look up the value of the density field at its current location requires O(N) time. Thus, the overall computational requirement for the density field implementation is still O(N). VxOrd accepts a list of pre-computed similarities and outputs an x,y location for each object. Alternately, it accepts a list of directional edges such as literature citation references and computes similarities based on direct and cocitation linkages (see Small, 1997) prior to calculating an x,y location for each object.
VxInsight Tool The Sandia VxInsight tool consists of two parts – a force-directed placement ordination routine (named VxOrd) and the visualization engine. Ordination routine (VxOrd) VxOrd is used in conjunction with the VxInsight application to calculate the layout of data objects on a 2-D plane using the similarities between the data objects (Davidson, Wylie & Boyack 2001). At the most basic level the VxOrd algorithm tries to place similar objects close together and dissimilar objects far apart. The example shown in Figure 1 demonstrates this basic principle. In VxOrd, the process is achieved by moving the objects randomly around the solution space via a technique similar to ‘simulated annealing’. The criteria for moving a node is the minimization of energy given by:
User environment VxInsight accepts the x,y coordinates generated by VxOrd (or by another clustering routine), and overlays the 2-D plane with a 3-D virtual landscape that looks like a mountain range. This 3-D environment is readily understood because there is only a small cognitive step between seeing the virtual terrain and then exercising our innate human expertise in navigating through real terrains. Given that the ordination algorithm has placed similar objects (e.g., documents) close together, very similar items cluster together and form mountains on the terrain. Related clusters of information occur in mountains that are close to each other. The landscape is displayed ‘on the fly’ with the height of each mountain being proportional to the number of objects beneath it. To explain the nature of the landscape, VxInsight dynamically generates labels for the most significant mountains from metadata associated with the objects, revealing the content of the objects that comprise the mountain. For instance, if article titles are selected as the basis for labeling, VxInsight will display the two most common words found in the titles comprising a mountain as the label for that mountain. The tool supports multiresolution zooming into the terrain to explore interesting regions in greater detail, which reveals structure on multiple scales. Following each mouse click the landscape is recalculated to give a new, higher resolution view of the portion of the terrain that the user wants to view. Data access and retrieval are enabled via an ODBC connection to a location containing metadata related to the
n E x , y = ∑ (wi × li2 ) + D x , y i =0 where Ex,y is the energy of a node with n edges at a specific x, y location, wi is the similarity between that node and the node connected by edge i, li is the Euclidean distance between that node and the node connected by edge i, and Dx,y is a density measure with respect to the area around point x,y. The function Dx,y can be computed in many different ways. A brute force approach is to base Dx,y on the distance to all other nodes. Since each node would have to calculate its distance from each other node, this approach would take N comparisons (where N = number of nodes in the graph) for each determination of Dx,y. All nodes must compute Dx,y when determining their energy at a specific location x,y; thus the algorithm would require O(N2) running time, which for large datasets is computationally expensive.
3
VxInsight was also used to visually present justification for the insights gained from the analyses to those with authority to affect changes in S&T management. Although three different domain analyses are presented here, the process followed to conduct each study was the same. First, relevant and appropriate data were procured, typically by query to a bibliographic database. Second, an object-to-object similarity was calculated. This step can require the use of database functions, statistics, or other mathematical processing depending upon the type of similarity chosen. Third, the data were clustered using the VxOrd algorithm. Fourth, the data were loaded into VxInsight for viewing, navigation, discovery, and analysis.
objects. VxInsight uses the ODBC connection in conjunction with Structured Query Language (SQL) to provide the user with an intuitive and powerful interface. Clicking on an object provides details on demand (Shneiderman, 1996) such as abstract, author, and source information in a portion of the window reserved for those details. Queries can be made (e.g., show all objects where ORG is like SANDIA) using the built-in interface. Objects (e.g. documents) retrieved by the query are highlighted as colored markers on the terrain. The distribution of query markers is very meaningful in the context provided by the terrain with its labeling capability, and provides clues to the analyst for further browsing. VxInsight allows users to spot trends over time by using a time-slider. As the user limits the time field to a few years and then moves the sliding time window back and forth through time, growth and reduction in areas of interest, new emerging areas, and bridged regions that have merged together are revealed. Visual tracking of the location and concentration of colored query markers (corresponding to e.g. different companies of interest) over time using a sliding time window can be used to track the ebb and flow of competitive advantage as represented in literature or patent art. VxInsight can also display directional links between data objects such as citations or web links. When the user selects connections for display, directional links such as citations between objects appear. These links give the analyst detailed information about the structure of the data, and can suggest reasons as to why some objects cluster together while others do not.
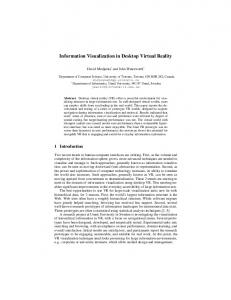
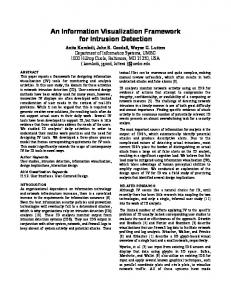
Microsystems domain using citation mapping Sandia has developed expertise in microsystems engineering in recent years as a part of its stockpile stewardship mission, and wanted to survey the field to identify potential collaborators for specific projects. To capture the essence of what comprised the microsystems field at the time and to provide an appropriate seed for data extraction, relevant technical terms were taken from a survey article on microsystems (Picraux & McWhorter, 1998). If a recent and comprehensive review article such as this had not been available, we would have consulted with experts in the field to construct the search term list. Proper input is essential to the technology mapping process. Our list included over 80 terms (including e.g. MEMS, biomimetic, microdevice, microvalve, quantum dot, photonic crystal, etc.) and was used to query titles and keywords from the SCI. A total of 20,923 articles from the years 1990-1999 matched the query terms. Of these, 13,433 articles were connected to at least one other article in the set by citation. The citation list was used in VxOrd to calculate both a similarity measure (using a direct:co-citation ratio of 5:1, see Small, 1997) and the x,y coordinates for each article, resulting in the map shown in Figure 2. The first step in analysis of the microsystems map was to understand the lay of the land. Navigation and query revealed that four main technology categories populated the landscape: quantum dots and wires; nano-scale technologies; micro-technologies (e.g. microsystems, MEMS, and other micro-components); and monolayer technology. Approximately 90% of the articles in the map were directly related to one or more of these four categories. Analysis of trends shown by the microsystems map at a macro-level were identified using the time-sliding function of VxInsight. The landscape view was limited to the articles within a two year period of time. Consecutive two-year periods were viewed, and resulting shifts in the peaks and valleys within the landscape were noted. For example, Figure 3 shows the two-year periods of (a) 199495 and (b) 1998-99. The peak near the top of the landscape has grown in size, indicating more publishing activity in the later years. Additionally, the peak label has changed from ‘GaAs / Self-assembled’ to ‘InAs / Self-assembled’,
Applications Use of any analysis tool typically starts from one of two points. In the first case, one has questions to answer. Here the analysis includes gathering of relevant data and the attempt to find meaningful answers from that data. In the second case, one has data to analyze and understand. This is more often the case with experiments from which data are gathered. We have used VxInsight in both types of situations, but show illustrative examples of only the first type here since our focus in this paper is on competitive intelligence applications of domain analysis. Analysis of genomic microarray data (Davidson, Wylie & Boyack 2001) is an example of the second case, and will not be explored further here. We have performed domain analyses using VxInsight to answer specific questions regarding many different technologies of interest to Sandia National Laboratories over the past few years. Three examples will be given here: 1) mapping of technology using citations from the Science Citation Index (SCI), 2) mapping the domain space of several institutions using the text in abstracts from multiple bibliographic sources, and 3) mapping the structure of the physical sciences using the citation relationships between journals. Each of these analyses had a specific S&T purpose within Sandia and was used to answer specific questions. 4
Figure 2. VxInsight view of the microsystems technology landscape. Articles by Sandia authors are shown as yellow dots on the terrain.
between types of institutions as well. US universities as a whole divided their research nearly equally between the micro-technology, quantum dots and wires, and monolayer areas, and did slightly less work in the nano-technology area. By contrast, US industry was heavily focused on quantum technologies, while US government laboratories focused on quantum and monolayer research. Research by Japanese and European industry was even more heavily focused on quantum technologies than was research at US firms. While nano-technology work was less prevalent than the other three categories, it had a larger overlap with the other categories than any of the other three main categories. A final analysis was done to identify those institutions whose expertise closely matches Sandia’s in specific areas. One way to find these types of synergies is to drill down into small areas within the landscape and follow citation
indicating a shift in the materials used in the quantum dot technology from GaAs to InAs. Query results shown as colored dots over the landscape support this interpretation, and also show a shift from grown (green query results in Figure 3a) to ‘self-assembled’ (blue and yellow query results in Figure 3b) quantum dots. A more detailed analysis was also conducted. Queries were made to identify the institutions doing the most work in the microsystems field. Additional work revealed the number of articles from each institution in each of the four main categories, thus indicating relative areas of focus of various institutions. Example distributions are given in Table 1, along with the number of articles that do not fit into any of the four main categories (i.e. the “Other” column). Accumulation of these results revealed differences
Table 1. Distribution of articles in the four main microsystems-related categories for five institutions. Numbers in the five category columns do not add to the total due to overlaps between the categories. Total MicroNanoQuantum Monolayers Other technologies technologies dots/wires 203 60 25 35 133 6 Harvard Univ. 197 12 23 136 9 34 UCSB 161 37 35 49 40 29 IBM 123 24 19 16 22 51 Sandia 118 53 8 36 14 13 Univ. Michigan 5
a)
b) Figure 3. Detail on microsystems technology landscape. a) the two-year period from 1994-5, b) the two year period from 1998-9. Analysis of the growth, reduction, and shifts in the landscape from the earlier time period to the later time period indicates trends in the technology area. A shift from GaAs to InAs-related work is indicated by the two larger peaks in (b). Dot legend: green – grown + GaAs; red – grown + InAs; yellow – self-assembled + GaAs; blue – self-assembled + InAs.
6
Figure 4. Detailed view of the small portion of the microsystems technology landscape. Arrows indication citation with the cited paper at the arrow tip. Highly cited articles are easily identified as those surrounded by many arrow tips.
designed to show the potential overlaps and areas of differentiation between the three laboratories. The question of which data sources to use also became important for this study. SNL, LANL, and LLNL present work at many conferences and publish many government reports, which are not covered by the SCI. We felt the need to include database sources that would include these types of publications. A second question for this study thus was concerned with whether or not we could effectively produce a technology map from multiple database sources, and if the additional databases would add information in new areas rather than just increasing the depth of coverage in the same areas. Queries were made to five bibliographic databases: SCI, Cambridge Scientific Abstracts (CSA), Engineering Index (EI), INSPEC, and Medline, to extract all articles authored by SNL, LANL, and LLNL during the time period 1997-99. The CSA source was particularly important in that it contains documents from the National Technical Information Service (NTIS), which is where government reports from the three laboratories can be found. A common format was used to combine information from each of the original sources (see Table 2). A total of 26,362 articles were extracted from the five database sources, of which 17,927 were unique. Duplicate articles from the merged data were eliminated by identification of identical (or nearly
links to and from Sandia papers (see Figure 4). This helps identify not only institutions, but specific researchers as potential collaborators, and also shows relevant prior or existing collaborations that have resulted in publication. Analyses such as these where the data comes from the SCI have obvious benefits and limitations. A primary benefit is that the citation structure provides a defensible basis for mapping the structure of science, and lends itself well to detailed analysis. However, the SCI does not provide complete coverage of all literature that may be relevant to a topic of interest. Specifically, it includes few proceedings or conference papers. Inclusion of these types of articles from other sources should provide better coverage of a technology area, and thus allow more accurate answers to questions such as those listed in the introduction. DOE laboratories using text mapping Another area of interest to Sandia is the domain within which it operates as compared to its sister institutions, Los Alamos National Laboratory (LANL) and Lawrence Livermore National Laboratory (LLNL). Every few years the subjects of potential consolidation and duplication of effort seem to arise and must be answered. This study was
7
identical) abstracts. Table 3 shows that the total number of unique articles was more than double the number of articles that were available from the SCI alone. Thus, our goal of obtaining more complete and accurate coverage of the technology domain comprised by the three laboratories was met.
those documents most like the query document based on word frequency, word location, and potential multiple meanings, and returns a list of documents, each with a ranking score. We use this ranking score as our similarity value, and keep the top 10 similarity values for each article for inclusion in the similarity matrix. Ordination was done using the VxOrd clustering algorithm, resulting in the map shown in Figure 5. Analysis of this three-lab landscape was done using a navigation and query process similar to that used on the microsystems landscape. A detailed analysis (not shown here) found that while there are pockets of activity where two or even all three labs publish in the same field or collaborate, there are many more areas that differentiate the three laboratories. For example, although all three labs do materials work, SNL has a differentiating strength in semiconductor materials, LANL publishes heavily on radioactive materials handling and alloys, and LLNL publishes extensively on plasmas. Analysis such as this provided answers to the first question asked of this study. To answer the second question, we queried the map for different types of articles. Noyons, Moed & Luwel (1999) raise the issue that journals and conferences may cover different topics. Our analysis of the three-lab landscape shows that although articles, conference papers, and government publications coexist in much of the map space, there are pockets in the landscape where one type of publication predominates (see Figure 5). This is particularly true near the bottom of the map where there are high concentrations of conference papers and government documents, corresponding to areas such as high-energy physics and work with radioactive substances. Although it may be argued that the DOE laboratories specialize in these areas, and that this example is not generally applicable to all fields, it raises the issue that specialization between journals and conferences may occur in other fields as well. S&T management is made more robust by inclusion of all pertinent sources of information; thus, we recommend that if S&T decisions are to be made using detailed domain analyses as input, multiple bibliographic sources should be included. In addition to mapping domains based on bibliographic sources, we have also used this text mapping process to produce landscapes of Sandia discretionary R&D activities using proposals submitted by individual researchers. Analysis of these data allows Sandia to identify potential collaborations within the company (which are not always obvious within a large research institution), and to track the shift in internal R&D spending in different technical areas from year-to-year. Inclusion of corporate goals and line-ofsight descriptions in the landscape allow management to correlate and align investment with corporate goals.
Table 2. Common format for entries from different bibliographic data sources. Combined INSPEC, EI, SCI CSA Medline Abstract AB AB AB Org IN AF AD Source JN SO SO Year parse from PB PY DP Type DT PT PT Title TI TI TI Author AU AU AU Terms DE DE MH Table 3. Number of articles kept from each data source in combined data set. Source # Articles # Unique % Unique SCI 8318 4542 54.6% CSA 5797 2783 48.0% EI 3812 1055 27.6% INSPEC 8028 3719 46.3% Medline 407 54 13.3% Duplicates 5774 TOTAL 26362 17927 The choice of a data field on which to base similarity is very important, and should be done using a field that has rich and common content across all contributing data sources. Citation structure is not common to all sources and cannot be used. Use of citation structure for similarity calculation is also not suitable for data that cover only a short period of time (e.g. 3 years) due to the very low number of citations within the set. A short list of fields containing content potentially suitable for calculation of similarity includes titles, terms, and abstracts. Titles are often too short to provide any comparative content. Different database vendors assign different sets of descriptive terms to the same or similar articles, making terms a dubious choice for comparison (Qin, 2000).2 Thus, we chose to base similarity on the textual content in abstracts. Calculation of similarity values between article pairs was done using a commercial software package, RetrievalWare 6.6 for Unix, by Convera (formerly Excalibur Technologies). RetrievalWare has a query-byexample search function, which allows the user to use any document (in our case, the abstract) as the query. The software then looks at all other documents in the set, finds
Journal mapping
2
Unpublished studies on similar data drawn from multiple database sources using a co-term similarity and VxOrd clustering show that the articles cluster by bibliographic source rather than by similarities between terms.
One of Sandia’s ongoing efforts is an extensive university collaboration program. This includes not only 8
Figure 5. VxInsight view of the three lab technology landscape from 1997-1999. Dot legend: blue – government documents (primarily from NTIS).
green – journal articles;
orange – conference papers;
to physics as well as to materials and geology. At the macro-level this map has much in common with the physical sciences portion of the map generated by Bassecoulard & Zitt (1999). A close-up view of a cluster in the center of the astrophysics peak (see Figure 6b) shows strong relationships (blue lines) between major journals in that field. It is interesting that Nature appears in this cluster, although it is a multidisciplinary journal. In this map where life sciences are not included, Nature’s strongest links are to well known astrophysics journals. In a map including the life sciences, one might expect links between biology and microbiology journals and Nature to outweigh those from astrophysics. Difficulties associated with clustering multidisciplinary journals have been enumerated by Bassecoulard & Zitt (1999). Sandia has used this map of the physical and engineering sciences to both qualitatively and quantitatively compare the output of other research institutions to ourselves in different disciplines. A query for journals published in by Sandia, and for those published in by e.g. Harvard University, shows the relative emphases placed by each institution in different disciplines. Counting the number of articles by institution in each cluster of journals
specific research collaborations, but also events such as a Dean’s Day, where deans from many engineering schools around the US convene on an annual basis. To promote detailed discussions between Sandia administrative staff and researchers and their counterparts from universities, we have produced a map of the physical sciences based on the 3000 journals (4.7 million articles) in the physical sciences subset of the SCI from 1981-1996. The similarity between journals was defined as (A cites B) + (B cites A) where A and B are any two journals. Normalization, such as that in cosine- or Jaccard-type similarities, was not used. Ignoring normalization naturally provides higher weights to interactions between the larger, more heavily referenced journals, thus producing a map where the large journals form clusters, and the smaller journals agglomerate to the large journals they are most like. Ordination of journals was done using the VxOrd algorithm. The resulting landscape (see Figure 6) shows that Physics occupies a central position relative to other disciplines within the physical sciences. Clusters of engineering, mathematics, computing, and materials science journals all surround physics with strong links to physics journals. Several chemistry disciplines occupy the ridge on the right edge of the map and have strong connections back 9
Figure 6. Landscape of the physical sciences based on the journals in the ISI physical sciences database from 1981-1995. Inset: detail on the Astrophysics cluster from the large map. Strong links between individual journals in the cluster are shown as blue lines.
sub-technologies can be completely overlooked if only one data source is used. • A similarity measure based on common textual material in abstracts works very well on merged databases and produces useful and navigable domain maps. More efficient and precise textual analysis techniques would aid in producing more robust domain maps. In a larger context, visualization tools, such as VxInsight, are becoming crucial to science and technology management in the context of textual data mining, roadmapping, and forecasting. Technical experts have always been, and still are, extremely crucial to this process. Computerized mapping methods may never replace the human analytical capability. The Naval Research Laboratory has sponsored research over many years aimed at using textual sources in their S&T management processing, including roadmapping and the identification of promising technologies. Quoting from Losiewicz, Oard & Kostoff (2000),
allow us to quantify our qualitative observations. Both overlapping emphases and complementary emphases are important information when pursuing strategic partnerships. Conclusions The following general and specific conclusions about the VxInsight tool and analysis environment have been reached as a result of many detailed studies using the tool: • The non-expert who has achieved some proficiency using VxInsight can quickly discover general characteristics in a technology domain. • If a detailed domain analysis of a competitive nature is required, interaction with subject matter experts is essential for proper search term formulation and analysis of the domain map. Interaction with bibliographic data using VxInsight can aid the expert to see trends in technology domains. • Use of a similarity measure based on a common number of descriptive terms does not work well for an article set built from two or more bibliographic sources due to differences in the thesauri and term sets used by the different data vendors. • Data from multiple bibliographic sources provide much better coverage of a technology area than does one source, and can be merged with good success to produce meaningful domain maps. In addition, some
“The FY98 experience showed conclusively that high-quality data mining requires the close involvement of technical domain expert(s) in information retrieval, phrase frequency and proximity analyses, and presentation. Multiple 10
Kostoff, R. N., Eberhart, H. J. & Toothman, D. R. (1999). Hypersonic and supersonic flow roadmaps using bibliometrics and database tomography. Journal of the American Society for Information Science, 50(5), 427-447. Landauer, T. K., Foltz, P. W., & Laham, D. (1998) Introduction to latent semantic analysis. Discourse Processes, 25, 259-284. Leydesdorff, L. (1994). The generation of aggregated journal-journal citation maps on the basis of the CD-ROM version of the Science Citation Index. Scientometrics, 31, 59-84. Losiewicz, P., Oard, D.W. & Kostoff, R.N. (2000), Textual data mining to support science and technology management. Journal of Intelligent Information Systems, 15(2), 99-119, 2000. McCain, K. W. (1998). Neural networks research in context: A longitudinal journal cocitation analysis of an emerging interdisciplinary field. Scientometrics, 41, 389-410. Nederhof, A. J. & Van Wijk, E. (1997). Mapping the social and behavioral sciences world-wide: Use of maps in portfolio analysis of national research efforts. Scientometrics, 40, 273-276. Newman, M.E.J. (2001). Scientific collaboration networks. I. Network construction and fundamental results. Physical Review E, 64, 016131. Noyons, E. C. M. & Van Raan, A. F. J. (1998). Advanced mapping of science and technology. Scientometrics, 41, 61-67. Noyons, E. C. M., Moed, H. F. & Luwel, M. (1999). Combining mapping and citation analysis for evaluative bibliometric purposes: A bibliometric study. Journal of the American Society for Information Science, 50(2), 115-131. Picraux, S. T. & McWhorter, P. J. (1998). The broad sweep of integrated microsystems. IEEE Spectrum, 35(12), 24-33. Qin, J. (2000). Semantic similarities between a keyword database and a controlled vocabulary database: An investigation in the antibiotic resistance literature. Journal of the American Society for Information Science, 51(2), 166-180. Shneiderman, B (1996). The eyes have it: A task by data type taxonomy for information visualizations. In Proc. IEEE Symp. Visual Languages '96 IEEE, 1996. Small, H. (1997). Update on science mapping: Creating large document spaces. Scientometrics, 38, 275-293. Small, H. (1999). Visualizing science by citation mapping. Journal of the American Society for Information Science, 50(9), 799-813. Spasser, M. A. (1997). Mapping the terrain of pharmacy: Co-classification analysis of the International Pharmaceutical Abstracts database. Scientometrics, 39, 77-97. White, H. D. & McCain, K. W. (1998) Visualizing a discipline: An author co-citation analysis of information science, 1972-1995, Journal of the American Society for Information Science, 49(4), 327-355. Wise, J. A. (1999). The ecological approach to text visualization. Journal of the American Society for Information Science, 50(13), 1224-1233.
perspectives are often needed to detect data anomalies … TDM [textual data mining] cannot realize its full potential in S&T management if used only sporadically -- it must become an integral part of the S&T sponsor's business operations. Because of the learning curve, longterm involvement of experts with data mining experience in a particular topic area is desirable.” Development of a long-term capability for S&T management, including roadmapping, and forecasting, while not an easy process, will prove to be increasingly valuable as we proceed in this information and technologyrich age. Visualization will be an integral and essential part of these efforts. Acknowledgements The authors gratefully acknowledge the support of Chuck Meyers and the Laboratory Directed Research and Development Program, Sandia National Laboratories, U.S. Department of Energy, under contract DE-AC0494AL85000. References Bassecoulard, E. & Zitt, M. (1999). Indicators in a research institute: A multi-level classification of scientific journals. Scientometrics, 44, 323245. Beck, D. F., Boyack, K. W., Bray, O. H. & Siemens, W. D. (1999). Landscapes, games, and maps for technology planning. CHEMTECH, 29(6), 8-16. Börner, K. (2000). Visible threads: A smart VR interface to digital libraries. Proceedings of the IST/SPIE 12th Annual Symposium: Electronic Imaging 2000, Visual Data Exploration & Analysis, San Jose, CA, Jan. 2000. Boyack, K. W., Wylie, B. N., Davidson, G. S. & Johnson, D. K. (2000). Analysis of patent databases using VxInsight. Proceedings of New Paradigms in Information Visualization and Manipulation 2000, McLean, VA, November 10, 2000, to be published by ACM. Chen, C. (1999). Visualising semantic spaces and author co-citation networks in digital libraries. Information Processing and Management, 35, 401-420. Chen, C., Paul, R. J. & O’Keefe, B. (2001). Fitting the jigsaw of citation: Information visualization in domain analysis. Journal of the American Society for Information Science and Technology, 52(4), 315-330. Davidson, G. S., Hendrickson, B., Johnson, D. K., Meyers, C. E. & Wylie, B. N. (1998). Knowledge mining with VxInsight: Discovery through interaction. Journal of Intelligent Information Systems, 11, 259-285. Davidson, G. S., Wylie, B. N. & Boyack, K. W. (2001). Cluster stability and the use of noise in interpretation of clustering. Proceedings IEEE Information Visualization 2001, 23-30. Fox, K. L., Frieder, O., Knepper, M. M. & Snowberg, E. J. (1999). SENTINEL: A multiple engine information retrieval and visualization system. Journal of the American Society for Information Science, 50(7), 616-625. Hetzler, B., Whitney, P., Martucci, L., & Thomas, J. (1998). Multi-faceted insight through interoperable visual information analysis paradigms. Proceedings of IEEE Information Visualization ’98, 137-144. Hjorland, B., & Albrechtsen, H. (1995). Toward a new horizon in information science: Domain analysis. Journal of the American Society for Information Science, 46(6), 400-425. Honkela, T., Kaski, S., Kohonen, T. & Lagus, K. (1998). Self-organizing maps of very large document collections: Justification for the WEBSOM method. In I. Balderjahn, R. Mathar & M. Schader (Eds.) Classification, Data Analysis, and Data Highways. Berlin: Springer.
11