�
VISUALIZATION OF INTERPOLATION ACCURACY William Mackaness Kate Beard
[email protected] beard@olympus .umesve .maine.edu NCGIA 348 Boardman Hall University of Maine Orono, Me 04469 ABSTRACT Spatial interpolation is a valuable and now more frequently used function within GIS . A number of data sources for GIS include interpolated values (e.g. DEM's) and a number of the output products from GIS are the results of some form of interpolation. Since interpolated results in,' one way or another play a role in GIS analysis, users can benefit from some assessment of the reliability of interpolated values . The accuracy of an interpolation depends on several factors including : sampling scheme, number of sample points, interpolation method, measurement error in the observed x, y, z values and the nature and complexity of the observed phenomena . Most interpolation methods provide no information on the reliability of the estimated values . Kriging is one exception which produces estimates of values at unrecorded places without bias and with minimum and known variance . Results of kriging reported in the literature typically show kriged values and error estimates as separate isarithmic maps making assessment of the results difficult . This paper describes visualization techniques for examining the reliability of interpolated values . Visual displays are presented which account for the number and distribution of sampling points, the interpolation method, and measurement error in observed values . Additionally, the paper addresses displays for kriged results which combine kriged values and error estimates . INTRODUCTION Ideally a GIS should indicate graphically and numerically the reliability of each analysis . Spatial interpolation defined as a process for estimating values at unsampled locations from a set of sample points should be no exception . Results of an interpolation function are commonly displayed as isolines. Lacking other evidence the assumption is that these isolines and the underlying interpolated values are uniformly reliable over the interpolated area. If we have knowledge that this is not the case, then the differential uncertainty in the results should be communicated . Users should be able to ascertain which areas are least reliable and where possible be provided with information to understand why these values are less reliable. Interpretations of reliability may utilize 'several imaging functions to display the data in different ways and to provide complementary information' (Farrell,1987,175) . With respect to interpolation, one can envisage a progression of graphical representations to convey variability and reliability in the resulting values . At the simplest level, graphical representation of the location of sample points provides clues to spatial variation in the reliability of interpolated values. Regions of sparse data are unlikely to produce 228
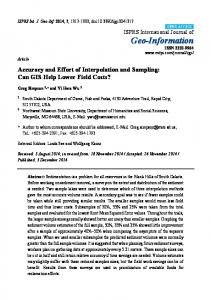
accurate interpolations irrespective of technique. Indeed several interpolation methods depend substantially on the selection of appropriate neighbors (Gold 1989). Thus conveying the spatial distribution of measured points is an important indicator of reliability. Traditionally interpolation functions have treated sample points as having uniform positional accuracy and uniformly accurate z values . Simple displays of sample point locations can be extended through symbology to indicate variation in positonal or attribute accuracy of the sampled points . The information on positional and attribute accuracy can arise through adjustment analysis (e .g . the creation of error ellipses - Hintz and Onsrud 1990), or through comparison of data collected using different technology or degrees of accuracy . Finally, display may be designed to communicate information on the actual interpolation method . The various interpolation methods themselves can generate varying patterns of reliability in the results. Interpolation methods (see reviews by Lam 1983, Burrough 1986, Ripley 1981) produce different spatial patterns of reliability through their underlying assumptions and parameters . The next sections of the paper presents a suite of displays to communicate the quality of interpolations across the different levels just summarized . DISPLAYS OF SAMPLED POINTS Since the number and distribution of sampling points contribute substantially to the interpolation outcome, a simple but effective visual assessment tool is a capability to toggle on and off the sample point locations (see Figure 1) .
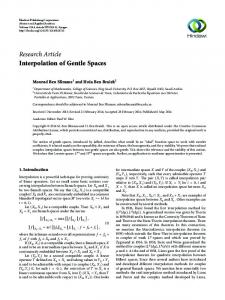
Figure 1. Sample points locations displayed with isolines . As an extension to this display, points may be classified and color coded by their Z values ., A similar color coding of isolines can then clearly indicate deviations from measured values as well as indicate the areas of sparse data . Figure 2 illustrates such a display using gray values .
35 30 25 20 15
5 0
0
5
10
15 .
20
25
30
35
Figure 2. Gray scale version of sample points values displayed with isolines .
When data sets of mixed heritage are combined to form the point set for interpolation, displays may be designed to document variations in accuracy among these points . For example, water quality samples taken over a ten year time period may have different accuracies due to the sampling technique, laboratory quality control procedures, instrument calibration or other factors . In this case the sample points may be color coded or otherwise symbolized by an accuracy measure . From this sort of display, spatial clusters of sample points with lower accuracies may be identified and hence locations where interpolated results may be- less reliable. Variation in the positional certainty of sample points may be displayed in a similar fashion . DISPLAYS OF INTERPOLATION METHOD RELIABILITY A variety of interpolation methods have been documented in the literature. By understanding the behavior of these methods or through the actual computation of these methods, error estimates may be generated and subsequently displayed . Table 1 extracted from Burrough (1986) summarizes these methods . Method
DeterministiclStochastic
Proximal Trend surface Fourier Series B-splines Moving average Optimal (kriging)
deterministic stochastic stochastic deterministic deterministic stochastic
Local/Global global global global local local local
Exact Interpolator no no no yes no yes
Table 1 Interpolation methods summarized from Burrough 1986 .
Visual displays which illustrate the spatial reliability of interpolated results are developed for two of these methods: weighted moving average and kriging. WEIGHTED MOVING AVERAGE This method uses a set of data points in proximity to an interpolation location and performs an averaging process. The averaging process includes weights proportional to the distance of the data point from the estimation point. The important parameters which need to be specified for this method are the size of the neighborhood and the appropriate weighting function . Both of these factors can have significant effects on interpolation results . The other important factor is the distribution of sample points with respect to the estimation point as results are very sensitive to clustering in the sample points . (Ripley 1981). One visualization method can not capture all these influences, but a technique which captures the distance factor is displayed in Figure 3. In this figure, distances were computed from sampling points and displayed as a gray shade image. When displayed as a backdrop to isolines, darker areas indicate areas which may be less reliable .
Figure 3. Shading is based on a distance function computed from sample points . Moving weighted average interpolated values in darker areas are less reliable .
KRIGING There are numerous papers that cover the topic of kriging in various levels of detail (for example Oliver and Webster 1986, Dunlap and Spinazola 1984 ; Doctor 1979; Cressie and Hawkins 1980; Bridges 1985 ; Ripley 1981 ; McBratney and Webster 1986 ; Royle et al. 1981). Kriging is an interpolation technique that generates an estimated surface from a regular or irregular set of points . The principle advantage of Kriging over the many other interpolation techniques in existence is that it provides an indication of the error associated with interpolated values and is the only method that uses statistical theory to optimize the interpolation (Clarke 1990). Kriging has been successfully used in the spatial prediction of soil properties (Burgess and Webster 1980), mineral resources, aquifer interpolation (Doctor 1979; Dunlap and Spinazola 1984), soil salinity through interpolation of electrical conductivity measurements (Oliver and Webster 1990), meteorology and forestry .
Deterministic models assume that we know a great deal about the behavior of the variable which is rarely the case in the geographical sciences . In contrast to deterministic models, Kriging makes no attempt to describe the physical mechanism of the underlying phenomenon . The advantage of Kriging over polynomial fitting procedures (such as Trend Surface Analysis- TSA) is that Kriging uses a correlation structure among the observations and is more stable over sparsely sampled areas whereas estimates in TSA are greatly affected by the location of data points and can produce extreme fluctuations in sparse areas . Kriging is based on the regionalized variable theory (Matheron 1971) that accounts for spatial variation in three parts : an underlying structure, a random but spatially correlated component and noise . The regionalized variable theory assumes the spatial variation in the phenomenon represented by the z value is statistically homogenous throughout the surface - the same pattern of variation can be observed across the entire surface . Thus datasets known to have pits and spikes or abrupt changes are not appropriate for use with Kriging .
Kriging requires a number of steps ; first the underlying structure is estimated using the semi-variogram. THE SEMI-VARIOGRAM Kriging requires that we first compute the semi-variogram, and this is then used to determine the weights and search extent when predicting a value at an unrecorded place . The semi-variogram provides information of the form of the relationship between two observations as a function of intervening distance . The semi-variogram is a graph of the variability of the difference of the regionalized data versus distance between points (known as the lag) . The semi-variogram is approximated from the given set of measured values of a regionalized variable . A variety of functions can be used to model the semi variance and there are a number of theoretical semi-variograms (for discussion see McBratney and Webster 1986) . The three most commonly used are the linear, spherical and exponential models . The regionalized variable is isotropic when the semi-variograms is a function only of distance between data points . To determine whether there is any appreciable change in variance with direction, it is common to generate and compare the variograms of two and sometimes eight cardinal directions . Thus kriging is an exploratory technique requiring some experimentation . As McBratney and Webster observe, 'choosing an appropriate semi-variogram is still something of a mystery' (McBratney and Webster 1986, 618) selecting an appropriate model requires some trial and error and thus requires a good understanding of the ontology of the phenomenon under interpolation . DISPLAYING KRIGING ERRORS OF ESTIMATE Kriging gives a variance estimate at each interpolated point (called kriging error or errors of estimate) . They define confidence intervals about the interpolated points if the errors are assumed to be normally distributed, and kriging errors tend to be greatest in areas of sparse data. Generating the error of estimates helps identify areas in need of further sampling and can thus
� �
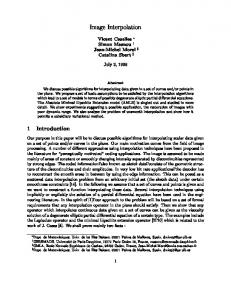
improve the quality of sampling in a very specific way (Wright 1983; Keith 1988) . In the following figures error estimates are generated from a series of seismic profiles recorded from a ship within the Gulf of Maine in the Casco Bay area (Kelley et al . 1987) . The z values were digitized from these seismic profiles; three 'layers' were identified - the bedrock, the Holocene and the glaciomarine. In processing the data, the first stage was to find the semi variogram model that best fit the data. The exponential model was found to be the best fit for bedrock and Holocene layers, and Gaussian for the Glaciomarine . Figure 4 shows two semi-variograms; the Gaussian semi variogram for Glaciomarine and Exponential for the bedrock and island data set (both generated using Arc/Info ). semi-variance
Distance 500
1000 1500 2000 2500 3000
0
Distance
I 0
1000
2000
3000
4000
Figure 4. Experimenting tofind the best model of the semi-variogram . The variogram was used to generate a regular matrix of both the interpolated values and the error estimates associated with each value (using SpyGlass Transform*). A contour module within Transform generated the isopleth maps and a inverted greyscale was used to create the variance map. In this map, light areas are regions of low variance and dark patches are conversely high . The estimation variance, when overlayed with the resulting contours (as in Figure 5) reveals areas of poor control and is an important factor in the rejection of unreliable edge points . This display assimilates both variables, and has the advantage that the dark regions conceal from view those areas for which the interpolated values are less reliable .
Mention of software products is not an endorsement of their use. 233
0.10 0.20 0 .30 0 .40 Figure 5. Contour map of Bedrock and Island bathymetry with variance values overlayed in. greyscale .
Though the variance matrix can be toggled off so as to reveal the results in areas of high variance, an alternative approach is to combine the two variables such that the error of estimates is conveyed either through line fill pattern or thickness of line . Thus the isolines themselves carry the information on reliability. This approach is illustrated in Figure 6 . This method summarizes the results of kriging from Oliver and Webster (1990) . In this figure the lighter fuzzier portions of the isolines correspond to areas with higher error estimates . Using either method it is possible to incorporate additional information on the map .
0.049 - 0.03
0 .029 - 0.02 j~ 0.019 - 0.01
Figure 6. Combining semi variance value with kriged values through the use of line
shading .
CONCLUSION The integrity and general worth of any type of analysis is dependent on several factors . These include the quality of first abstraction (sampling regime, resolution of sampling), data manipulation prior to storage, subsequent abstraction (for example digitizing or subsampling), techniques used in the analysis (and degree with which parametric requirements are met), recording of error and subsequent visualization of each of these steps. Thus the concept of 'quality' pervades the entire research design and an overall picture requires knowledge of error and potential variation associated with each stage of processing . This paper has focused on one component of the 'quality chain', namely degree of certainty associated with interpolation . This paper has illustrated a sampling of techniques that in combination may be used to display the reliability of interpolated values. The methods range from displaying sample point locations, values, and accuracy, to ; displaying the variation in reliability which is produced as a function of the interpolation method itself. Kriging has the advantage of generating error estimates as the result of the process. However, few tools have been available to view the interpolated values in combination with the error estimates. Two techniques are illustrated to view estimated values and their reliability simultaneously . This represents a small sample of possibilities, yet examples which could be easily incorporated within systems to assist users in their decision making .
�
ACKNOWLEDGMENT Both authors are grateful for support from the NSF for the NCGIA under grant No . SES 88-10917. Our thanks to Lori Dolby for her analysis and comment. REFERENCES
Bridges, N.J. 1985 . Kriging: An interactive program to determine the best linear unbiased estimation . US Dept. of Interior, Geological Survey . Burgess, T.M. and R. Webster. 1980 . Optimal interpolation and isarithmic mapping of soil properties II. Block Kriging. Tournal of Soil Science Vol. 31, pp . 333. Burrough, P. A. 1986 . Principles of Geographical Information Systems for Land Resources Assessment, (Monographs on Soil and Resources Survey No . 12), Oxford University Press, New York . Clarke, K. C. 1990 . Analytical and Computer Cartography. Englewood Cliffs, New Jersey : Prentice Hall . Cressie, N. and D.M . Hawkins. 1980 . Robust estimation of the variogram I. Mathematical Geology Vol. 12, pp . 115. Deutsch C.V. and Journel A.G . 1992 . GSLIB Geostatistical Software Library and Users Guide New York:Oxford University Press . Doctor, P .G . 1979. An Evaluation of Kriging Techniques for High Level Radioactive Waste Repository Site Characterization. Pacific Northwest Lab, Richland, Washington 99352: Dunlap, L.E . and J.M . Spinazola. 1984 . Interpolating Water Table Altitudes in West-Central Kansas Using Kriging Techniques . United States Gov Printing Office Washington . Farrell, E.J . 1987 . Visual Interpretation of complex data IBM Systems Tournal Vol. 26, No . 2, pp. 174 - 199. Gold C.M . 1989. Surface Interpolation, Spatial Adjacency and GIS in J. Raper(ed) Three Dimensional Applications in Geo jaaphical Information Systems. London: Taylor and Francis. pp . 21-36. , Haining, R. 1990 . Spatial data analysis in the social and environmental sciences Cambridge: Cambridge University Press. Hintz, R.J . and H.J . Onsrud. 1990 .Upgrading Real Property Boundary Information in a GIS URISA Journal Vol. 2, No . 1, pp. 2-10 . Isaaks, E.H . and Srivastava, R.M . 1989 . An introduction to Applied Geostatistics New York :Oxford University Press.
Lam, N. S. 1983. Spatial Interpolation Methods : a Review. American Cartogrpaher . 10 . 129-49 . Keith L.H. 1988 . Principles of Environmental Sampling ACS Professional Reference Book, American Chemical Society. Kelley, J.T ., Belknap, D.F., and Shipp, R.C . 1987 . Geomorphology and Sedimentary Framework of the Inner Continental Shelf of South Central Maine . Department of Conversation . Maine Geological Survey, Open File Report No . 87-19. Krige, D.G . 1966 . Two dimensional weighted moving average trend surfaces for ore-evaluation Tournal of the South African Institution of Mining and Metallurgy Vol. 66, pp. 13 - 38. Leenaers, H., P.A. Burrough and J.P . Okx. 1989 Efficient mapping of heavy metal pollution on floodplains by co-kriging from elevation data . in J. Raper(ed) Three Dimensional Applications in Geographical Information Systems. London: Taylor and Francis. pp . 37-51 . Matheron G. 1971 . The Theory of Regionalized Variables Les Cahiers du Centre de Morphologie Mathematique de Fontainbleu 5, pp . 1-210. Ecole Nationale Superieure des Mines de Paris. McBratney, A. B., and Webster, R. 1986 . Choosing Functions for Semi variograms of soil properties and fitting them to sampling estimates. Journal of Soil Science, vol. 37, pp . 617-639. Olea, R. (ed) Geostatistical Glossary and Multilingual Dictionary . Oxford University Press New York . Oliver, M.A . and R. Webster. 1986 . Combining nested and linear sampling for determining the scale and form of spatial variation of regionalised variables. Geographical Analysis Vol. 18, pp . 227. Oliver, M.A. and R. Webster. 1990 . Kriging: A method of interpolation for geographic Information systems. International Tournal of Geographic Information Systems Vol. 4, No . 3, pp . 313 - 332. Ripley B. D. 1981 Spatial Statistics New York: John Wiley Royle, A. G.,Clausen, F. L., and Frederiksen, P. 1981 . Practical Universal Kriging and Automatic Contouring. Geoprocessing, Vol. 1, pp . 377-394. Wright T. 1983 . Statistical Methods and the Improvement of Data Qualim Academic Press, Orlando Florida.