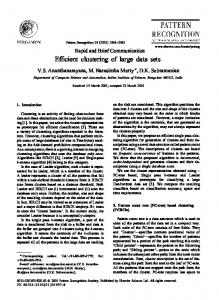
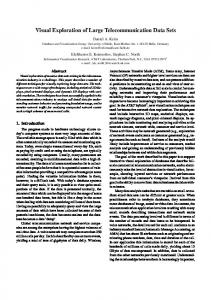
Visualization of Large Data Sets: The Zoom Star Solution M. Noirhomme-Fraiture Institut d’Informatique, University of Namur 21 rue Grandgagnage 5000, Namur, Belgium Tel: 32-81-724979 E-mail:
[email protected]
ABSTRACT Progress in Knowledge Discovery in Large Databases has raised the necessity of visualizing sets of data on aggregated form. These sets can be given as native data or as results of preliminary analysis. Symbolic data analysis has been developed to solve the problem of the analysis of data known on an aggregated form, i.e. where quantitative variables are given by intervals and where categorical variables are given by histograms. These data are called symbolic objects. In this paper, we present several methods and software dedicated to the visualization of symbolic objects. They use radial graphs. They can be represented in 2D (Zoom Star, Simple Star) or in 3D (3DZoom Star, Temporal Star). Each picture concerns only one set of individuals on aggregated form, but several objects can be compared when representing them side by side or superimposed. It is also possible to visualize the evolution of an object varying with time. Sound has been used to represent particular characteristics. The visualization modules have been developed thanks to different European IST projects. KEYWORDS: Data Visualization, Data Mining, Data Analysis, Sound, Radial Graphs
1
INTRODUCTION
The progresses in technology of the last decades have increased rapidly our ability to collect and record data. It concerns, in particular, computer memory, computer speed and communication speed. Industries and market companies have seen their databases and data warehouses increased tremendously. In the National Statistical Institution, technological means have allowed the analysis of more numerous and more complex data. In addition, popular use of the World Wide Web as a global information system has flooded us with a huge amount of data and information [8]. Therefore, this phenomenon has generated « an urgent need for new techniques and automated tools that can intelligently assist us in transforming the large amount of data into useful information and knowledge ». Data Mining also called Knowledge Discovery in Databases (KDD) has this as its objective. It is a multidisciplinary field, at the crossroads of data analysis, database technology, machine learning and data visualisation.
The Electronic Journal of SYMBOLIC DATA ANALYSIS – Vol.0 N. 0 (2002).
1
In this paper, we are more concerned by the latter domain, namely data visualisation, but as we will see, this cannot be separated from methodological approach, due principally to the size of data.
2
CLASSICAL DATA VISUALIZATION
Several taxonomies and surveys have been proposed for data visualization [e.g., 5, 7, 11, and 19]. Surveys usually distinguish the methods from the techniques used for visualization: geometric techniques (scatter plots, parallel coordinates, line graphs, polar charts), icon-based displays (Chernoff faces, stick figures, color icons), pixel techniques (recursive pattern, spiral technique), Kohonen maps, distortion techniques (perspective wall, Table Lens [17], Fisheye views), hierarchical (TreeMaps [18], infocubes, cone trees) or graph-based techniques. The latter techniques concern the visualization of the structure of the data set (hierarchy, graph) whereas the first ones allow the visualisation of the data values. When we consider statistical data visualization, we are talking most often about the representation of multidimensional (high-dimension) quantitative or categorical data. More specifically, we consider individuals for which we know the value of variables or attributes which can be quantitative (represented by a floating or an integer number) or categorical. A categorical variable is described by several categories, each individual belonging to one category. Some methods are more suited to the visualisation of high-dimensional data [9]. Some are dedicated exclusively to quantitative data, others to categorical data. Some methods allow the representation of temporal data (line graphs, pixel techniques), uni or multidimensional data [e.g., 4 and 11]. All the methods usually allow the representation of individual data only i.e. that for each individual and each attribute we have only one data.
3
MOTIVATION AND RELATED WORK
One way to reduce the size of information in a data mining context is to summarise it in concepts and to build meaningful sets of individuals. Sets can be « native » in the sense that they have a meaning for the users: a town, a geographical region, a statistical unit, a family. Native sets can be justified in Official Statistics by the fact that they must guarantee anonymity. Thus, data have to be aggregated before being analysed. In an exploratory process, it is very important to visualise a priori given sets, on an aggregated form as concepts or statistical units. Visual analysis allows the discover of overall trends but also smaller hidden patterns. Sets can also be derived by analytical methods. For example, clustering methods produce sets of individuals or « nodes » which are, as far as possible, homogeneous with regards to a given criteria and as different as possible among them. Visualization methods are necessary for a better understanding of these results. Methods such as clustering, bayesian decision tree, divisive or hierarchical classification, unsupervised neural networks give, as final results, groups of individuals. Many visualization means are used to represent the structure between the nodes. This structure is generally a hierarchy or , in some cases, a graph. Let us remind as examples of representation trees, cone trees, hyperbolic trees. In addition, it is of particular interest to give the characteristics of the nodes. As they usually contain a large number of indiThe Electronic Journal of SYMBOLIC DATA ANALYSIS – Vol.0 N. 0 (2002).
2
viduals, it is neither possible nor meaningful to represent a node in extension, i.e. by the individuals contained in it. We need, therefore, tools to represent sets of individuals described by quantitative or categorical variables, on an aggregated form: intervals or proportions. It is usually necessary to be able to compare nodes with each other. It is also useful to see the evolution of nodes in terms of time and thus to compare them in a serial context. As we have seen in the preceding paragraph, there are many methods of representing a set of individuals depending on several variables. For example, in 2 or 3 dimensions, we can use Venn diagrams. But very few allow the representation of aggregated data, namely sets known by intervals or proportions rather than individual characteristics. When sets have to be considered and if the variables are quantitative, individual values are aggregated in the mean so that individuals are replaced by the centre of the set. In this way, we lose all the information regarding the extent.
4
SYMBOLIC DATA ANALYSIS
Symbolic data analysis has been introduced in order to solve the problem of the analysis of data given on an aggregated form, different from a central point [3]. A table of Symbolic data can be seen as a table of data where the lines are the sets of individuals called “symbolic objects” and where the columns are the variables. The values of the cells are intervals if the variable is quantitative or a frequency distribution if the variable is categorical. Figure1
Figure 1: Table of symbolic data - variables concerning housing in different regions of UK.
The Electronic Journal of SYMBOLIC DATA ANALYSIS – Vol.0 N. 0 (2002).
3
represents such a table, where objects are regions of the UK and variables concern characteristics of housing: accommodation type, number of years living at the address, number of bathrooms, bedrooms, living rooms, garages, kitchens etc. as well as “any other house”. The methods and software described in this paper were developed within the frame work of symbolic data analysis, but they can also be used to represent other sets produced by classical methods.
5
THE ZOOM STAR REPRESENTATION
Zoom Star is used to represent a symbolic object, i.e. visualising a line of the table shown in figure 1 [16]. It is a radial graph where each axis represents a variable. It can be considered as an iconic technique, because the shape of the representation identifies the object. It can also be considered as a geometrical technique, like a Kiviat graph or parallel coordinates [9] because, when the variables are quantitative, geometrical properties can be used to derive information [14].The difference with glyphs, Kiviat graphs or parallel coordinates is that, here, we represent on the axis interval if the variable is quantitative or categories and frequencies if the variable is categorical. 5.1 The 2D Zoom Star This representation is a Zoom Star visualization in the plane. The example of figure 2 represents the first object of the table in figure 1: Northern metropolitan. On the axes representing categorical variables, the dots diameters are proportional to the frequency of the concerned category for the object. In order to give some shape, some points are joined. We have chosen the limits of the intervals if the variable is quantitative or the category with highest proportion if the variable is categorical. Interval surfaces are coloured. It is possible to display the histogram associated with a categorical variable interactively when selecting the axis with the mouse. In figure 2, we have selected the variable «bedroom».
Figure 2: 2D Zoom Star representation for Northern metropolitan region.
2D Zoom Star is very useful for comparing different symbolic objects, displaying the stars side by side (Figure 3) or on the same graph, using superimposition, different colours and transparency (Figure 4). The Electronic Journal of SYMBOLIC DATA ANALYSIS – Vol.0 N. 0 (2002).
4
Figure 3 allows to see differences between Wales II and Scotland IV regions.
Figure 3: 2D Zoom Star representation for Wales II and Scotland IV regions.
Figure 4 represents the value of 8 stocks for three different weeks. It allows the analysis of the evolution of stocks in a portfolio, according to time.
Figure 4: Example of superposition of stars. 8 stocks value for three different weeks.
The Electronic Journal of SYMBOLIC DATA ANALYSIS – Vol.0 N. 0 (2002).
5
5.2 The 3D Zoom Star In this version, the plane of the star is seen in 3D and the histograms associated with categorical variables are represented directly on the axes (Figure 5). It is possible to turn the figure in order to find the best angle of view .3D Zoom Star can also be displayed side by side.
Figure 5: 3D Zoom Star representation for Northern metropolitan region.
5.3 Temporal Star This representation has been used to visualize a symbolic object varying with time. The 3D Zoom Stars visualizing an object at different epochs are thread on a central axis representing time. The graph can be zoomed, moved, rotated around the time axis (Figure 6). To emphasize the evolution from one epoch to another, the external (or internal) extremities of intervals can be joined, making an external (or internal) transparent veil (figure 7). Figures 6 and 7 represent the value of 8 stocks of the same portfolio varying over 8 weeks.
Figure 6: Temporal star representation for stocks value during 8 consecutive weeks.
The Electronic Journal of SYMBOLIC DATA ANALYSIS – Vol.0 N. 0 (2002).
6
Figure 7: Temporal Star representation. The evolution is underlined by a veil.
5.4 Simple Star: Animation in 2D Zoom Star To show the variation of sets according to time, animation can also be used. When superimposing 2D Stars varying with time (as in figure 4), we obtain an animated effect showing the evolution of the object. Different colours are used to emphasize the process.
6
USE OF SOUND
Sound can give information, which is not readily seen on the graph. For example, it can be used to point out objects, which are abnormal, the evolution of particular variables, dissimilarities between objects. Different choices are possible when designing sound for visual interface. Here, we have used musical acoustic “earcons”. We asked a musician to create small pieces of harmonious sound, with meaningful impression, and we recorded the sound files. They are called when selecting parts of the graph with the mouse. Different kinds of sound are available. Figure 8 represents a panel for the choice of “earcons”.
The Electronic Journal of SYMBOLIC DATA ANALYSIS – Vol.0 N. 0 (2002).
7
Figure 8: Panel for the choice of earcons.
7
INTERACTIVITY
The user is provided with several means of interactivity. They concern standard visualization features such as zoom, rotation of figures and setting of colour and fonts. We have also developed interactivity specifically to statistical software such as the change of scale for axes dedicated to quantitative variables and for histograms, the change of labels for variables and objects, the selection of variables and of objects, the change of order of the variables and categories, the modification of a cell value. It is also possible to lock the figures representing different objects, in order to move them together or to propagate modifications to all the figures. The figures can be seen side by side in SODAS and ASSO software. ISO-3D is more focused on superimposition and animation. The software allows the user to switch easily from one view to another. From our experience, 2D Stars are preferred when mostly quantitative variables are used and 3D stars when mostly categorical variables appear, but this rule is not universal. It depends very much on the user. What we find more important is the ease with which one can go from one representation to the other. We feel that it is very important to offer several views of the same data in order to improve exploration and to derive all the relevant properties. Some characteristics are better highlighted on one kind of representation, some others on another kind.
8
IMPLEMENTATION
2D and 3D Zoom Stars have been implemented within the SOE module of the SODAS project. SODAS was a three years ESPRIT project (96 - 98) sponsored by the ECC. The resulting software is dedicated to symbolic data analysis and the target users are Official Statistical Institutes and Eurostat. The software works with data in a proprietary format. The SOE module is programmed in Visual C++. It allows the user to switch very easily from table view to 2D or 3D representation. Facilities to modify scales, labels, fonts, order of variables and categories are offered. Figure 9 presents the bar menu of SOE module, with a
The Electronic Journal of SYMBOLIC DATA ANALYSIS – Vol.0 N. 0 (2002).
8
Figure 9: Display in SOE.
window describing categories of accommodation type variable. It is possible to modify the values of a cell like in Excel. Temporal Star and Simple Star with animation and sound have been developed within another ECC project (99 - 2000), the ISO-3D project. This was dedicated more specifically to the mining of data varying with time and the target users were banks and companies. Other types of representation were developed by other partners and are included in the resulting software. They concern modules such as 3D Graphs, 3D Cubes and hyperbolic hierarchies. The modules have been developed in Java, OpenInventor, 3D MasterSuite and Java Media Framework. OpenInventor is a 3D graphic API using OpenGL standard. 3D MasterSuite extends and includes OpenInventor and high level 3D graphic classes. These products are distributed by the TGS company. Pre-recorded sound sequences of type WAV and MIDI are supported. This type of file has been chosen because we needed musical acoustic «earcons». ISO-3D software uses the InfoBus technology to allow communication between the different modules. Thus, very easily, we can select a particular object in Temporal Star and visualize it as a 3D Zoom Star or as a 2D Zoom Star (Simple Star). It is also possible to select a node or a cube in another representation such as hyperbolic hierarchy or 3D Cube and to visualize the corresponding set in a star representation. The Electronic Journal of SYMBOLIC DATA ANALYSIS – Vol.0 N. 0 (2002).
9
Figure 10 represents the Temporal Star screen, with bar menu and menu concerning graphic facilities.
Figure 10: Display in Temporal Star.
9
EVALUATION
2D and 3D Zoom Stars were first tested with success by students, researchers and the project partners [15]. The software was improved and disseminated within the official statistical community. SOE has been used for three years and has been well received. Zoom Stars are frequently used by researchers or statisticians when they want to publish results of standard analysis or of new symbolic classification methods. A recent evaluation carried out by users at the starting point of a new European project has shown an interest for the method and software and has suggested new improvements [12]. In particular, one underestimated aspect was the need to publish results and, thus, to include pictures within a report and to print them. This needs picture formats compatible with edition software such as PowerPoint or Word. The Electronic Journal of SYMBOLIC DATA ANALYSIS – Vol.0 N. 0 (2002).
10
Temporal Star and Simple Star have been evaluated by users at the end of ISO-3D project, but, due to the short time-scale (it was a two-year project), the evaluation was not sufficiently detailed and could only show the interest of the global software [1]. Students in computer science carried out a more detailed evaluation. They identified several bugs and some misconceptions of ergonomics. Most of them preferred the Temporal Star visualization, probably because they are more attracted by new techniques [1]. Concerning the use of sound in statistics, the results are not very convincing up to now. Many technical difficulties were met in the implementation and in the loading of the prototype. Moreover, the statisticians are not volunteer to use sound in their work. Items, which had to be represented, were also probably not well suited to this medium.
10 EXAMPLES OF USE 2D and 3D Zoom Stars have been used in many occasions by partners. Among others, let us note Professional careers of retired working persons The data base contains data on all completed professional careers of persons having worked in Luxembourg and retiring within 1991. Each individual career is described by 85 classic statistical variables (gender, pension fund, monthly pension, activity sector, 40 yearly salaries, etc).Not all information is relevant. Several analysis were performed: - A first divisive clustering analysis allows building sets of individuals that can be considered as homogeneous. Each cluster is described by intervals on some variables. The Author has visualized the resulting objects using 3D Zoom Star [2]. - Noticing three possible retiring scenarios, he has performed an discriminant analysis in order to predict scenario from the other variables. He can, then, visualize the scenarios with the most predictive variables. - In an exploration phase, if we represent the objects corresponding to activity sectors, we can clearly see different strategies depending on the activity sector. Comparing European Labour Force Survey results from the Basque Country and Portugal The data consist of statistical results from the quarterly Portuguese and Basque Labour Force Survey (LFS), a total of 56 049 records describing individual persons [10]. 17 variables of interest have been selected. Native symbolic objects have been build, aggregating results by geographical regions. The 3D Zoom Stars allow comparing the different regions. Authors have also compared special groups of interest (woman/single/25-34 years old/in different regions) using 2D Zoom Stars. Profiles are rather different. Especifidades Regionais do Emprego em Portugal The paper wants to show the regional specificities in labour force in Portugal. It analyses a survey on 21 197 individuals for which social and labour variables have been recorded: gender, family, principal activity, principal profession, complete or partial work, work timetable, etc. A first exploratory analysis, grouping the data by region and visualizing the objects The Electronic Journal of SYMBOLIC DATA ANALYSIS – Vol.0 N. 0 (2002).
11
through 2D Zoom Star, highlights strong differences. The analysis is, then, refined through principal component analysis and divisive clustering. Quality Control on Statistical Production [13] In continuous survey like LFS, statisticians usually design quarterly surveys. At each period, samples are the same as in the preceding one except the first one in the list which is replaced by a new sample. This technique is called rotation. It is important to verify that the individuals that leave out a certain quarter are not significantly different from those that enter the new rotation. The authors, using the case of LFS with 22 000 households representing about 45 000 individuals and a rotation in six waves, present a method to compare samples. They use 3D Zoom Star for the visualization of quarter samples. Other methods, like Factorial Discriminant Analysis, confirm the results obtained by visualization.
11 ONGOING AND FUTURE WORK We are now involved in a new project with the same partners as in SODAS. It gives us the opportunity to improve the 2D/3D Zoom Stars, following user requests. We also want to add a «breakdown» facility, allowing the selection of an object subset through the graphical representation and its visualization. If, for example, we are more interested by the accommodation type “dwelling with business” (see figure 2), we could click on the corresponding point of the axes “accommodation ty”. The software will automatically select in the data base all the households which correspond to this characteristic, build the new symbolic object and display it on star shape. If it is superimposed on the original star, we can easily see differences between both objects. Other work will involve a deeper evaluation of Temporal Star with users from industry or management. We are also continuing our work on the use of sound for representing data. The use of PDA (Personal Digital Assistant) seems more pertinent for this media. We intend to couple musical sound and speech synthesis.
12 CONCLUSION In knowledge extraction from large data bases, it is often necessary to work on aggregated data in order either to reduce the number of data or to preserve anonymity like in official statistics. Visualising means for such kind of data are rather seldom. We have presented different means for visualising such aggregated data called also “symbolic objects”. Our displays are based on graphs of radial type. They can be stars in 2D or 3D. We have provided ‘Temporal Star” in order to visualise the evolution of an object according to time. We can also use animation and sound. The visualization means have been developed inside two IST European projects, SODAS and ISO-3D. The first software has been tested in details and our module has been proved very useful and usable. Presently, we carry on new improvements and ideas inside a new IST project.
The Electronic Journal of SYMBOLIC DATA ANALYSIS – Vol.0 N. 0 (2002).
12
13 ACKNOWLEDGEMENT We thank the researchers, M. Rouard and A. Nahimana, who worked on the development of the modules, as well as our colleague, A. de Baenst, for her advices. We are also grateful to our partners in SODAS, ISO-3D and ASSO projects for their suggestions and evaluation. Partners in the projects are : - In SODAS and ASSO: INRIA, CRP-GL Luxembourg; the universities of Paris Dauphine, Naples, Aachen, Madrid, Athens, Porto; the National Statistic Institutes of Finland, Basque Country, Portugal; the companies Thomson CMF, CISIA, TES, EDF; Math Department of the University of Namur. - In ISO-3D: the companies MATRA, CISIA, ING bank, TGS, the universities of Paris Dauphine, Naples and Ljubljana. We thank the ECC for having sponsored our work.
REFERENCES [1] [2] [3] [4] [5] [6]
[7] [8] [9] [10] [11] [12] [13]
[14] [15] [16] [17]
Benning, C. et al.: Project Result Evaluation, ISO-3D, Esprit project n° 28953, T4.3/118,2001. Bisdorff, R.: Professional Careers of Retired Working Persons, in Bock, H.-H., Diday, E.,eds, Analysis of Symbolic Data, Springer , pp. 356-369, 2000. Bock, H. and Diday, E: Analysis of Symbolic Data,. Exploratory methods for extracting statistical information from complex data, Springer Verlag, Heidelberg, 2000. Carlis, J. and Konstan, J.: Interactive Visualisation of Serial Periodic Data, in Proceedings of UIST’98. Cleveland, W.S.: Visualizing Data, AT & Bell Labora-tories, Murray Hill, New Jersey, 1993. da Silva, A.A., Marcelo, C. and Rodrigues, D.: Especifidades Regionais do Emprego em Portugal: Contributo da Analise Multivariada de Objectos Simbolicos, Revista de Estudos Regionais n° 2, Região de Lisboa e Vale do Tejo, Instituto Nacional de Estatistica Portugal, ISSN-0874-8675, 2001. Grinstein, G., Trutschl, M. and Cvek, U.: High-Dimensional Visualizations, in Workshop on Visual Data Mining, ed. by Keim, A. and Eick, St., San Francisco, KDD - 2001. Han, J. and Kamber, M.: Data Mining, Concepts and Techniques, Morgan Kaufmann Publishers, Academic Press, San Francisco, 2001. Inselberg, A., Dimsdale, B.: Parallel coordinates: a tool for visualizing multi-dimensional geometry, San Francisco, Visualization’90. Keim, D.: Visual Database Exploration, Tutorial notes, Institute for Computer Science, University of Halle-Wittenberg. Iztueta, A. and Calvo, P.: Comparing European Labour Force Survey Results from the Basque Country and Portugal, in Bock, H.-H. and Diday, E., Analysis of Symbolic Data, Springer, pp. 374-382, 2000. Marcelo, C., Calvo, P.and Laaksonen, S.: User Requirements and Context of Use, ASSO, IST-200025161, D2.1 deliverable, 2001. Marcelo, C. and Diday, E. (2001): The quality Control on Statistical Production by Symbolic Data Analysis and SODAS software - A case study, in Proc. The International Conference on Quality in Official Statistics, Stockholm, Sweden, May 14-15, 2001. Noirhomme-Fraiture, M.and Rouard, M.: Representation of Sub-Populations and Correlation with Zoom Star, in Proc. NTTS’98, EUSTAT, Sorrento. Noirhomme-Fraiture M. and ,Rouard, M.: Visualisation de données multivariées: évaluation de la représentation en étoile zoom, short paper in conf. IHM’98, Nantes, 2-4 sept 98. Noirhomme-Fraiture, M. and Rouard, M: The Zoom Star Representation, in Bock, H., Diday, E., Analysis of Symbolic Data, Springer, 2000. Rao, R. and Card, S.K.: The Table Lens: Merging Graphical and Symbolic Representation in an Interactive Focus + Context Visualization for Tabular Information, Proc. Human Factors in Computing Systems CHI’94 Conf, Boston, MA, pp. 318-322,1994.
The Electronic Journal of SYMBOLIC DATA ANALYSIS – Vol.0 N. 0 (2002).
13
[18] [19]
Schneiderman, B.: Tree Visualization with Treemaps: A2D Space-Filling approach, ACM Transactions on graphics, Vol. 11, n° 1, pp. 92-99, 1992. Wong, P.C. and Bergeron, R.D.: 30 years of Multidimensional Multivariate Visualization. Proc. Workshop on Scientific Visualization, IEEE, 1995.
The Electronic Journal of SYMBOLIC DATA ANALYSIS – Vol.0 N. 0 (2002).
14