Visualization Techniques for Computer Network Defense Justin M. Beavera , Chad A. Steeda , Robert M. Pattona , Xiaohui Cuia , and Matthew Schultzb a Oak
Ridge National Laboratory, 1 Bethel Valley Rd., Oak Ridge, TN, USA; University, 1971 University Boulevard, Lynchburg, VA, USA
b Liberty
ABSTRACT Effective visual analysis of computer network defense (CND) information is challenging due to the volume and complexity of both the raw and analyzed network data. A typical CND is comprised of multiple niche intrusion detection tools, each of which performs network data analysis and produces a unique alerting output. The state-of-the-practice in the situational awareness of CND data is the prevalent use of custom-developed scripts by Information Technology (IT) professionals to retrieve, organize, and understand potential threat events. We propose a new visual analytics framework, called the Oak Ridge Cyber Analytics (ORCA) system, for CND data that allows an operator to interact with all detection tool outputs simultaneously. Aggregated alert events are presented in multiple coordinated views with timeline, cluster, and swarm model analysis displays. These displays are complemented with both supervised and semi-supervised machine learning classifiers. The intent of the visual analytics framework is to improve CND situational awareness, to enable an analyst to quickly navigate and analyze thousands of detected events, and to combine sophisticated data analysis techniques with interactive visualization such that patterns of anomalous activities may be more easily identified and investigated. Keywords: cyber defense, visualization, visual analytics, knowledge discovery
1. INTRODUCTION The establishment and maintenance of a secure computing environment is a common goal in both government and industry. Organizations rely on the Internet for efficient access to distributed information resources and services, but by allowing that access, they expose their infrastructure to the possibility of intrusion and exploitation. Typically, an enterprise will defend itself by implementing a collection of components designed to prevent and detect attacks. It is usually the role of an organization’s Information Technology (IT) office to select, configure, operate, and maintain a cyber security toolset, or system of components, to establish a cyber defense appropriate to the information assurance needs. Due to the complexity and broad range of cyber attacks, implementing a comprehensive intrusion detection solution is largely unrealistic. As a result, several niche tools and systems exist that are focused on a particular type of attack or on very specific aspects of the computing environment such as network traffic, communication protocols, host activity, and application-specific protocols. An organizations intrusion detection capability is considered more comprehensive and effective if several variations of IDS components are deployed. The weakness in this approach is that the organization has no unifying analysis of the CND system. That is, each niche tool provides insight into one single aspect of the spectrum of possible cyber security issues, but there is little capability to correlate data across tools or to unify data for a truly comprehensive view. This is compounded when the performance of common IDS tools trends towards high error rates as is typically reported.1 The multi-modal, multi-source data produced by a CND is typically comprised of intrusion detection system alerts, system log messages, and network monitor alarms. Each of these outputs has its own format, reporting method, and alerting frequency. A significant challenge for cyber security system developers is the presentation Further author information: (Send correspondence to J.M.B.) J.M.B.: E-mail:
[email protected], Telephone: 1 865 576 0327 C.A.S.: E-mail:
[email protected] R.M.P: E-mail:
[email protected] X.C.: E-mail:
[email protected] M.S.: E-mail:
[email protected]
of this information to an operator for rapid understanding and analysis. Operators must be able to quickly disposition alerts and events in order to respond to attacks effectively and reliably discern real threats from anomalous use. This paper describes the Oak Ridge Cyber Analytics (ORCA) system, which addresses technology gaps in the aggregation and presentation of cyber security data for situational awareness. The ORCA system collects cyber security data from multiple IDS and metric collectors, combines the data into a common representation, and applies advanced analysis techniques, such as semi-supervised machine learning, data clustering, raw text categorization, and swarm intelligence, to the collected data. The purpose of the ORCA visualization is to provide a decision support environment where an analyst can easily identify, investigate, and discover attack patterns in the data. The ORCA system is an adaptive solution for the identification, analysis, modeling, and risk assessment of cyber security events. R R ORCA has been developed as a Adobe Flex interface that utilizes the Adobe BlazeDS remote Java object application server system. This Rich Internet Application (RIA) provides the visualization and control components that facilitate intuitive analysis of the data. In this paper, we will describe the visualization techniques that have been incorporated into ORCA to improve the cyber security data analysis.
2. RELATED WORK The visualization of cyber security data is a relatively new extension of visual analytics, with most of the research having been produced in the last decade. The diversity of cyber security data products has resulted in a wide variety of methods for highlighting anomalous security events and providing situational awareness. Approaches such as visualization of network traffic payloads,2 presenting unique network connections using parallel coordinates,3 and radial charts to summarize alert traffic4 are a few examples. In terms of network situational awareness, both the IDS Rainstorm5 and SIFT6 tools present the state of an organization’s networks and connections in order to aid an operator’s understanding and provide decision support. The visualization approach taken for ORCA differs from these prior works in several ways. ORCA does not attempt to visualize the raw IDS output, but visualizes fused output. IDS alert data is aggregated and several analytics are applied prior to visualization. This method is an advantage in decision support because the operator can leverage the more comprehensive pattern searching capability provided by the underlying analytics, resulting in a more rapid diagnosis of threats. ORCA also provides multiple coordinated analytic views of the same fused data set, allowing for the exploration of the data through its interactive components, giving the operator a broader situational overview of anomalous patterns. ORCA uses several different supervised and unsupervised learning approaches as the basis for its analytic toolset, and then leverages existing visual components to present that information. For example, the sunburst diagram used to present clustered alert text in ORCA utilizes a radial space-filling (RSF) tree layout as implemented in the prefuse flare library.7 This layout is from the radial graph-drawing family of visualization techniques, which have appeared previously in the visualization research literature. In particular, the approach is related to the semi-circular RSF hierarchies of Information Slices8 and the focus+context interaction techniques for fully circular Sunburst visualizations.9 By adding support for brushing and interactive radial distortion, the InterRing10 visualization expands RSF tree interaction techniques. More recently, Docuburst11 combines RSF visualization and said interaction capabilities to represent text document content for drill down analysis.
3. ORCA ARCHITECTURAL OVERVIEW Architecturally, ORCA is a combination of custom-built and third-party software focused on aggregating the cyber security data from various sources. Network alerts and log files are produced by commercial IDS tools, analysis tools, and logging mechanisms. These alerts and logs are aggregated in an off-the-shelf data warehouse product called Splunk.12 ORCA queries Splunk periodically in order to determine when new alerts have been generated by the CND enclave. In addition to accessing alert data through Splunk, ORCA also includes a custom-developed package that maintains network traffic statistics and metrics, based largely on the metrics provided as part of the KDD
99 dataset∗ . There are two levels of statistics tracked: interface-level statistics and connection-level statistics. Interface-level statistics summarize all activity detected on the network interface. Connection-level statistics are tracked for each unique connection detected on the network interface. The alert data and network statistics are fused to provide a broad set of information upon which the various ORCA analytics can perform advanced computation and processing on the collection of cyber events. ORCA is comprised of several analytic components to provide the basis for its visualizations. The Temporal Analysis component provides a time-based and connection-based view of the events relative to each other. The Cluster Analysis applies raw text analysis and clustering algorithms to provide a hierarchical organization of the events. The Particle Swarm Optimizer analyzes behavior patterns over time to highlight behaviors that are consistent with known attack patterns. ORCA Categorization automatically classifies alerts produced by the various IDS sources based on two different appraoches: text classification using the terms and phrases in the alert text, and semi-supervised machine learning which classifies based on the network statistics.
(a)
(b)
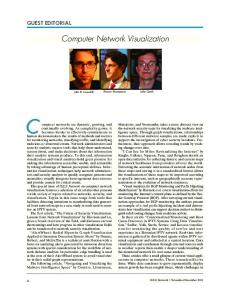
Figure 1. The ORCA Correlation Engine (a) configuration view provides access to the Engine Selector, Data Configuration, Engine Configuration, and Alert Display. The ORCA Analysis Engine (b) configuration view gives the analyst the ability to specify a range of events in the Search Area. This view also provides an Analysis Area toolbar that shows the available analysis methods for the retrieved data.
ORCA offers an intuitive user interface for interaction with its analytic components. The Correlation Engine view shown in Fig. 1(a) provides controls for the real-time components of ORCA that acquire and aggregate the CND data. The Engine Configuration Panel provides the different options for configuring and controlling it’s near-real-time fusion engine. The Data Configuration panel allows the user to identify the data store to use for correlation and also provides the control for initiating and terminating the Network Feature Extractor. The Alert Display area lists the events that the Correlation Engine has determined are most similar to an attack pattern. The Analysis Engine view is shown in Fig. 1(b). The Search Area gives the analyst the ability to specify a range of events to retrieve from the data store. The Analysis Area is the space where the coordinated analytic views, operating on the retrieved data, are presented. A toolbar allows an operator to switch between views and interact with a different analytic component. Each of these analytic components are discussed in the sections below. ∗
http://www.ll.mit.edu/IST/ideval/data/1999/1999 data index.html
Figure 2. ORCA’s cyber event cluster analysis view.
4. CYBER EVENT CLUSTER ANALYSIS The ORCA cluster analysis view (see Fig. 2) applies raw text analysis and clustering algorithms to the textual alert information yielding a hierarchical view of the alerts. The cluster analysis panel arranges the cyber events in terms of similarity within a Sunburst diagram, with the center being the point of no similarity and the outer ring being the highest similarities. Each gray band displayed outside of the center circle represents a collection of cyber events that are similar as determined by user-defined similarity threshold values. These gray summary bands can be selected with a mouse click by the analyst to include or exclude a collection from the analysis view. The cluster analysis provides a frequency-based view of the cyber events, showing groupings of similar events across the spectrum of retrieved events. The analyst uses this view to visualize the distribution of events across categories and in terms of the event text. Events that are dissimilar to the rest of the events are quickly highlighted through a lack of grouping. Furthermore, the cluster view provides analytic interaction with the data behind the visualization. A mouse-over operation of both events and event collections provide summary statistics via a details pop-up panel. The operator may also select different collections to highlight or eliminate them from the view. Additionally, the operator may bring up the details on a specific cyber event. The cluster view facilitates rapid exploration of the thousands of alerts thereby streamlining the identification of significant subsets of information for deeper investigation.
5. SWARM ANALYSIS Swarm analysis is the application of nature-inspired algorithms for determining similarity. In swarm analysis, data are represented as particles in a space, with each particle defined by a set of attributes. A simulation is run whereby particles are moved randomly about the space and group, or flock, with other particles based on the similarity of their respective attributes. Our implementation of swarm analysis algorithms applied to the cyber security data leverages multiple visual models to supply the users a full view of current behavioral status. It is intended for enterprise-level cyber security information comprehension. The following subsections describe the various developed swarm analysis models.
5.1 Event Only Model In the event-only model (see Fig. 3), each alert event is represented as one dot in the visual space, and characterized by its alert text features. To aid in the representation, the system assigns randomly generated colors for each unique alert event. Using the flocking algorithm13 as the basis for determining similarity, all alert events quickly self-organize into multiple groups. The alert events that swarm together are events that are similar to each other. This representation offers the analyst an overview of the diversity in the behavior patterns. Unique alert events are ones that do not group with other events and therefore may be a focal point for investigation. The configuration shown in Fig. 3 indicates that although the system has received thousands of alert events, there are about 10 to 12 different behaviors and most events can be attributed to one of the similar behaviors. By moving the mouse over a dot, the system will automatically display the detail information about the associated alert event. The system also provides an interface for adjusting the parameters of the particles movement.
(a)
(b)
Figure 3. Event-only swarm model visualizations (a) at the start of the swarm analysis with all events randomly placed in the space, and (b) after swarming with similar events grouping together.
5.2 Simultaneous Attack Discovery Model In this model, the system focuses on analysis of each individual IP addresss attacking behavior. We hypothesize that some attackers or hacking organizations might launch simultaneous cyber attacks on a government organization from different machines with different IP addresses. Although the attacks are launched on different machines, the attack strategies, methods, and tools are most likely the same. The alert sequences triggered by those different IP address should be similar. These alert sequences can be considered as the attacking behavior of the IP address. In Fig. 4, each colored dot represents one single IP address and tits associated alert patterns over time. The applied swarm algorithm groups IP addresses with similar alerting behaviors. If one group in the system appears significantly larger than other groups, it can indicate that the organization is under a simultaneous attack from different IP addresses.
5.3 Historical Behavior Discovery Model Most experienced criminals have a pattern when they conduct a crime, and the same holds with the cyber attacker. They tend to use similar methods or tools to conduct an attack on different machines. We can analyze the historical data to build different kinds of attacker behavior models and compare those models with current data in order to find the similarities. In Fig. 5, each colored dot represents one single IP address and the behaviors this IP address has exhibited in recent time. The black dots represent various attacker behavior models
(a)
(b)
Figure 4. Simultaneous attack swarm discovery model visualizations (a) at the start of the swarm analysis with all Source IP address behaviors represented as unique dots and randomly placed in the space, and (b) after swarming with similar source IP behaviors grouping together.
constructed from the historical data. When the colored dots group with a black dot, it indicates that the source IP address represented by that colored dot is behaving similar to attack behaviors described in the historical data sets. This information provides an investigative focus for operators, as the analytics have highlighted a pattern consistent with known malicious behavior and attributed it to a specific IP address.
(a)
(b)
Figure 5. Historical behavior swarm discovery model visualizations (a) at the start of the swarm analysis with all Source IP address behaviors and malicious behaviors (black dots) randomly placed in the space, and (b) after swarming with some source IP behaviors grouping with known malicious behaviors.
Figure 6. Temporal cyber event viewer.
6. TEMPORAL ANALYSIS The Event Viewer is an ORCA tool that presents the temporal pattern of events. Fig. 6 shows the Event Viewer and its graphical representation of several cyber events. The Event Viewer is a two-dimensional graph, with the x-axis representing time and the y-axis representing unique source-destination connections. Each Cyber Event is represented as a small, semi-transparent circle in the graph space, aligned vertically with the connection on which the event occurred and horizontally with the time that the event occurred. The Cyber Events are also color-coded according to the raw text categorization of the event. The legend for this categorization is displayed on the right-hand side of the display.
7. EVENT CATEGORIZATION The Categorization View displays the distribution of both the categorized and classified cyber security events. We use the term categorization to refer to the application of a text classifier, and the term classification to refer to the application of a machine learner on network statistics. Events are categorized by comparing the similarity of the terms and phrases in the alert text with the terms and phrases in user-defined categories. Each event gets assigned the category for which it has the highest computed similarity value. The distribution of categorized events is displayed in a pie chart on the Categorization panel as shown in Fig 7(a). The categories can be hand-edited by an operator from the Categorization panel. Unlike existing approaches, this method can be run autonomously and periodically in order to maintain a current profile of categorized alerts for a networked environment. In addition to the distribution of categorized events, the Categorization panel provides visibility into the machine learners classification of the events, as shown in Fig 7(b). Each analyzed event is processed by the semisupervised machine learning algorithm and placed into a class based on the collected network statistics associated with that event. The Categorization view provides a pie chart display that summarizes the distribution of these classes, or labels, for all retrieved events. The Categorization View is useful for visualizing the frequency of categories and classes of alerts, and thus provides an analyst with a rapid sense of the types of events being processed.
(a)
(b)
Figure 7. ORCA Event Categorization view showing (a) a distribution of alerts categorized with the text classifier, and (b) a distribution of alerts classified using the semi-supervised machine learner.
8. EVENT LABELING AND CATEGORIZATION INFRASTRUCTURE The ORCA Analysis Engine provides an environment where an operator can explore and interact with the cyber security data in order to identify patterns and potential attack behaviors from the data. However, in order to persist the knowledge gained from the operators analysis, a feedback mechanism must exist such that the ORCA toolset adapts to the new information. ORCA includes the ability for operators to label and categorize events from the Analysis Engine such that these inputs will persist. Labeling an event will associate a name with the event that is used as example data when training the machine learning classifiers. From an operational perspective, this means that an operator can identify a previously unseen attack pattern in the data, label the appropriate events as an example of that attack pattern, and have the machine learner use that example to detect that pattern of attack the next time it is seen. The same capability exists for categorization of terms and phrases in an event. The operator may designate a collection of events for categorization and the selected category will be updated with the terms and phrases from the alert, allowing for an adjusted categorization on the next pass.
9. CONCLUSION In this paper, we presented several new approaches to visualizing CND data in order to provide situational awareness for IT system operators, and a means for interactive exploration. The Temporal Analysis and Cluster Analysis reveal patterns in real-time alert data, both in terms of their connections and timing, and the alert text themselves. The incorporation of Swarm Analysis provide a means to interact with CND data to discover patterns in experienced alerts. The Categorization view applied two different classifiers to fused event data to visualize the distribution of categories of information. The volume and complexity of cyber security data demands a visual environment that does not just present the data, but presents it through analytics in order to highlight patterns of potential interest. This work is intended as a step towards more reliable situational awareness in CND, where processed information is reliable presented such that human operators can make informed response decisions.
ACKNOWLEDGMENTS Prepared by Oak Ridge National Laboratory, P.O. Box 2008, Oak Ridge, Tennessee 37831-6285; managed by UT-Battelle, LLC, for the Department of Energy under contract DE-AC05-00OR2225. This manuscript has been authored by UT-Battelle, LLC, under contract DE-AC05-00OR22725 for the U.S. Department of Energy. The United States Government retains and the publisher, by accepting this article for publication, acknowledges that the United States Government retains non-exclusive, paid-up, irrevocable, worldwide license to publish or reproduce the published form of this manuscript, or allow others to do so, for United States Government purposes.
REFERENCES [1] Brugger, S. T. and Chow, J., “An assessment of the DARPA IDS Evaluation Dataset using Snort,” Technical Report CSE-2007-1, UC Davis, Davis, CA (Jan. 2007). [2] Conti, G., Grizzard, J., Ahamad, M., and Owen, H., “Visual exploration of malicious network objects using semantic zoom, interactive coding, and dynamic queries,” in [IEEE Workshop on Visualization for Computer Security ], (October 2005). [3] Conti, G. and Abdullah, K., “Passive visual fingerprinting of network attack tools,” in [ACM Workshop on Visualization and Data Mining for Computer Security ], (October 2004). [4] Foresti, S., Agutter, J., Livnat, Y., Moon, S., and Erbacher, R., “Visual correlation of network alerts,” IEEE Computer Graphics and Applications 26 (March 2006). [5] Abdullah, K., Lee, C., Conti, G., Copeland, J., and Stasko, J., “Ids rainstorm: Visualizing ids alarms,” in [IEEE Workshop on Visualization for Computer Security ], (October 2005). [6] Yurcik, W., “Visualizing netflows for security at line speed: The sift tool suite,” in [19th USENIX Large Installation System Administration Conference ], (December 2005). [7] Heer, J., Card, S. K., and Landay, J. A., “prefuse: A toolkit for interactive information visualization,” in [Proc. of the SIGCHI Conference on Human Factors in Computing Systems ], 421–430, ACM Press (Apr. 2005). [8] Andrews, K. and Heidegger, H., “Information slices: Visualizing and exploring large hierarchies using cascading, semi-circular discs,” in [Proc. of IEEE Symposium on Information Visualization, Late Breaking Hot Topic ], 9–12, IEEE Computer Society (1998). [9] Stasko, J. and Zhang, E., “Focus+context display and navigation techniques for enhancing radial, spacefilling hierarchy visualization,” in [Proc. of IEEE Symposium on Information Visualization ], 57–65, IEEE Computer Society (2000). [10] Yang, J., Ward, M. O., and Rundensteiner, E. A., “Interring: An interactive tool for visually navigating and manipulating hierarchical structures,” in [Proc. of IEEE Symposium on Information Visualization ], 77–84, IEEE Computer Society (2002). [11] Collins, C., Carpendale, S., and Penn, G., “Docuburst: Visualizing document content using language structure,” in [Proc. of Eurographics / IEEE-VGTC Symposium on Visualization (EuroVis 2009) ], 1039– 1046, IEEE Computer Society (Jun. 2009). [12] Splunk, “http://www.splunk.com.” [13] Cui, X., Gao, J., and Potok, T. E., “A flocking based algorithm for document clustering analysis,” Journal of System Architecture 52, 505–515 (Aug. 2006).